

Non-intentional farm injury fatalities in Australia, 2003–2006
Tony Lower A B and Emily Herde AA Australian Centre for Agricultural Health and Safety, The University of Sydney
B Corresponding author. Email: tony.lower@sydney.edu.au
NSW Public Health Bulletin 23(2) 21-26 https://doi.org/10.1071/NB11002
Published: 28 March 2012
Abstract
Aim: To describe the pattern of non-intentional farm-related fatalities in Australia for 2003–2006 and examine trends. Methods: Data from the National Coroners Information System were analysed to define all non-intentional farm injury fatalities for the period. Results: The incidence of farm fatalities has declined by 44% over the past 20 years from an average of 146 deaths per year to 82 deaths per year. For adults there are high numbers of fatalities related to tractors, quad bikes and farm utilities. Children aged under 15 years account for 17% of fatalities, with dams or other water bodies and quad bikes remaining the most common causes of non-intentional farm fatalities. Almost half of all on-farm non-intentional fatalities are non-work-related. Conclusion: Future interventions targeting these priority areas are required to reduce the incidence of non-intentional farm-related fatalities within Australia.
Farming is regarded internationally as a high-risk industry for injury and fatalities.1 Despite significant reductions in farm-related fatalities over the past 15 years in Australia, agriculture remains a high-risk industry and lags behind the occupational health and safety gains made in other primary industries such as mining and construction.2,3 Furthermore, as most farms in Australia are family owned and operated, the distinction between the workplace and family home environments is often difficult to discern. In turn, this poses significant challenges for the health and safety of not only farmers and their staff, but also family members and visitors.
The inaugural assessment of farm-related fatalities in Australia was based on data covering the 1989–1992 period.2 In this period there were 587 fatalities, with an annual mean of 146 cases. When examined in respect to annual deaths per 100 000 employees, the rate of work-related fatalities was 23.3 per 100 000 population. This rate is high compared to an all industries rate of 5.5 per 100 000 population in the same period.4 Additionally, it was identified that the rate of fatal injury per 10 000 farms was 9.1 per year.
With core infrastructure support provided by NSW Health through the former Hunter New England Area Health Service, the Australian Centre for Agricultural Health and Safety has provided research for information on farming-related fatalities, injuries and their prevention for over 2 decades. The National Farm Injury Data Centre within the Australian Centre for Agricultural Health and Safety draws on fatality data from the National Coroners Information System (NCIS).5 These data have been used to report on the nature of fatalities in agriculture, with this evidence being employed to drive new preventive programs of work across Australia.2,6,7
This paper presents the most recent data on non-intentional farm fatalities based on the NCIS data for the period 2003–2006 and examines trends over time. On-farm fatalities are defined as those non-intentional injuries occurring to farmers and workers undertaking work in agricultural production, as well as to those in the farm workplace as bystanders to work being undertaken, and others in the course of leisure but harmed by hazards used in farm production.2,8
Methods
Data from the NCIS were reviewed on a case-by-case basis for the period 2003–2006. The NCIS is the central repository of information about every death reported to an Australian coroner since July 2000 (January 2001 for Queensland).5 The criteria that determine if a death will be reported to the relevant state coroners’ office varies between jurisdictions. However, in general terms and in the context of farm injury for this paper, the criteria include: (i) where the person died unexpectedly and the cause of death is unknown; (ii) where the person died in a violent or unnatural manner; and (iii) where a doctor has been unable to sign a death certificate giving the cause of death.
When deaths are referred to a coroner in one of the states or territories, preliminary information is automatically uploaded into the NCIS. These cases remain ‘open’ until the coroner hands down a final determination on each case when it is then ‘closed’. Only ‘closed’ cases have been included in this review; ‘open’ cases generally have limited available detail, particularly in relation to the agent and mechanism of injury.
The NCIS is also able to provide detail on the proportion of cases ‘open’ and ‘closed’ in each state and territory by year. To avoid large underestimation of totals for this study it became necessary to apply inclusion criteria (i.e. a national case closure rate of ≥90% for the years to be included in the study period). At the time of assessment, this meant that data to 2006 could be included in this study.
The process for extracting the relevant data for the 2003–2006 period involved several data reviews and was finalised in February 2010. All deaths for each year due to external causes were obtained using query design searches. The identification of deaths of relevance involved a number of coded and keyword searches of the NCIS based on the Farm Injury Optimal Dataset, with cases that were not farm-related being withdrawn from the dataset.8 The Optimal Dataset also provides specific codes on relevant agents of injury in agricultural, for example tractors, quad bikes, farm dams and grain augers, and has been widely used in other Australian fatality and injury studies in the agricultural sector.2,6,7 Cases that were confirmed as intentional by the coroner were also withdrawn from the file. A final verification process assessing farm-related deaths identified in the Media Monitors database was undertaken to match any reported cases with relevant detail in the NCIS.
Following the identification of the non-intentional farm-related deaths, exploration of attached documents such as police, toxicology and reports of coroners’ findings was completed. Data from this analysis are presented with reference to the appropriate denominator data with all rates calculated using Australian Bureau of Statistics estimates for the relevant year.9–12
Results
Age and gender
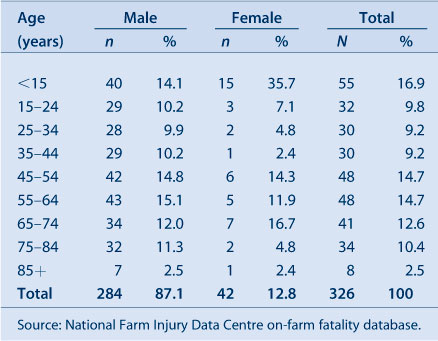
In the period 2003–2006, there were 326 non-intentional farm-related injury fatalities. Of these, 87% occurred in males and 13% in females. Overall, 17% of all deaths occurred in those aged less than 15 years and 40% occurred in people aged over 55 years (Table 1).
|
On-farm deaths for each year and number of agricultural establishments
The mean number of non-intentional farm injury deaths was 82 each year. Notwithstanding the further addition of ‘closed’ cases for these data, a continued downward trend in the overall number and rates of deaths per 10 000 agricultural establishments by year is apparent (Table 2).

|
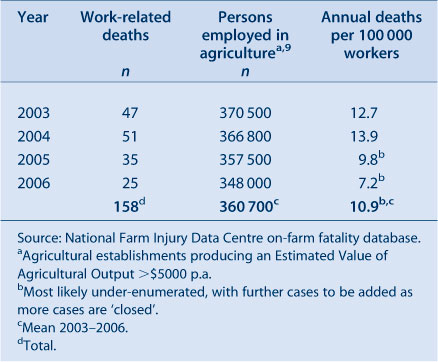
On-farm work-related deaths for each year and number of agricultural workers
A total of 303 cases could be defined as either work-related (52%) or non-work-related (48%). Table 3 describes the work-related cases (n = 158) assessed in relation to deaths per 100 000 agricultural workers.
|
Agents of injury
The leading agents of farm injury across all age groups were tractors (17.5%; n = 57), with quad bikes (9.2%; n = 30), farm utilities (8.2%; n = 27) and dams (5.5%; n = 18) all featuring (Table 4).

|
For the 271 adult (aged over 15 years) fatalities, tractors (n = 57), quad bikes (n = 23), farm utilities (n = 23) and two-wheeled motorcycles (n = 14) were the leading agents. These four agents alone were responsible for 43% of the adult fatalities on farms.
Of the 55 fatalities in children (aged less than 15 years), the prime agents associated with deaths were drowning in dams (n = 13) and other water sources such as tanks and creeks and rivers (n = 12). Overall, drowning (n = 25) and quad bikes (n = 7) accounted for 58% of all child deaths on farms.
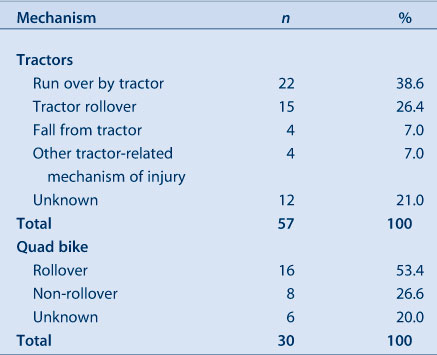
A further analysis of mechanisms associated with the two leading causes of fatality was also undertaken (Table 5). This revealed that almost 40% of tractor deaths were the result of being run over, while over 50% of quad bike fatalities involved rollover events.
|
Discussion
These data indicate persisting high numbers of fatalities related to tractors, quad bikes and farm utilities, representing 46% of fatalities across all ages. For children less than 15 years, dams or other water bodies and quad bikes remain the most common agents of fatalities; children make up 17% of all fatal cases. People aged 55 years and over account for 40%.
In comparison to previous data covering the 1989–1992 period, these data indicate a 44% reduction in the mean number on-farm non-intentional fatalities from 587 during the period 1989–1992 (mean 146) to 326 (mean 82) in 2003–2006.6 Furthermore, if assessed on the basis of annual deaths per 100 000 employees, the rates of work-related fatalities dropped from 23.3 per 100 000 population in 1989–1992 to 10.9 per 100 000 population in the second period (54% reduction). A similar reduction is also apparent when assessed by annual deaths per 10 000 agricultural enterprises – 9.1 per 10 000 farms to 5.9 per 10 000 farms (35% reduction).6 Overall, these findings support the continued downward trend in non-intentional farm injury fatalities identified in an earlier report.2
This assessment replicates earlier studies by incorporating all non-intentional on-farm injury fatalities. This allows comparative analysis over time, and also captures all of the data relating to work- and non-work-related fatalities on farms. With over 90% of Australian farms being family owned and operated, the farm is frequently both a workplace and a family home, where workers, family and visitors congregate. This provides major challenges in maintaining health and safety as the environment does not tend to be as controlled as those locations (e.g. construction sites/mines) that are clearly delineated as work areas. Moreover, this is reflected by the high proportion of cases that are non-work-related, which corroborates earlier findings.2 Undoubtedly, a significant driver behind this result is the fact that nearly all child deaths fall into this non-work-related category.
A limitation of this study is that only cases closed by the NCIS have been used and that further cases are likely to be added, particularly for 2005 and 2006. However, previous experience of the National Farm Injury Data Centre suggests that only a relatively small number of cases are likely to be added. Furthermore, changes adopted by the Australian Bureau of Statistics in 2006 using the Australian and New Zealand Standard Industrial Classification have resulted in an increase in the number of agricultural establishments identified from 2006 onwards.12 Consequently, this impacts slightly on some of the data presented relating to rates of death where agricultural establishments are used as a denominator. Nonetheless, whether measured by rates per 10 000 agricultural establishments, work-related deaths per 100 000 workers or on actual numbers, the pattern reflects a downward trend in fatalities.
Conclusion
Despite progress in reducing the number of non-intentional farm injury deaths throughout Australia, work remains to be done. These data suggest that there are several common sources of non-intentional farm injury fatalities, all of which have well-defined solutions. This database is the only one of its type servicing agriculture in Australia; the continued compilation of data will underpin the evidence base for action. Future interventions targeting these priority areas are needed to allow for further reductions in farm-related deaths.
Acknowledgments
The authors would like to acknowledge the National Coroners Information System for data access and the Hunter New England Local Health Network for the provision of core funds to enable this work to be undertaken.
References
[1] Rautiainen RH, Lehtola MM, Day LM, Schonstein E, Suutarinen J, Salminen S, et al. Interventions for preventing injuries in the agricultural industry. Cochrane Database Syst Rev 2008; (Issue 1) CD006398[2] Fragar L, Pollock K, Morton C. The Changing Profile of Australian Farm Injury Deaths. Journal of Occupational Health and Safety – Aust & NZ 2008; 24(5): 425–33.
[3] Safe Work Australia. Work-related traumatic injury fatalities, Australia 2006–07. Commonwealth of Australia, Canberra; 2009.
[4] National Occupational Health and Safety Commission. Work-related fatalities in Australia, 1989 to1992. National Occupational Health and Safety Commission, Sydney; 1998.
[5] National Coroners Information System. Available from: http://www.ncis.org.au/
[6] Franklin R, Mitchell R, Driscoll T, Fragar L. Farm-related fatalities in Australia, 1989–92. Australian Centre for Agricultural Health and Safety and Rural Industries Research and Development Corporation, Moree, NSW; 2000.
[7] Pollock K, Fragar L, Morton C. Traumatic Deaths in Australian Agriculture – The Facts. Australian Centre for Agricultural Health and Safety and Rural Industries Research and Development Corporation: Kingston; 2007.
[8] Fragar L, Franklin R, Coleman R. The Farm Injury Optimal Dataset: Version 1.2. Australian Centre for Agricultural Health and Safety and Rural Industries Research and Development Corporation: Moree, NSW; 2000.
[9] Australian Bureau of Statistics. Agricultural Commodities, Australia 2002–2006 (Pub No. 7121.0). ABS: Canberra; 2010.
[10] Australian Bureau of Agricultural and Resource Economics. Australian commodity statistics 2009. ABARE: Canberra; 2009.
[11] Australian Bureau of Statistics. Population Census 2006. ABS: Canberra; 2006.
[12] Australian Bureau of Statistics. Australian and New Zealand Standard Industrial Classification (ANZSIC) (cat. no. 1292.0). ABS: Canberra; 2006.