

Notifications of Q fever in NSW, 2001–2010
Chris P. Lowbridge A E , Sean Tobin B , Holly Seale C and Mark J. Ferson C DA NSW Public Health Officer Training Program, NSW Department of Health
B Communicable Diseases Branch, NSW Department of Health
C School of Public Health and Community Medicine, The University of New South Wales
D South Eastern Sydney Illawarra Public Health Unit, NSW Health Transitional Organisation Southern
E Corresponding author. Email: clowb@doh.health.nsw.gov.au
NSW Public Health Bulletin 23(2) 31-35 https://doi.org/10.1071/NB11037
Published: 28 March 2012
Abstract
Q fever is the most frequently notified zoonotic infection in NSW residents. The past decade has seen the introduction of a targeted national Q fever vaccination program. Methods: We undertook a descriptive analysis of Q fever notifications in NSW, for the period 2001–2010. Results: A total of 1912 cases of Q fever were notified in NSW between 2001 and 2010 (average 2.8 per 100 000 persons per annum). The majority of Q fever cases were reported in men, aged 40–59 years, living in rural NSW and working in agricultural related occupations. Conclusion: The results suggest changes in the epidemiology of Q fever in response to the targeted vaccination program.
Q fever is an important human and veterinary disease worldwide and is most significant in areas where its primary reservoir, cattle, sheep and goats, resides in close proximity to humans. In Australia, Q fever is endemic, with between 300 and 800 cases notified annually over the past decade, primarily in the eastern states.1 In New South Wales (NSW), the majority of Q fever notifications have occurred in the rural areas of the state's west.2
Q fever is caused by the pathogen Coxiella burnetii, which has recently been removed from the Rickettsiales; C. burnetii is now considered more closely related to the Legionella genus.3 Transmitted most commonly via the airborne route, the organism is carried in dust contaminated with tissue, birth fluids or excreta from infected animals. Q fever commonly presents as a self-limiting febrile illness with malaise, weakness, headache and chills.4 The severity and duration of illness varies greatly. In up to 50% of cases infection is asymptomatic or sub-clinical.5 Complications of Q fever include pneumonia, endocarditis, hepatitis, osteomyelitis, aseptic meningitis and encephalitis.6 Acute infection may be followed by Q fever fatigue syndrome, which occurs in approximately 10% of cases and may persist for as long as 5 years.7
C. burnetii is a pathogen with the potential to cause epidemics, due to its relative ease of transmission, environmental resilience, low infective dose and airborne route of transmission.4 Outbreaks of Q fever are commonly reported. An epidemic of Q fever has been sustained in the Netherlands since 2007, with several hundred cases in humans reported each year.8–10 Outbreaks have occurred in NSW, commonly associated with abattoir and farm workers,11–13 but alternative sources such as veterinary practices as well as geographical clusters with no known likely source of infection have been reported anecdotally.
Immunisation is the primary protective measure against Q fever. A vaccine against Q fever has been available in Australia since 1989; however, initial uptake of the vaccine was low and mostly limited to staff of several large abattoirs. The National Q Fever Management Program, an initiative of the Australian Government, was launched in 2000 and implemented in NSW in 2002.14 The Program included funded screening and vaccination of workers in high-risk occupations and training for immunisation providers. The Program initially targeted abattoir workers and shearers, but was subsequently expanded to sheep, dairy and cattle farmers along with their families.14
The last 2 decades have seen significant change in the management of Q fever in NSW and Australia. This study sought to determine whether the implementation of the National Q Fever Management Program has altered the epidemiology of the disease since it was introduced in NSW.
Methods
Q fever is notifiable by laboratories under the Public Health Act 1991 (NSW). Public health units investigate all notified cases of Q fever to: collect relevant risk information; identify the likely source of infection; and, where necessary, instigate control measures. The NSW case definition for confirmed Q fever requires laboratory definitive evidence which comprises detection of C. burnetii by nucleic acid testing or culture, or by seroconversion or significant rise in titre to Phase II antigen in the absence of recent vaccination. Before 2004, the detection of IgM in the absence of recent vaccination was also accepted as evidence of infection, however, since 2004, detection of IgM is accepted only in conjunction with a clinically compatible illness.15 Confirmed cases are entered onto the NSW Notifiable Conditions Information Management System.16 Information related to chronic Q fever sequelae is not routinely collected.
Notification data for the period 2001–2010 were extracted from the NSW Health Outcomes Information and Statistical Toolkit (HOIST) using SAS (version 9.2, SAS Institute, Cary, NC, USA). Variables used in the analysis included basic demographical descriptors, jurisdiction, onset date, occupation and recorded vaccination status. Analysis of the geographical distribution of Q fever notifications in NSW was reported by Local Health District whose boundaries came into effect in January 2011. Mid-year population estimates for Local Health Districts were also obtained from HOIST. Data were analysed using JMP® (version 8).
While a small proportion of the Q fever cases notified in NSW over the study period were related to identified outbreaks, a description of Q fever outbreak investigations in NSW was not part of this review.
Results
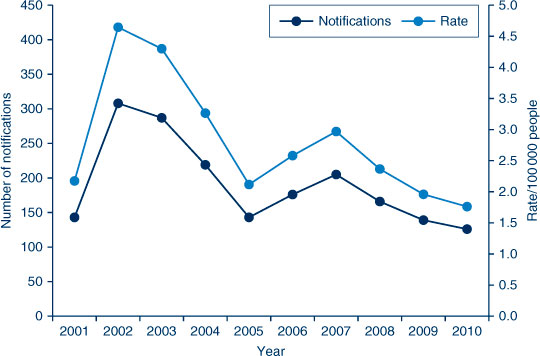
In the 10-year period (2001–2010), a total of 1912 notifications of Q fever were reported in NSW. The average annual Q fever notification rate for this period was 2.8 cases per 100 000 population. The annual rate varied from a peak of 4.5 per 100 000 population in 2002 and 2003 down to 1.8 per 100 000 in 2010 (Figure 1). Fifty-seven cases (3%) of Q fever were in people who identified as Aboriginal; however, Aboriginality was unknown or not recorded in 774 cases.
|
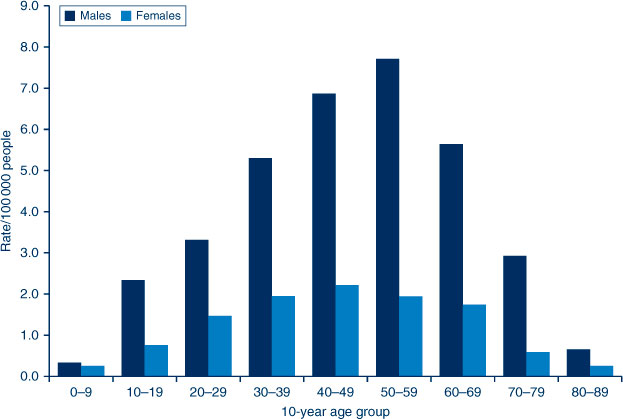
The mean age of cases was 44 years (range 1 month–86 years). Males accounted for 75% of all notifications. The highest age-specific annual notification rates were 7.7 cases per 100 000 for men in the 50–59-year age group and 2.2 cases per 100 000 for women in the 40–49-year age group (Figure 2). Twenty-six cases (1.3% of notifications) occurred among children aged less than 10 years, all of whom resided in rural and regional Local Health Districts.
|
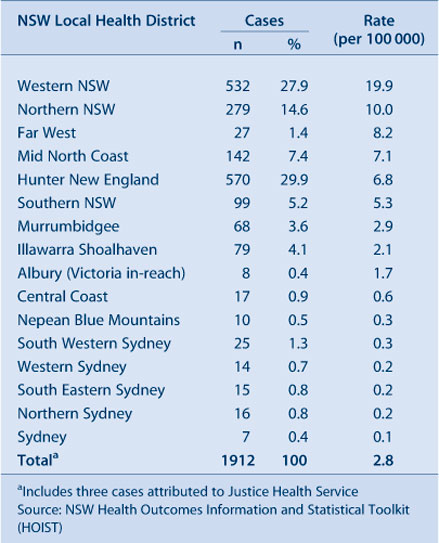
The Hunter New England and Western NSW Local Health Districts accounted for 30% and 28% of all notified Q fever cases, respectively (Table 1). Annual notification rates were highest in the Western NSW Local Health District (19.9 per 100 000) and the Northern NSW Local Health District (10 per 100 000). Metropolitan Local Health Districts recorded notification rates less than one case per 100 000 population with the exception of Illawarra Shoalhaven Local Health District (2.1 cases per 100 000).
|
Information on the occupation of the case was recorded in 1046 (55%) of notifications. Of these, the most commonly reported occupation group was agriculture related such as farmers, shearers and graziers (52%); and occupations related to the slaughter of animals and meat processing such as abattoir workers, meat workers, butchers and professional shooters (10%). The annual number of cases notified with agriculture-related occupations varied between years in proportion to the total number of cases reported, ranging from 13–36% of total annual notifications. Notifications among abattoir and related occupations remained at a constant low level, ranging from a peak of 20 cases (7% of annual notifications) in 2002 to two cases (1.6%) in 2010.
Q fever vaccination status of the case was recorded for 654 (34%) of notifications; however, of these, 72 cases (4%) were recorded as ‘unknown’ by patient and doctor. A total of 23 cases were reported to have been vaccinated prior to illness, including 15 abattoir workers. A review of the notes of vaccinated cases in the Notifiable Conditions Information Management System revealed that two cases were vaccinated within 1 week of illness onset and so would be unlikely to have developed protective immunity. Records of validation of vaccination status were not available for most of the other cases.
Discussion
Lin et al previously reported the epidemiology of Q fever in NSW2 before the introduction of the National Q Fever Management Program. Our results demonstrate significant changes in the epidemiology of Q fever in NSW since the introduction of this Program.
There has been a decrease in the overall notification rate over the last 10 years, in addition to a 26% decrease, from 3.8 cases per 100 000 between 1991 and 2000, as reported by Lin et al,2 to 2.8 cases per 100 000 between 2001 and 2010. Despite the overall reduction in cases, there was a trend towards older age and increased rates of infection in some age groups when compared to the period 1991–2000. From 1991 to 2000 the highest age-specific notification rate was in men aged 20–29 years.2 In contrast, we found the highest notification rate in the period 2001–2010 in men aged 50–59 years. These results are consistent with the findings of another national study where the decrease in cases among young males was attributed to the impact of the national vaccination program in the primary target groups.14 Females were also found to represent a greater proportion of total notifications when compared to the previous decade; 25% in 2001–2010, up from 16% in 1991–2000.
During this review period, the peak rates of disease were seen in 2003 and 2004. This is consistent with the pattern of Q fever epidemiology nationally at the time. It is hypothesised that this increase in notifications may have been due to severe drought conditions which promote airborne distribution of potentially contaminated dust particles,6,14,17 as well as increased livestock movements. National Q fever hospitalisation data show a concurrent peak in hospitalisations, supporting the idea that this peak was a true increase in disease incidence rather than increased awareness and testing.14
Abattoir and meat workers accounted for 51.4% of Q fever case notifications for 1991–20002 but notifications were seen to be declining over time. Between 2001 and 2010, notifications of Q fever in abattoir and meat workers have remained at a stable low level accounting for only 10% of notifications where occupation was recorded. In contrast, the proportion of notifications in agriculture-related occupations increased from 29% of notifications where occupation was recorded in 1991–2000,2 to 52% in 2001–2010. This pattern is consistent with previous findings18 and may be due also to greater uptake of vaccine among abattoir workers when compared to workers in the agricultural sector. However, as occupation status was missing for almost half of all notified cases in 2001–2010, caution must be exercised when examining these data for trends.
The reasons for significant variation in rates of notification between rural Local Health Districts are unclear. High notification rates were seen in central and north-western NSW, an area which typically experiences low rainfall, between 200 mm and 500 mm per year.19 As previously noted, dry conditions can promote airborne distribution of contaminated dust. However this hypothesis does not explain the high rate of notifications in the Northern NSW Local Health District, which receives relatively high average rainfall compared to elsewhere in the state.19 It is likely that the reasons for variation in Q fever notification rates across NSW are multifactorial, and may include differences in land use, livestock density, farming practices and relative proportion of the population engaged in the agricultural and meat processing industries. Variation in case ascertainment is likely to impact on notification rates, which may be due to differing levels of clinician awareness and interest in Q fever and local diagnostic testing practices.
Collection of exposure source and risk-factor data is an important aspect of the public health follow-up for Q fever notifications. The Notifiable Diseases Database, used for collection of notifiable disease case information in NSW until the implementation of the Notifiable Conditions Information Management System in 2010, included only a single occupation field for recording risk for infection. From analysis of the occupation field, it was evident that risk for, and likely source of, infection were not adequately captured. This issue has been previously described.18 Improved characterisation of risk for infection is now available in the Notifiable Conditions Information Management System through fields for collecting exposure to animals and animal-related environments.
The results of this review are limited by incomplete occupation and vaccination data. The use of these results in judging the impact of the Q fever vaccination program is also limited by the lack of data on uptake or coverage of Q fever vaccination. Consideration should also be given to the potential impact of other factors, such as drought or changes in farm animal management practices, on the epidemiology of Q fever over the review period. Nevertheless the overall decrease in the rate of Q fever notifications, together with the observed changes in age, sex and occupation distribution of cases, strongly suggest that the National Q Fever Management Program has had a positive impact in reducing the risk of human Q fever in NSW.
Conclusion
The changing epidemiology of Q fever highlights the importance of continued public health surveillance to monitor the likely source of infection in cases and to characterise emerging risk groups. This information will inform immunisation policy and enable effective targeting of vaccination programs. Public health units are encouraged to collect detailed risk factor information for notified cases, in particular, occupation and vaccination status.
References
[1] National Notifiable Diseases Surveillance System. Notification Rate of Q fever, received from State and Territory health authorities in the period of 1991 to 2010 and year-to-date notifications for 2011. In: Australian Government Department of Health and Ageing, editor. Canberra; 2011.[2] Lin M, Delpech V, McAnulty J, Campbell-Lloyd S. Notifications of Q fever in New South Wales, 1991–2000. N S W Public Health Bull 2001; 12 172–5.
| Notifications of Q fever in New South Wales, 1991–2000.Crossref | GoogleScholarGoogle Scholar |
[3] Sharp M, Corp D. The Merck Veterinary Manual [Online manual]. Whitehouse Station, NJ: Mercj & Co. Inc.; 2008. Available from: http://www.merckvetmanual.com/mvm/index.jsp (Cited 6 July 2011).
[4] Heymann DL, ed. Control of Communicable Diseases Manual. 19 edition. Washington, DC: American Public Health Association; 2008.
[5] Dupuis G, Petite J, Peter O, Vouilloz M. An important outbreak of human Q fever in a Swiss Alpine valley. Int J Epidemiol 1987; 16 282–7.
| An important outbreak of human Q fever in a Swiss Alpine valley.Crossref | GoogleScholarGoogle Scholar | 1:STN:280:DyaL2s3nvVyjsQ%3D%3D&md5=33001119050f910a3158a7e7b29f942eCAS |
[6] Marrie TJ, Raoult D. Coxiella burnetii (Q Fever). In: Mandell GL, Bennett JE, Dolin R, editors. Principles and practice of infectious diseases. 17th edition. Philadelphia: Churchill Livingstone; 2010. p. 2511–9.
[7] Ayres JG, Flint N, Smith EG, Tunnicliffe WS, Fletcher TJ, Hammond K, et al. Post-infection fatigue syndrome following Q fever. QJM 1998; 91 105–23.
| Post-infection fatigue syndrome following Q fever.Crossref | GoogleScholarGoogle Scholar | 1:STN:280:DyaK1c3ktVSnsw%3D%3D&md5=09e57c0a811df1b704c531ededbe652aCAS |
[8] Karagiannis I, Morroy G, Rietveld A, Horrevorts AM, Hamans M, Francken P, et al. Q fever outbreak in the Netherlands: a preliminary report. Euro Surveill 2007; 12 E070809 2.
[9] Schimmer B, Dijkstra F, Vellema P, Schneeberger PM, Hackert V, ter Schegget R, et al. Sustained intensive transmission of Q fever in the south of the Netherlands, 2009. Euro Surveill 2009; 14 19210.
[10] Delsing CE, Kullberg BJ. Q fever in the Netherlands: a concise overview and implications of the largest ongoing outbreak. Neth J Med 2008; 66 365–7.
| 1:STN:280:DC%2BD1cnnt12jtA%3D%3D&md5=c3c264e80d1fb6d0753b31f1f5f37c12CAS |
[11] Gilroy N, Formica N, Beers M, Egan A, Conaty S, Marmion B. Abattoir-associated Q fever: a Q fever outbreak during a Q fever vaccination program. Aust N Z J Public Health 2001; 25 362–7.
| Abattoir-associated Q fever: a Q fever outbreak during a Q fever vaccination program.Crossref | GoogleScholarGoogle Scholar | 1:STN:280:DC%2BD3MvoslGhtg%3D%3D&md5=693ba8b6478b8497aa2d3ee2fae1dae0CAS |
[12] Q fever outbreak in an abattoir in Cooma, NSW. Commun Dis Intell 1998; 22(10): 222.
[13] Communicable Diseases Report, New South Wales, for September and October 2004. N S W Public Health Bull 2004; 15(11–12): 220–7.
[14] Gidding HF, Wallace C, Lawrence GL, McIntyre PB. Australia's national Q fever vaccination program. Vaccine 2009; 27 2037–41.
| Australia's national Q fever vaccination program.Crossref | GoogleScholarGoogle Scholar |
[15] Health NSW. Q fever response protocol for NSW Public Health Units. Sydney 2004.
[16] Health NSW. New South Wales Notifiable Conditions Information Management System. 4.0.5.9 ed. Sydney: NSW Health; 2011.
[17] Chiu C, Dey A, Wang H, Menzies R, Deeks S, Mahajan D, et al. Vaccine preventable diseases in Australia, 2005 to 2007. Commun Dis Intell 2010; 34 S1–167.
[18] Massey PD, Irwin M, Durrheim DN. Enhanced Q fever risk exposure surveillance may permit better informed vaccination policy. Commun Dis Intell 2009; 33 41–5.
[19] Bureau of Meteorology. Average annual, seasonal and monthly rainfall. Melbourne: Australian Government Bureau of Meteorology; 2010 [26 July 2011]. Available at: http://www.bom.gov.au/jsp/ncc/climate_averages/rainfall/index.jsp (Cited 6 July 2011).