

Predicting spatio-temporal distribution for eastern Australian birds using Birds Australia’s Atlas data: survey method, habitat and seasonal effects
Judit K. Szabo A C D , Pam J. Davy B , Michael J. Hooper A and Lee B. Astheimer CA The Institute of Environmental & Human Health, Texas Tech University, Lubbock, 79409 Texas, USA.
B Department of Mathematics & Applied Statistics, University of Wollongong, Wollongong, NSW 2522, Australia.
C Institute for Conservation Biology & Law, University of Wollongong, Wollongong, NSW 2522, Australia.
D Corresponding author. Present address: The Ecology Centre, School of Integrative Biology, University of Queensland, St Lucia, Qld, 4072, Australia. Email: j.szabo@uq.edu.au
Emu 107(2) 89-99 https://doi.org/10.1071/MU06020
Submitted: 12 May 2006 Accepted: 5 April 2007 Published: 13 June 2007
Abstract
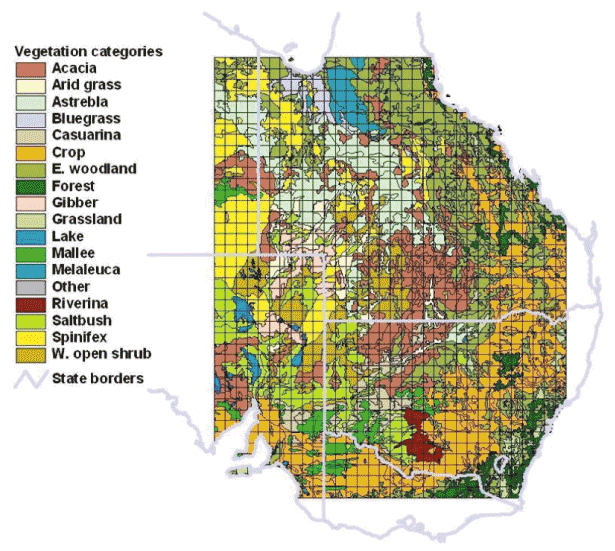
Faunal atlases are landscape-level survey collections that can be used for describing spatial and temporal patterns of distribution and densities. They can also serve as a basis for quantitative analysis of factors that may influence the distributions of species. We used a subset of Birds Australia’s Atlas of Australian Birds data (January 1998 to December 2002) to examine the spatio-temporal distribution patterns of 280 selected species in eastern Australia (17–37°S and 136–152°E). Using geographical information systems, this dataset was converted into point coverage and overlaid with a vegetation polygon layer and a half-degree grid. The exploratory data analysis involved calculating species-specific reporting rates spatially, per grid and per vegetation unit, and also temporally, by month and year. We found high spatio-temporal variability in the sampling effort. Using generalised linear models on unaggregated point data, the influences of four factors – survey method and month, geographical location and habitat type – were analysed for each species. When counts of point data were attributed to grid-cells, the total number of species correlated with the total number of surveys, while the number of records per species was highly variable. Surveys had high interannual location fidelity. The predictive values of each of the four factors were species-dependent. Location and habitat were correlated and highly predictive for species with restricted distribution and strong habitat preference. Month was only of importance for migratory species. The proportion of incidental sightings was important for extremely common or extremely rare species. In conclusion, behaviour of species differed sufficiently to require building a customized model for each species to predict distribution. Simple models were effective for habitat specialists with restricted ranges, but for generalists with wide distributions even complex models gave poor predictions.
Acknowledgements
We thank Birds Australia for providing bird distribution data, Ted Deveson for supplying spatial data and help in GIS, and Eugenio Fedriani Martel for statistical advice. The comments of two anonymous referees on earlier drafts were also appreciated.
Brooker, L. , and Brooker, M. (2003). Local distribution, metapopulation viability and conservation of the Blue-breasted Fairy-wren in fragmented habitat in the Western Australian wheatbelt. Emu 103, 185–198.
| Crossref | GoogleScholarGoogle Scholar |
Griffioen, P. A. , and Clark, M. F. (2002). Large-scale bird-movement patterns evident in eastern Australian atlas data. Emu 102, 97–123.
| Crossref | GoogleScholarGoogle Scholar |
Loman, S. , and von Schantz, T. (1991). Birds in a farmland – more species in small than in large habitat island. Conservation Biology 5, 176–188.
| Crossref | GoogleScholarGoogle Scholar |
Osborne, P. E. , and Tigar, B. J. (1992). Interpreting bird atlas data using logistic models: an example from Lesotho, southern Africa. Journal of Applied Ecology 29, 55–62.
| Crossref | GoogleScholarGoogle Scholar |
Robertson, A. , Simmons, R. E. , Jarvis, A. M. , and Brown, C. J. (1995). Can bird atlas data be used to estimate population size? A case study using Namibian endemics. Biological Conservation 71, 87–95.
| Crossref | GoogleScholarGoogle Scholar |
Storch, D. , and Kotecky, V. (1999). Structure of bird communities in the Czech Republic: the effect of area, census technique and habitat type. Folia Zoologica 48, 265–277.
|