

Can changes to pasture management reduce runoff and sediment loss to the Great Barrier Reef? The results of a 10-year study in the Burdekin catchment, Australia
Rebecca Bartley A E , Jeff P. Corfield B , Aaron A. Hawdon C , Anne E. Kinsey-Henderson C , Brett N. Abbott C , Scott N. Wilkinson D and Rex J. Keen CA CSIRO, Brisbane, Qld 4068, Australia.
B Corfield Consultants, Wulgura, Qld 4811, Australia.
C CSIRO, Townsville, Qld 4814, Australia.
D CSIRO, Acton, ACT 2601, Australia.
E Corresponding author. Email: rebecca.bartley@csiro.au
The Rangeland Journal 36(1) 67-84 https://doi.org/10.1071/RJ13013
Submitted: 22 February 2013 Accepted: 15 November 2013 Published: 2 January 2014
Abstract
Excess sediments from agricultural areas are having a detrimental impact on the Great Barrier Reef, and threaten the long-term viability of rangeland grazing. Changes to grazing management have been promoted as a mechanism for reducing excess sediment loss from grazed rangelands. This paper summarises the results of a 10-year study (2002–11) on a property in the Burdekin catchment that investigated the role of reduced stocking rates and rotational wet season resting on hill-slope and catchment runoff and sediment yields. Ground cover and pasture biomass were evaluated using on-ground surveys and remote sensing. During this study, average ground cover increased from ~35 to ~80% but pasture biomass was low due to the dominance of Bothriochloa pertusa (77% of composition). The percentage of deep-rooted perennial species increased from ~7% of pasture composition in 2002 to ~15% in 2011. This is still considerably lower than the percentage that occupied this property in 1979 (~78%). The increased ground cover resulted in progressively lower hill-slope runoff coefficients for the first event in each wet season, but annual catchment runoff did not respond significantly to the increasing ground cover during the study. Hill-slope and catchment sediment concentrations did decline with the increased ground cover, yet catchment sediment yields increased proportionally to annual runoff due to the contribution of sub-surface (scald, gully and bank) erosion. This study has demonstrated that changes to grazing management can reduce sediment concentrations leaving B. pertusa-dominated pastures, as B. pertusa is an effective controller of surface erosion. To further reduce the runoff that is fuelling gully and bank erosion, the proportion of deep-rooted native perennial grasses needs to be increased. It is argued that more than 10 years will be required to restore healthy eco-hydrological function to these previously degraded and low productivity rangelands. Even longer timescales will be needed to meet current targets for water quality.
Additional keywords: eco-hydrology, erosion, grazing, Great Barrier Reef, land management, vegetation.
Introduction
There is increasing evidence demonstrating that excess sediments and associated nutrients from agricultural areas are having a detrimental impact on the Great Barrier Reef (De’ath et al. 2012). Much of the damage to the Great Barrier Reef occurred between 1920 and 1955 following the expansion of agriculture in the catchments draining to the Great Barrier Reef (Roff et al. 2013). Sediments being exported from the land are now at least five times greater than before pre-European settlement (McCulloch et al. 2003; Kroon et al. 2012). In response to this issue, the Australian Government allocated $200 million in 2008, via the Reef Rescue package, to help land owners and managers implement ‘improved land management practices’ (Brodie and Waterhouse 2012). This investment was based on the assumption that paddock and end-of-catchment pollutant loads will decline with the implementation of such practices. There is, however, very little quantitative evidence anywhere in the world demonstrating that catchment-wide soil and water conservation programs effectively reduce sediment fluxes to marine zones (Walling 2006).
Livestock grazing is the dominant land use (~80%) in the semiarid and tropical rangelands draining to the Great Barrier Reef (Great Barrier Reef Marine Park Authority 2012). One of the primary factors that graziers can control, without major infrastructure investment, is rangeland condition, i.e. ground cover and biomass at the end of the dry season. Increasing the ground cover in grazing lands has been shown to improve rangeland condition (Landsberg et al. 1998; Ash et al. 2011), increase property-scale economic returns (MacLeod et al. 2009) and provide resilience in a variable climate (O’Reagain et al. 2011). The two most widely recommended tools for improving rangeland condition in the catchments draining to the Great Barrier Reef are (i) reducing stocking rates to achieve appropriate levels of pasture utilisation and (ii) wet season resting (WSR) (O’Reagain et al. 2011).
Several studies have evaluated the effect of changing the amount and type of vegetation on runoff at the plot (Eldridge and Rothon 1992; McIvor et al. 1995; Scanlan et al. 1996b) and catchment scales (Prebble and Stirk 1988; Siriwardena et al. 2006; Thornton et al. 2007; Peña-Arancibia et al. 2012), and modelling suggests that increasing the ground cover will improve the water quality in rangeland environments (Kinsey-Henderson et al. 2005). There have, however, been very few studies that have evaluated the effectiveness of increasing or enhancing the amount of vegetation cover on catchment runoff (Wilcox et al. 2008), and even fewer studies have quantified the effect of ‘improved pasture condition’ on reducing catchment sediment yields in rangeland environments. Given the significant investment of the Australian Government aimed at reducing runoff and increasing water quality from rangelands by increasing ground cover, it is critical that we increase our understanding of the effectiveness of such actions on runoff and sediment yields at the property level over long (decadal) time-frames.
This paper presents the results of a 10-year field study conducted in the Weany Creek catchment on Virginia Park Station, in the Burdekin catchment, Australia. The Burdekin catchment is the largest contributor of anthropogenic-derived fine sediment to the Great Barrier Reef lagoon (Kroon et al. 2012) and the mouth of the river is located near several economically and globally significant marine areas (Bartley et al. 2014). The Weany Creek site was identified as an erosion ‘hotspot’ with respect to impact on the Great Barrier Reef (Prosser et al. 2001), and a research site was established in 1999. Research at this site included the assessment of carbon and water fluxes (Leuning et al. 2005), the effects of scale on sediment delivery from hill-slopes (Bartley et al. 2006; Ludwig et al. 2007) and the quantification of the erosion sources using modelling, monitoring and radionuclide tracing (Kinsey-Henderson et al. 2005; Bartley et al. 2007; Wilkinson et al. 2013).
In parallel with these research projects, a study was initiated in 2002 to determine if ‘improved grazing land management’ would result in reduced runoff and improved water quality. The grazing management strategy involved (i) matching cattle numbers with forage biomass in order to achieve the recommended levels of pasture cover and biomass, and (ii) WSR. For the next 10 years, pasture condition (represented via species composition, ground cover and biomass), runoff and sediment yields were measured at hill-slope and catchment scales. These data were collected from this field site while it was operating as a commercial grazing property. The initial 6 years of post-treatment monitoring results (2002–07) were presented in Bartley et al. (2010a) for the hill-slope data, and in Bartley et al. (2010b) for the catchment-scale runoff and sediment yield responses. There were several very wet (above-average rainfall) years in the final 4 years of the study (2008–11). This has shed new light on the role of pasture in controlling runoff and erosion in these grazed rangelands. This paper presents the total decade of monitoring results for this site, and discusses the implications of these findings for grazing management and off-site water quality.
Field site
Geology and soils
Weany Creek is a ~14-km2 headwater catchment within Virginia Park, a commercial grazing station ~100 km west of Townsville in the Burdekin catchment (19°53′06.79″S, 146°32′06.65″E; Fig. 1). The channel has a mean bed slope of ~0.5%, and gently sloping valley sides averaging ~4%. Weany Creek is part of the Dalrymple land system and representative of the highly dissected granodiorite ‘Gold-fields’ land type (Rogers et al. 1999). The soils are generally infertile Red Chromosols and Yellow to Brown texture contrast soils. Soils are generally well drained, slowly to moderately permeable with hard setting surfaces (Harms and Main 2006). Numerous scalds with low ground cover are found along riparian areas on the unstable duplex soils. The scalds are strongly sodic with exchangeable sodic percentage values of >60% (N. Enderlin, unpubl. data, Queensland Government).

|
Land-use history
The dominant land use in the catchment has been grazing, which has occurred for more than 100 years. There has been gold mining in the upper parts of Weany Creek but the mines were small and disconnected from the channel. Erosion in the Goldfields region around Weany Creek was particularly severe in the first half of the 20th century with 12.5% or 6900 km2 of this area considered to be impacted by soil erosion (Burdekin Project Committee 1976; p. 648). Another period of accelerated degradation occurred in the Burdekin catchment in the mid 1980s, which was largely considered to be due to the adoption of more hardy tropical cattle breeds, use of feed supplements and accelerated market fluctuations, combined with several years of well below-average rainfall (Gardener et al. 1990; McKeon et al. 2004). Following the drought of the 1980s, six out of eight land types surveyed in the Dalrymple Shire were found to have >30% of sites with sheet and scald erosion (DeCorte et al. 1994). Approximately 10% of Weany Creek was considered to have severe scald erosion at the initiation of this study (Bartley et al. 2010b).
Vegetation
The current vegetation on Weany Creek is Eucalypt savanna woodland overlaying a layer of C4 grasses. The trees are a mixture of ironbark/bloodwood communities (e.g. narrow-leafed ironbark, Eucalyptus crebra, and red bloodwood, Corymbia erythrophloia) and shrubby species (e.g. currant bush, Carissa ovate, and false sandalwood, Eremophila mitchellii). Previous heavy grazing (~0.25 animal equivalent per hectare, Table 1), combined with drought, had led to a decline in the native tussock grasses at this site (e.g. Bothriochloa ewartiana, Heteropogon contortus and Chrysopogon fallax) and the domination of the exotic, but naturalised stoloniferous grass Indian couch (Bothriochloa pertusa) mixed with native tussock grasses. Between 1979 and 1988, heavy grazing on Virginia Park changed the pasture composition from one dominated by tall perennial grasses (78%) and legumes (20%) to one dominated by B. pertusa (56%), annual grasses and non-legume dicots (26%) and legumes (13%). By 1988, perennial grasses represented ~5% of the pasture composition at this site (Gardener et al. 1990).

|
Hydrology
Weany Creek is ephemeral and generally only flows between December and April each year. Occasionally, out-of-season events occur and, therefore, runoff data extend from 1 July to 30 June each year. The 10-year mean annual rainfall for the site was 658 mm (s.d. of mean, 317 mm). This is slightly higher than the long-term average rainfall of ~604 mm for the nearby Fanning River rain gauge (1901–2011; www.longpaddock.qld.gov.au/silo/). During the 10-year study period, the highest rainfall at Weany Creek was 1224 mm in the 2008–09 wet season, and the lowest rainfall was 303 mm in 2002–03. Water balance studies at this site showed that annual evapo-transpiration exceeds annual rainfall for most of the year, confirming that tree roots are accessing soil water (Leuning et al. 2005). The summer-dominant rainfall pattern results in a rapid recharge-discharge of the water in the top 1.2 m of the soil (Leuning et al. 2005), meaning that, where soils are shallow, there is little storage of water in the soil profile throughout the year.
Methods
Grazing management strategy
At the commencement of this study, the concept of grazing condition classes had been established (Chilcott et al. 2003), and the terms, A, B, C and D condition, were being used to represent country in ‘good’ (class A) and ‘poor’ condition (class D) (see Table 2). These classes were based on the principles of the State I-IV transition model (Ash et al. 2001), knowledge of pasture and erosion relationships (McIvor et al. 1995) and stocking rates for optimal animal production (Gardener et al. 1990). The broad aim of the grazing management strategy was to shift the catchment from a landscape in a predominantly C condition class to a landscape in a B condition class (or higher), and evaluate the response in runoff and sediment loss at hill-slope and catchment scales. Although the terms, A, B, C and D classes, are used within the grazing management industry, this study used quantitative metrics to describe the pasture condition (e.g. % cover and biomass) as condition classes can vary between landscapes and regions.

|
As described in Bartley et al. (2010a), there are several ways to rehabilitate or prompt recovery in rangeland vegetation including: (i) reducing livestock density, (ii) adopting seasonal pasture resting, (iii) using prescribed burning, (iv) sowing introduced plant species and (v) reseeding with native plant species. The aim was to evaluate land management options that were economic and sustainable for all graziers in the long term. The two grazing management practices implemented in this study were: (1) a reduced stocking rate (see Table 2); and (2) rotational WSR. The relatively small size of the property meant that resting occurred (roughly) every second year (Table 1). A map of the Virginia Park property and the location of the four paddocks are shown in Fig. 1. The period of WSR ranged from 6 weeks to 6 months depending on pasture and climatic conditions, and the length of resting decreased as rainfall conditions increased. A full description of the grazing management carried out in each paddock is given in Bartley et al. (2010a, 2010b). Annual stocking rates were averaged over the three study paddocks (Bottom Aires, Top Aires and Blackfellas) and were adjusted for the number of days that the paddocks were stocked.
Data collected at the hill-slope scale
Site selection
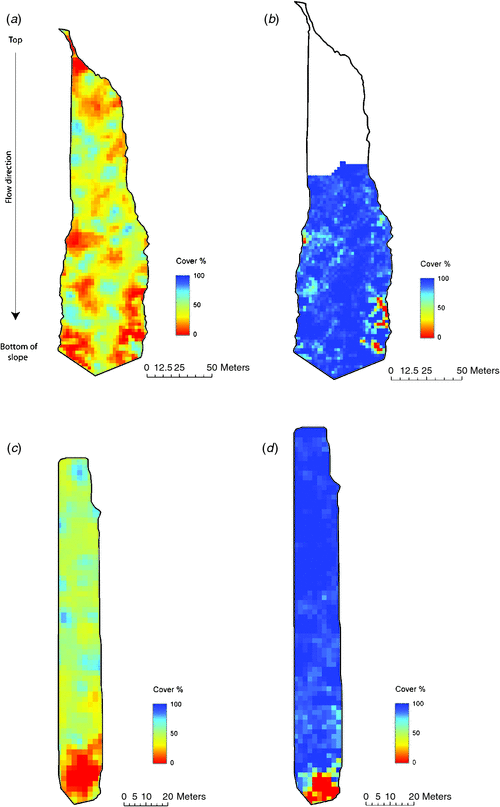
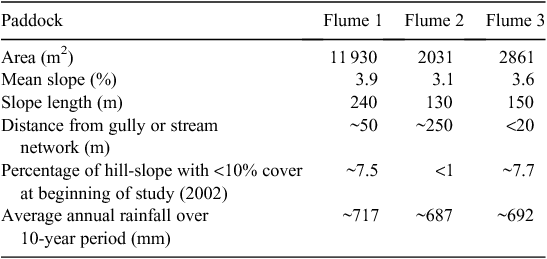
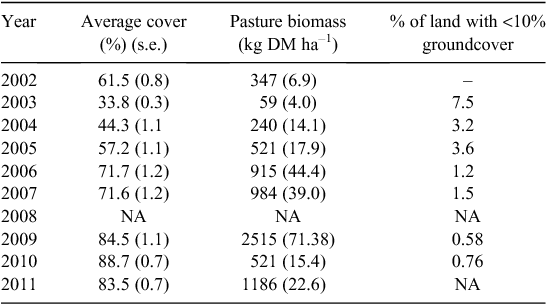
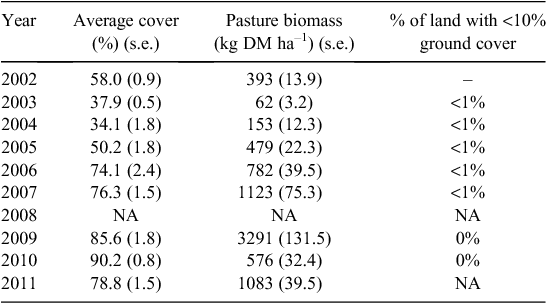
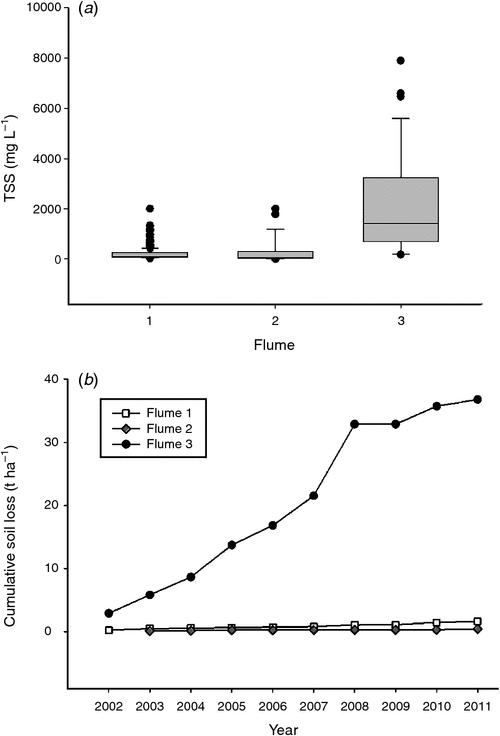
To estimate the impact of ‘improved pasture management’ on species composition, ground cover and biomass, land condition and subsequent water and sediment loss at the hill-slope scale, three hydrological flume hill-slope sites were established in 2002. The flumes were located within 400 m of each other in the Bottom Aires paddock (Fig. 1), and were open to grazing by livestock according to the WSR regime outlined in Table 1. As rangeland systems have characteristically patchy ground cover patterns (Ludwig et al. 2005), the three flume sites were chosen to represent different patterns of ground cover. Approximately 7.5% of the hill-slope above Flume 1 had <10% cover in 2002 but the bare areas were located on the side of the flume hill-slope and were not in the main flow path (Fig. 2a). Flume 2 was located further upslope (Fig. 2) and had a pattern of even ground cover with no major bare areas. Flume 3 was located at the bottom of a hill-slope and partially connected to a small gully at the beginning of the study. It had ~7.7% of its surface represented by areas with <10% ground cover in 2002. The areas of low ground cover on Flume 3 were all located at the bottom of the hill-slope directly in the main flow path (Fig. 2c). The hill-slopes are described in more detail in Bartley et al. (2010a, 2006). Characteristics of each flume site, as well as the 10-year average rainfall data, are given in Table 3. The 10-year average rainfall at the flumes sites was similar to the long-term average but the first half of the period of the study had generally below-average rainfall, and the second half of the study was much wetter than average. No research funding was available for the wet season in 2008 and, therefore, only minimal data for this year are available. A wet season is defined as the period of dominant rainfall between 1 July and 30 June, with November to April being the period when most rainfall occurs. The wet season is named according to the year the wet season began (e.g. the wet season in 2008 represents 1 July 2008 until 30 June 2009).
|
|
Ground cover and biomass
Hill-slope ground cover was measured at each flume site using surveys at the end of the dry season (October–November) across each hill-slope on an 8 × 4-m fixed grid. For each grid point, pasture metrics were recorded using a 1-m2 quadrat based on the methods of Tothill et al. (1992). Pasture metrics included the main pasture species and/or functional group composition and frequency, aboveground pasture biomass, cover of litter, basal-area class, defoliation level and key and soil surface condition metrics (see Tongway and Hindley 1995). Information on vegetation and land type, landscape location and tree canopy cover was also recorded within a 10-m radius of each sampling point. Each location was GPS referenced to provide insights into spatial response pattern. The ground cover measurements were summarised as total projected ground cover and represented the % of cover that would be seen from above (whether at ground level or from remote sensing). The total % ground cover at each site includes plant material plus litter, i.e. both herbaceous biomass and dead vegetation and animal dung. The proportion of decreaser, native, perennial grasses was also recorded at each flume site except in the years of very low cover (2003 and 2004) when these measurements were too difficult to make due to the extremely low pasture biomass (<100 kg DM ha–1). Decreaser grasses decrease under sustained heavy grazing e.g. when animal numbers exceed carrying capacity for a sustained period of time (Ash et al. 2011). Vegetation/land type, landscape location and tree canopy cover was also recorded within a 10-m radius of each grid point. In addition to on-ground field measurements of cover, Quickbird satellite images (SPOT 5 panchromatic with a resolution of 2.4 m2) were analysed using the PD54 index of Pickup et al. (1993) (linearly rescaled between 0 and 100), to estimate the areas of each hill-slope flume site with <10% ground cover (Source: Digital Globe, Inc., Colorado, USA). This was done for 7 out of the 10 years of the study. For 3 years (2002, 2008 and 2011) there were either no cloud-free days or resource constraints limited data collection.
Hill-slope scale runoff and erosion
Virginia Park hill-slopes
To measure water and sediment runoff, a large Parshall flume was used for Flume 1, and 23-cm cut-throat flumes were used for Flumes 2 and 3. Different flume set-ups were used to accommodate different hill-slope areas and thus runoff volumes. The variations in the set-up of the flumes are not considered to have influenced the quality of the data collected. Details describing the flume instrumentation can be found in Bartley et al. (2006). Samples of total suspended sediment (TSS) were collected using stratified sampling according to depth at Flume 1, and using bulk drum sampling for Flumes 2 and 3. The total number (and annual range) of sediment samples collected at the flumes over the 10-year study was 286 samples (range 3–43 per year) at Flume 1, 32 samples (range 2–6 per year) at Flume 2, and 38 samples (range 2–5 per year) from Flume 3. TSS concentrations were considered to represent the silt (0.002–0.063 mm) and clay (<0.002 mm) fractions. Bed-load samples (representing sediment between 0.063 and 8 mm) were collected downslope from each flume. Sediment loads were calculated by summing the event loads using the arithmetic mean approach (Letcher et al. 1999). At Flume 1, the median TSS values for the whole season were used when no samples were collected. In previous publications (Bartley et al. 2006, 2010a), the mean TSS value was applied but with 10 years of data it was possible to identify some of these values as outliers and, therefore, the median value was considered more appropriate. At Flumes 2 and 3, the median concentration of the sample collected in the drum was applied to all previous events leading up to the collection date. At Flume 3, there were 3 years with very high TSS concentration values that were well above the 90th percentile confidence limits for the 10-year dataset (see Fig. 5a). These values generally occurred at the beginning of large runoff events when the bulk sampler filled up rapidly, only collecting the first flush sediment with a high TSS concentration (described in Bartley et al. 2006). These outlier values were replaced with a mean TSS concentration value from that event as well as the events before and after that occurrence. This reduced the bias in the final load estimates. There was sensor malfunction at Flume 2 in 2002–03 and 2008–09 and at Flume 3 in 2009–10 and no data are presented for these years.
Flume 3 bunding
There was some vegetation recovery on the scald site on Flume 3 in the early years of the study but this recovery was very slow compared with the scald sites on Flume 1 (Bartley et al. 2010a). It was uncertain if the slow recovery was due to the continued runoff from upslope or whether there were other soil constraints (e.g. sodicity) that were inhibiting recovery. To test whether the continued runoff was restricting recovery, a sheet metal bunding wall was installed around the scald area on Flume 3 in January 2012. The bunding was ~300 mm high and covered an area of ~550 m2, representing ~20% of the Flume 3 runoff area. It was anticipated that the bunding would divert upslope runoff away from the scald area and accelerate the colonisation of pasture to stabilise this site. The diverted water was no longer captured within the flume during events.
Meadowvale exclosure data for comparison
Sediment concentrations measured at the Virginia Park flumes were compared with TSS samples collected from reinstated Queensland Government exclosure runoff troughs at the nearby Meadowvale cattle station (S19°50′30.67′, E146°35′19.81′) (Scanlan et al. 1996a, 1996b). The Meadowvale troughs are located on the same geology (granodiorites), soil type (Chromosols) and slopes (~4%) as the Virginia Park flumes. The difference is that the Meadowvale exclosure site has had light or no cattle grazing for ~20 years (Alewijnse 2003; Hawdon et al. 2008). Bulk TSS samples from a total of 20 events were collected from the Meadowvale troughs between 2001 and 2006, and were used for comparison with the Virginia Park samples. The water quality samples from Virginia Park and Meadowvale were analysed at the same laboratory.
Catchment-scale data
Catchment ground cover
It was not practical to physically measure ground cover for the entire Weany Creek catchment (~1347 ha) and, therefore, Quickbird satellite images (with a resolution of 2.4 m2) were used to estimate ground cover of the catchment. To evaluate the effect of the grazing management against the background rainfall variability, Quickbird imagery was also collected and analysed for an unnamed property adjacent to the Weany Creek catchment that has similar biophysical characteristics. The ‘control’ property is a similar size to Weany Creek (~1250 ha) but, to our knowledge, did not undergo changes to grazing management between 2002 and 2011. Both properties were analysed for average ground cover in 2003, 2005, 2006 and 2007, 2009 and 2010. As with the flume sites, the entire Weany Creek catchment was also analysed for areas with <10% ground cover.
Catchment runoff and sediment yields
An automatic gauging station that measured catchment runoff and sediment concentration was installed at the outlet of Weany Creek in 1999 (Fig. 1). This instrumentation was used to monitor the runoff and sediment flux for 2 years before the grazing management changes (2000–01) and for 10 years during the study. The gauging station recorded rainfall, stage height, flow velocity, turbidity and water temperature at 1-min intervals during events, noting that Weany Creek is ephemeral and flows for ~5% of the year during low-rainfall years. In above-average rainfall years, the creek may flow for more than 6 months of the year. Details of the monitoring equipment and water sampling design of the gauging site are given in Bartley et al. (2007, 2010b) and Hawdon et al. (2009). To estimate sediment concentration, a 1-L water sample was collected at programmed intervals across the hydrograph. A linear relationship between TSS and turbidity was developed using data from 2000 to 2006 and applied to the 2000–06 period. A new turbidity sensor was installed in 2007 and a revised relationship was applied from 2007 to 2011. These relationships were then used to calculate the annual suspended sediment load for each water year (1 July–30 June). Bed-load was not sampled at the catchment outlet. Event mean concentration (EMC) values for TSS concentrations were calculated for each year using the method described in Bartley et al. (2010b). Average catchment rainfall, which is the average of rainfall recorded at the stream gauge and Flume 1, is reported with the catchment runoff results. Non-linear regression (using Sigmaplot version 12.0) was used to evaluate the significance of the relationship between average catchment ground cover and the EMC value derived from annual sediment yield and runoff data at the gauge site.
Results
Hill-slope scale (flumes)
Ground cover and pasture biomass
Tables 4, 5 and 6 present the ground cover, biomass and the area of low (<10%) cover at the end of the dry season for Flumes 1, 2 and 3, respectively. The changes in the amount and spatial distribution of cover between 2003 and 2010 for Flumes 1 and 3 are shown in Fig. 2. The lowest annual rainfall at the flume sites (<250 mm) corresponded with the lowest ground cover in the 2003 wet season. Ground cover in 2003 was between 34 and 45% at the three hill-slope sites, and pasture biomass was ~60 kg DM ha–1. Following increased rainfall and a further 8 years of conservative stocking, ground cover in 2011 was ~80% on all hill-slopes and pasture biomass was >1100 kg DM ha–1. Pasture biomass peaked in 2009 at >2500 kg DM ha–1 across all flume sites but there was a large (district-wide) collapse in the biomass of B. pertusa in 2010, due to unknown causes, and this resulted in a lower pasture biomass for both 2010 and 2011. The area with <10% cover declined on all three hill-slopes over the 10 years.
|
|
|
The change in ground cover over the 10-year study was not evenly distributed across the hill-slopes, and the upper slope ironbark- and bloodwood-dominated areas had more rapid recovery of ground cover than the sandalwood sodic soil areas found on the lower slopes (Fig. 3a). The ground cover on the lower slope sodic areas of Flume 3 increased from ~20% in 2005 to 52% in 2011. There was also evidence of earthworm and termite activity at this site indicating increases in the abundance of soil fauna in response to increased litter and soil moisture content in the dry season. The proportion of decreaser, native, perennial grasses contributing to the total pasture biomass also increased during the study, with the percentage of these grasses representing ~15, 20 and 25% of the total pasture biomass at Flume 1, 2 and 3, respectively in 2011 (Fig. 3b). This was a considerable increase from the value of 7% found across all flume sites in 2002, although in absolute DM terms, the contribution of these grasses remains low at <500 kg DM ha–1, and even lower away from tree canopies.

|
Hill-slope scale runoff and erosion
The mean ground cover was very similar across each of the three hill-slope flume sites during the 10-year study period as was the distribution of rainfall (Fig. 4a and b). The annual amount of runoff at each site generally followed the rainfall pattern but the annual % runoff over the study period varied considerably between the flumes (Fig. 4b). The ground cover and pasture biomass did influence the amount of runoff at the beginning of the wet season (see plots in Bartley et al. 2010a) but the total annual % runoff increased slightly at Flumes 1 and 2 over the study period, despite the increase in ground cover (Fig. 4). The annual % runoff generally increased in years with higher rainfall. There was a strong exponential relationship between the average ground cover at Flume 1 and the amount of rainfall required to initiate runoff each season over the 10-year period (Fig. 5a). This was calculated as the amount of rainfall that fell on the hill-slope (since 1 July of the runoff year) before runoff was initiated at the flume sensor. The same relationships did not hold for Flumes 2 and 3 (data not shown). Rainfall intensity data for 2002–07 (I15 and I30 values) were presented in Bartley et al. (2010a) and were not shown to significantly affect the proportion of rainfall that turns into runoff for individual events on Flume 1. This suggests that the increased cover, and not just increased rainfall intensity, was responsible for the reductions in early wet season runoff.

|
|
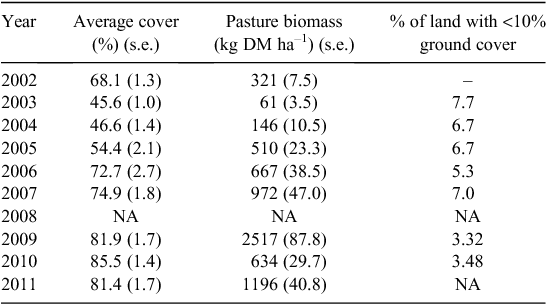
Flume 3 had very high annual % runoff values (up to 58%), which increased up until 2008, after which the values fell to <15%. The reduction in annual % runoff in 2012 is likely to be due to the installation of the bunding wall around the scald area at the bottom of Flume 3 but it also reflects the change in ground cover in this area, which was ~52% for the lower scalded area and 84% for the Flume 3 hill-slope site (Fig. 6). The increase in ground cover on Flume 3 also had a dramatic impact on the proportion of coarse sediment fractions (>63 µm) leaving the hill-slope. The % contribution of coarse sediment at Flume 3 was as high as 38% in 2004, and in 2011 it was <1%. Coarse sediment (>63 µm) represented <1% of total load on Flumes 1 and 2 in all monitoring years.
|
Although the ground cover was similar between the flume sites, the amount, distribution and persistence of areas with <10% cover varied, and this was associated with changes in the amount of soil erosion. The TSS concentrations changed most dramatically on Flume 1, the largest of the three hill-slopes (Fig. 4g). When an ANOVA (on ranks) was used to compare the TSS concentrations from Flume 1 to those collected at the low-impact neighbouring Meadowvale site), it was found that TSS concentrations from Flume 1 in 2005 (and all previous years) were significantly higher (P = 0.005) than those on the Meadowvale site. The ground cover on Flume 1 in 2005 was 57%. The ground cover on Flume 1 then increased to 72% in 2006. In 2006, there was no significant difference (P = 0.819) in the TSS concentrations measured on Flume 1, when compared with those on the Meadowvale site. This suggests that there is a threshold change in TSS concentration when ground cover increases above 70%. The TSS concentrations did increase slightly on Flume 1 in the later years of the study but this is considered to be related to the higher runoff in later years. There is a similar pattern in TSS concentration for Flume 2, where TSS concentrations declined, and stay low, once ground cover was >70%. The TSS concentrations at Flume 3 did not show a systematic change over the 10-year period and, in all years, the concentrations were significantly higher than on the Meadowvale site (Fig. 4m).
The data on sediment loads, presented in Fig. 4k, l and m, were obtained by multiplication of the TSS concentration by the amount of runoff, and are generally biased by years of high rainfall and runoff. As a result, the annual sediment loads did not decline over the 10-year period at any of the flume sites. Flume 1 experienced a decline in sediment load with increasing ground cover until 2007 (Bartley et al. 2010a) after which time several years of above-average rainfall occurred, which changed this pattern. Flume 3 showed a large reduction in sediment yield between 2008 and 2011. Some of this reduction could have been directly related to the bunding wall installed in January 2012, as 90% of the runoff for the 2011–12 wet season occurred after the bunding was installed, but there was also a large increase in ground cover at the scald site at the base of Flume 3 (Fig. 6). The total sediment loads at Flume 3 remained, on average, 25 times higher than at Flume 1, and ~70 times higher than at Flume 2. Given that the runoff volumes were not that different between Flumes 1 and 3 during most of the study, this result can be explained by the high TSS concentrations measured at Flume 3 (Fig. 6b). The elevated TSS concentrations and high % runoff measured at Flume 3 resulted in an annual average total sediment loss (fine + coarse) of 0.27 mm year–1 (or ~4 t ha–1 year–1) across the whole hill-slope (Fig. 5c). This is much higher than the annual average total soil loss rates measured at Flume 1 of 0.011 mm year–1 (or 0.16 t ha–1 year–1) and at Flume 2 of 0.004 mm year–1 (or 0.06 t ha–1 year–1), respectively. Interestingly, the cumulative soil loss for Flume 3 (Fig. 5c) shows a change ~2009 when values of ground cover were >80% and pasture biomass >2000 kg DM ha–1 (Fig. 6).
Catchment scale
Ground cover
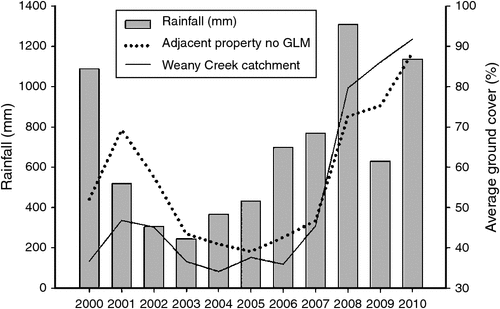
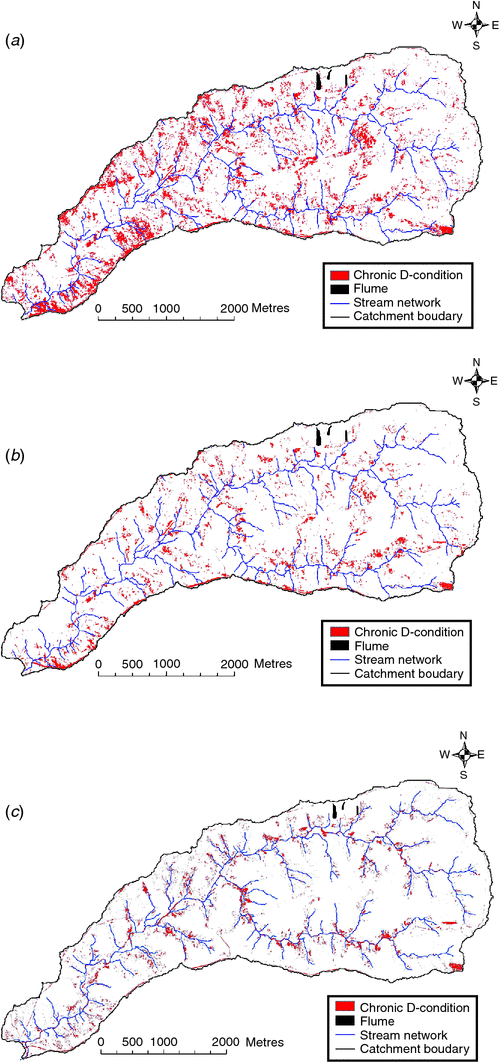
Ground cover for the entire Weany Creek catchment followed a similar pattern to the flume hill-slopes. The average ground cover of the catchment in 2002, when the new grazing regimes were implemented, was 45%. After 10 years the average ground cover was 92% across the catchment, an increase of 104%. The increase in ground cover at an adjacent property that did not undergo changes in grazing management was much lower at only 65% over the same period (Fig. 7). The increase or change in ground cover was not evenly distributed across the Weany Creek catchment. The upslope areas recovered first and were followed by the mid-slope areas (Fig. 8). The remaining areas of low (<10%) ground cover were on the lower slopes and areas adjacent to the drainage lines (Fig. 8). The areas of low ground cover that remained in 2011 largely represented the severely scalded and gullied sites such as the lower section of Flume 3. Ground cover alone is a poor predictor of land condition and biomass production, and it is likely that there have been additional improvements to land condition in the Weany Creek catchment compared with adjacent properties. Unfortunately, we are currently unable to measure these attributes using remote sensing.
|
|
Catchment-scale runoff and sediment yields
Initiation of the new grazing management regime in the Weany Creek catchment in 2002 coincided with the beginning of a run of 4 years of below-average rainfall (Fig. 9a). The second year of the study (2003) had a ground cover of 37% and the lowest catchment runoff (Table 7). This year also had the highest average annual TSS concentration in the 10-year record (Fig. 9b), but, because of the low runoff, the year 2003 had the lowest sediment loads of the study (Fig. 9c). There was a steady increase in rainfall and runoff over the 10 years of the study, with the highest % runoff and sediment loads occurring in 2008 (Fig. 9a). The runoff and sediment loads increased during the study despite the ground cover of the catchment increasing from 45 to 92% (Table 7). This result is similar to the flume data that suggests that, although ground cover has some influence on the timing and volume of runoff experienced in early wet season events, once the soil profile has been saturated, further rainfall simply ran off.

|

|
Despite ground cover appearing to have little influence on catchment runoff, there was a decline in the TSS concentration during the study. There was a significant (P < 0.05) exponential relationship between average catchment cover and the EMC values for TSS concentration measured at the stream gauge (Fig. 9d). There was also an inverse relationship between EMC and runoff (Fig. 9e), indicating that EMC has declined as a result of a relatively constant sediment load being diluted into larger volumes of runoff over the study period.
Within this generally noisy picture, it is possible that a combination of reduced hill-slope erosion and increased sediment trapping on scald and gully features occurred within the catchment in response to an increase in ground cover; however, these effects appeared to be overshadowed by climatic variability.
Discussion
Hill-slope scale response
On all of the hill-slopes, pasture biomass and % ground cover increased over the study period. Pasture biomass at the end of the dry season increased from 60 to 400 kg DM ha–1 in the early years of the study to 500–1200 kg DM ha–1 in later years. The pasture biomass observed at Virginia Park in 2011 was, however, still well below that observed in ungrazed native pastures (e.g. 4000 kg/ha; Owens et al. 2003), and were still lower than those recommended by Ash et al. (2011) for this landscape type. This is because most of the increase in ground cover came from the stoloniferous grass, B. pertusa. It is often the most prominent perennial grass during a recovery phase as it produces more seed than native grasses and spreads by stolons (McIvor and Gardener 1990). The percentage of decreaser native perennial grasses in the pasture biomass at the end of the dry season increased from 5–7% to 15–30% across all flume sites, with the pasture biomass of these species being 100–270 kg DM ha–1 in the later high-rainfall years. The percentage of decreaser native perennial grasses present in 2011 was still lower than the 78% found on this property in 1979 (Gardener et al. 1990). As B. pertusa is such an effective coloniser on degraded landscapes, it makes severely degraded landscapes look robust on the surface (Northup et al. 2005) but it can mask the degraded soil condition below the surface.
Numerous studies in the Burdekin catchment and elsewhere have demonstrated that increased ground cover results in increased rainfall infiltration (McIvor et al. 1995; Scanlan et al. 1996b; Roth 2004; Amiri et al. 2008; Silburn et al. 2011). At Virginia Park, increased ground cover has been shown to be effective at reducing runoff for early wet season events via increased infiltration (Bartley et al. 2010a) but high-rainfall years continue to result in high annual runoff totals regardless of the ground cover. The proportion of tree litter and native perennial grasses, that have a larger and deeper root structure, are critical for further increasing infiltration rates at this site (e.g. Roth 2004), which will subsequently improve the health of the soil (Dawes 2010a, 2010b).
Given that there has been considerable loss of top soil at this site (Bartley et al. 2010a), full recovery of the soil profile will be challenging. Improvements to the infiltration capacity of the soil may be possible if (i) the proportion of deep-rooted native perennial grasses increases and facilitates the movement of water into the soil profile, (ii) organic matter can be incorporated into the soil (via litter), (iii) macroporosity of the soil can be improved (via macro-fauna) (e.g. Drewry 2006) and (iv) surface seals are removed that developed when the soil was bare. Recovery of soil condition and a reduction in associated runoff has been demonstrated in Winconsin, United States and can take as little as 3 years (Sartz and Tolsted 1974) but periods of 5–40 years are more likely where the soil has been severely compacted or previously cultivated (Connolly et al. 1998). Where there has been dramatic changes in vegetation or severe soil degradation, ~60 years is needed to see changes in catchment runoff following improved soil condition (Wilcox et al. 2008). Importantly, in very large rainfall events (>100 mm and >45 mm h–1 intensity), ground cover has been shown to have little or no effect on runoff (McIvor et al. 1995). Thus, it is unlikely that changes to grazing management will have an influence on the amount of runoff following very large events.
Despite the absence of an identifiable change in annual hill-slope runoff or sediment yields with changes to grazing management and ground cover between 2002 and 2011, there was a statistically significant reduction in TSS concentrations on hill-slopes that did not have large and persistent bare (<10% cover) areas. When ground cover on Flumes 1 and 2 reached ~70%, the TSS concentrations were not significantly different to those from exclosures at Meadowvale. This suggests that, if average ground cover in can be maintained at or near 70%, then TSS concentrations are likely to be minimised, even with B. pertusa dominating the composition of the pasture. It is acknowledged that maintaining high levels of ground cover is difficult in dry years even under the most ideal management conditions (O’Reagain et al. 2011) and, therefore, 70% cover is considered a long-term goal. Similar cover thresholds have been observed elsewhere (e.g. Castillo et al. 1997; Sanjari et al. 2009), noting that the amount of cover required to reduce and minimise TSS concentrations and soil loss will also depend on the soil type, rainfall intensity and antecedent soil moisture content (Castillo et al. 2003; Silburn et al. 2011). This cover may help reduce hill-slope sediment loss but, as discussed above, the proportion of deep-rooted perennial grasses is critical for reducing the runoff that is fuelling other erosion processes (e.g. gully erosion) once the water leaves the hill-slope. Thus, increasing the proportion of native deep-rooted perennial grasses should be a target on all rangeland landscapes in the Burdekin catchment.
Catchment-scale response
The runoff and sediment yields at the catchment scale followed a similar pattern to the flume results, increasing in response to increasing rainfall. Compared with the flume results, the end of catchment TSS concentrations had a weaker, but still significant, decline in response to increasing ground cover in the catchment. This weaker relationship is expected as sub-surface or channel (scald, gully and stream-bank) erosion contribute ~60% of the sediment concentrations and loads measured at the end of the catchment (Bartley et al. 2007; Hancock et al. 2013; Wilkinson et al. 2013). The strong relationship between catchment runoff and sediment yield over the entire duration of the study supports the hypothesis that channel erosion remains a dominant and persistent sediment source in 2011. Although channel erosion is indirectly influenced by hill-slope ground cover by the latter’s influence on runoff, there is likely to be a multi-decade lag in this response, and there are other processes of geomorphic change (e.g. channel bed incision, upslope advancement and widening) that are likely to be involved that do not respond directly to changes in ground cover. Across all years of the study, annual sediment yield was well correlated with annual runoff, suggesting that the amount of runoff is the dominant mechanism driving erosion in these catchments.
What was the effect of changes to grazing management?
Over the 10-year study, ground cover increased by ~104% on the instrumented hill-slopes and over the whole Weany Creek catchment. This increase was higher than that of a neighbouring control property that did not implement the same grazing management practices (~65%). As no ground-based field data were collected on the adjacent control property, it is difficult to attribute the difference in ground cover values to grazing management. The results, however, are consistent with expectations and trends from a replicated grazing trial located in the south-west of the Upper Burdekin catchment (O’Reagain et al. 2011). Subsequent analysis by Bastin et al. (2012), using remote sensing, demonstrated that both spatially-averaged and seasonally-adjusted ground cover increased at Virginia Park compared with the neighbouring property over the same time period. This suggests that grazing management, and not just increased rainfall, was the main cause of the increased cover. It may well be that grazing practices would have had a larger influence if the later years of the study had been drier and less favourable for pasture growth. The real test of these practices will be in future dry years.
Although the benefits to water quality of implementing changes to grazing management on degraded landscapes, such as Weany Creek, may take several decades to be fully realised, recent research suggests that these strategies have economic benefits in terms of beef production for rangeland enterprises in the Burdekin region (MacLeod et al. 2009; O’Reagain et al. 2011).
Recommendations for improving rates of pasture recovery in degraded rangelands
This study has shown that mean ground cover at the catchment scale is not necessarily the best indicator of changes in water quality associated with changes in grazing management, and the spatial arrangement, species composition and pasture biomass are all critically important for accurately predicting the influence of ground cover on runoff and erosion. Future monitoring of rangeland condition needs to take all of these factors into account. Ground cover metrics alone are not sufficient.
Cattle are known to preferentially graze riparian and sodic (dispersible texture contrast) soils and previously grazed patches because of the high sodium levels in the soil and rapid response to vegetation growth after light rain (Condon 2002). Because of this, these vulnerable areas take longer to recover using changes in stock numbers alone. Critically, areas with large bare patches can have erosion rates up to 70 times higher than areas without bare/scalded areas and the total erosion rates (of 0.25 mm year–1) for these sites are much greater than the documented soil production rates (Bui et al. 2011). Therefore, targeted management of land which is scalded, bare or in D condition class would be recommended to help facilitate reductions in sediment yields from grazed hill-slopes. The preliminary results from the bunding wall installed on Flume 3 suggest that simple interventions in strategic areas could provide positive outcomes for reducing runoff and sediment loss from chronically degraded sites.
When B. pertusa dominates landscapes, there are minimal amounts of seed of desirable perennial native pastures present. Actively reintroducing the seed of preferred species should be considered as a management option in high-risk erosion areas. The response from such treatments may be variable depending on climate and local site conditions (McIvor 2001) but this approach should be considered when desirable species are not present.
Longer and more frequent WSR, especially in the early years of recovery, is important for increasing ground cover and biomass in improving B. pertusa-dominated rangelands and increasing the long-term carrying capacity (O’Reagain et al. 2011). WSR is also vital for facilitating the recovery of patches of decreaser, native, perennial grasses during the growing period.
Areas of further research
Following 10 years of research at this site, the key question that remains is: if the percentage of deep-rooted native perennial pastures were reinstated to the 1979 levels of ~80%, would we see a significant reduction in the % runoff at the hill-slope and catchment scale? Or has the excessive erosion that has occurred over the last 30+ years transformed this landscape such that eco-hydrological ‘recovery’ is unlikely? We need to better understand the eco-hydrological consequences of landscape change, and the methods required to mitigate and manage these changes (Wilcox 2010). Long-term (40-year) datasets were required to quantify the changes to runoff following changed land management and cover in other areas of Queensland (e.g. Thornton et al. 2007). It is likely that similar time-frames, or new innovative approaches that link pasture metrics and catchment-scale water-balance measurement, are going to be required to determine the recovery potential of these landscapes.
Standard erosion models, such as the RUSLE (Renard et al. 1997), would associate higher ground cover with reductions in hill-slope sediment yield. This study has shown that declines in sediment yield do not necessarily occur with increased ground cover, and rainfall remains the strongest determinant of annual sediment yield in these degraded rangeland systems. Further research, linking process understanding, derived from field data, with hill-slope and catchment models, is critical for transferring the results of this study to other rangeland areas in northern Australia. It is also critical for the scenario modelling that currently occurs as part of the Great Barrier Reef Water Quality Plan (Carroll et al. 2012).
Conclusions
This study presented 10 years of data on rainfall, runoff and sediment yield from a catchment within a commercial grazing property that underwent changes to grazing management in the form of reduced stocking and WSR. The study was initiated during a drought, and the cover and pasture biomass at the beginning of the study was very low (ground cover of ~35% and a biomass of 60 kg DM ha–1). Bartley et al. (2010a) presented the initial 6 years of data from this study demonstrating that increases in ground cover (up to ~72%) resulted in a 70% decline in sediment yields from two out of three hill-slopes. A further 4 years of data, collected during years with above-average rainfall, have shown that the changes to grazing practices have not resulted in a sustained reduction in sediment yields on hill-slopes or at the end of the catchment. Reductions in TSS concentration have occurred at both hill-slope and catchment scales as B. pertusa has been successful at protecting the soil surface and reducing erosion. However, the task now is to reduce the total annual runoff and sediment yields (and not just concentrations of TSS). Reducing the amount of runoff that is leaving the hill-slope is important for reducing the rate of gully and bank erosion that is dominating catchment sediment yields. Increasing the proportion of deep-rooted perennial pastures is considered critical for this process. Despite this being the longest dataset linking grazing management and water quality responses in Northern Australia, it appears that the eco-hydrological recovery process has only just begun at Weany Creek.
This study has highlighted the importance of long-term well managed datasets for identifying the link between land management, pasture change and water quality responses. The results of this research are important for managing expectations with respect to the rate and amount of improvement in water quality that will occur in response to changes in grazing management. Current land condition targets are unlikely to produce the targeted reductions in sediment load in highly degraded rangeland areas. These results are highly relevant for the success of the Reef Water Quality Protection Plan (Commonwealth and Queensland Governments 2003), the health of the Great Barrier Reef, and the long-term sustainability of grazing in rangelands of northern Australia.
Acknowledgements
The research presented in this publication was funded by Meat and Livestock Australia, CSIRO, Queensland Department of Primary Industries (now QDAFF), and eWater CRC. Their support is gratefully acknowledged. We also thank Rob and Sue Bennetto on ‘Virginia Park’ Station and the Ramsay Family on ‘Meadowvale’ Station for access to their properties over 10 years to carry out this work. Thanks to Brigid Nelson for her early contributions to the grazing management study and to Peter Fitch, David Fanning, Jamie Vleeshouwer, Joseph Kemei, Lindsay Whiteman of CSIRO and the late Peter Allen for the installation of field equipment and collection of samples. Thanks to Mike Nicholas (CSIRO) for his field support and updated stocking rates for the property. Thanks also to Christian Roth, David Post and David McJannet to contributions towards the project management and analysis of data over the last decade. Finally thank you to Mick Quirk, Ross Searle, Kerrie Tompkins, Andrew Ash and several anonymous reviewers for useful comments on earlier versions of this manuscript.
References
Alewijnse, M. (2003). Grazing and water infiltration in the savanna landscape. Honours Thesis, School of Tropical Environmental Studies and Geography, James Cook University, Townsville, Qld, Australia.Amiri, F., Ariapour, A., and Fadai, S. (2008). Effects of livestock grazing on vegetation composition and soil moisture properties in grazed and non-grazed range site. The Journal of Biological Sciences 8, 1289–1297.
| Effects of livestock grazing on vegetation composition and soil moisture properties in grazed and non-grazed range site.Crossref | GoogleScholarGoogle Scholar |
Ash, A., Corfield, J., and Ksiksi, T. (2001). ‘The Ecograze Project: Developing Guidelines to Better Manage Grazing Country.’ (CSIRO Sustainable Ecosystems and QDPI: Townsville.)
Ash, A. J., Corfield, J. P., McIvor, J. G., and Ksiksi, T. S. (2011). Grazing management in tropical savannas: utilization and rest strategies to manipulate rangeland condition. Rangeland Ecology and Management 64, 223–239.
| Grazing management in tropical savannas: utilization and rest strategies to manipulate rangeland condition.Crossref | GoogleScholarGoogle Scholar |
Bartley, R., Roth, C. H., Ludwig, J., McJannet, D., Liedloff, A., Corfield, J., Hawdon, A., and Abbott, B. (2006). Runoff and erosion from Australia’s tropical semi-arid rangelands: influence of ground cover for differing space and time scales. Hydrological Processes 20, 3317–3333.
| Runoff and erosion from Australia’s tropical semi-arid rangelands: influence of ground cover for differing space and time scales.Crossref | GoogleScholarGoogle Scholar |
Bartley, R., Hawdon, A., Post, D. A., and Roth, C. H. (2007). A sediment budget in a grazed semi-arid catchment in the Burdekin basin, Australia. Geomorphology 87, 302–321.
| A sediment budget in a grazed semi-arid catchment in the Burdekin basin, Australia.Crossref | GoogleScholarGoogle Scholar |
Bartley, R., Corfield, J. P., Abbott, B. N., Hawdon, A. A., Wilkinson, S. N., and Nelson, B. (2010a). Impacts of improved grazing land management on sediment yields, Part I: Hillslope processes. Journal of Hydrology 389, 237–248.
| Impacts of improved grazing land management on sediment yields, Part I: Hillslope processes.Crossref | GoogleScholarGoogle Scholar |
Bartley, R., Wilkinson, S. N., Hawdon, A. A., Abbott, B. N., and Post, D. A. (2010b). Impacts of improved grazing land management on sediment yields, Part 2: catchment response. Journal of Hydrology 389, 249–259.
| Impacts of improved grazing land management on sediment yields, Part 2: catchment response.Crossref | GoogleScholarGoogle Scholar |
Bartley, R., Bainbridge, Z. T., Lewis, S. E., Kroon, F. J., Wilkinson, S. N., Brodie, J. E., and Silburn, D. M. (2014). Relating sediment impacts on coral reefs to watershed sources, processes and management: a review. Science of the Total Environment 468–469C, 1138–1153.
| Relating sediment impacts on coral reefs to watershed sources, processes and management: a review.Crossref | GoogleScholarGoogle Scholar |
Bastin, G., Scarth, P., Chewings, V., Sparrow, A., Denham, R., Schmidt, M., O’Reagain, P., Shepherd, R., and Abbott, B. (2012). Separating grazing and rainfall effects at regional scale using remote sensing imagery: a dynamic reference-cover method. Remote Sensing of Environment 121, 443–457.
| Separating grazing and rainfall effects at regional scale using remote sensing imagery: a dynamic reference-cover method.Crossref | GoogleScholarGoogle Scholar |
Brodie, J., and Waterhouse, J. (2012). A critical review of environmental management of the ‘not so Great’ Barrier reef. Estuarine, Coastal and Shelf Science 104, 1–22.
| A critical review of environmental management of the ‘not so Great’ Barrier reef.Crossref | GoogleScholarGoogle Scholar |
Bui, E. N., Hancock, G. J., and Wilkinson, S. N. (2011). ‘Tolerable’ hillslope soil erosion rates in Australia: linking science and policy. Agriculture, Ecosystems & Environment 144, 136–149.
| ‘Tolerable’ hillslope soil erosion rates in Australia: linking science and policy.Crossref | GoogleScholarGoogle Scholar |
Burdekin Project Committee (1976). ‘Resources and Potential of the Burdekin River Basin, Queensland: Appendix 2b Land and Associated Features.’ (Australian Government Publishing Service: Canberra.)
Carroll, C., Waters, D., Vardy, S., Silburn, D. M., Attard, S., Thorburn, P. J., Davis, A. M., Halpin, N., Schmidt, M., Wilson, B., and Clark, A. (2012). A paddock to reef monitoring and modelling framework for the Great Barrier Reef: paddock and catchment component. Marine Pollution Bulletin 65, 136–149.
| A paddock to reef monitoring and modelling framework for the Great Barrier Reef: paddock and catchment component.Crossref | GoogleScholarGoogle Scholar | 1:CAS:528:DC%2BC38XotlOnsLc%3D&md5=d09d8ab028229415380eefd7de3a10d0CAS | 22277580PubMed |
Castillo, V. M., Martinez-Mena, M., and Albaladejo, J. (1997). Runoff and soil loss response to vegetation removal in a semiarid environment. Soil Science Society of America Journal 61, 1116–1121.
| Runoff and soil loss response to vegetation removal in a semiarid environment.Crossref | GoogleScholarGoogle Scholar | 1:CAS:528:DyaK2sXlt1ShsbY%3D&md5=01b4cf7aa52706d9904eb629fe45a4c8CAS |
Castillo, V. M., Gomez-Plaza, A., and Martinez-Mena, M. (2003). The role of antecedent soil water content in the runoff response of semiarid catchments: a simulation approach. Journal of Hydrology 284, 114–130.
| The role of antecedent soil water content in the runoff response of semiarid catchments: a simulation approach.Crossref | GoogleScholarGoogle Scholar |
Chilcott, C. R., McCallum, B. S., Quirk, M. F., and Paton, C. J. (2003). ‘Grazing Land Management Education Package Workshop Notes – Burdekin.’ (Meat and Livestock Australia: Sydney.)
Commonwealth and Queensland Governments (2003). Reef water quality protection plan: for catchments adjacent to the Great Barrier Reef World Heritage Area, Australian Government and Queensland Governments. Available at: www.reefplan.qld.gov.au/about/rwqpp.shtm (accessed 21 November 2013).
Condon, R. W. (2002). Out of the West: Historical Perspectives on the Western Division of New South Wales. Lower Murray Darling and Western Catchment Management Committees (NSW), Rangeland Management Action Plan, Mildura. 448 pp.
Connolly, R. D., Freebairn, D. M., and Bell, M. J. (1998). Change in soil infiltration associated with leys in south-eastern Queensland. Australian Journal of Soil Research 36, 1057–1072.
| Change in soil infiltration associated with leys in south-eastern Queensland.Crossref | GoogleScholarGoogle Scholar |
Dawes, T. Z. (2010a). Impacts of habitat disturbance on termites and soil water storage in a tropical Australian savanna. Pedobiologia 53, 241–246.
| Impacts of habitat disturbance on termites and soil water storage in a tropical Australian savanna.Crossref | GoogleScholarGoogle Scholar |
Dawes, T. Z. (2010b). Reestablishment of ecological functioning by mulching and termite invasion in a degraded soil in an Australian savanna. Soil Biology & Biochemistry 42, 1825–1834.
| Reestablishment of ecological functioning by mulching and termite invasion in a degraded soil in an Australian savanna.Crossref | GoogleScholarGoogle Scholar | 1:CAS:528:DC%2BC3cXhtVKiu7bL&md5=d208a1fa62d3fee939814f0164682fb6CAS |
De’ath, G., Fabricius, K. E., Sweatman, H., and Puotinen, M. (2012). The 27-year decline of coral cover on the Great Barrier Reef and its causes. Proceedings of the National Academy of Sciences of the United States of America 109, 17995–17999.
| The 27-year decline of coral cover on the Great Barrier Reef and its causes.Crossref | GoogleScholarGoogle Scholar | 1:CAS:528:DC%2BC38Xhsl2ktbjF&md5=963ab1844a5980e8691c2ff20ffeb0acCAS | 23027961PubMed |
DeCorte, M. W. M., Barry, E. V., Bright, M. J., Cannon, M. G., and Scanlan, J. C. (1994). Land degradation in the Dalrymple Shire, a preliminary assessment, methods and results, Project Report Q093023, Queensland Department of Primary Industries, Brisbane.
Drewry, J. J. (2006). Natural recovery of soil physical properties from treading damage of pastoral soils in New Zealand and Australia: a review. Agriculture, Ecosystems & Environment 114, 159–169.
| Natural recovery of soil physical properties from treading damage of pastoral soils in New Zealand and Australia: a review.Crossref | GoogleScholarGoogle Scholar |
Eldridge, D. J., and Rothon, J. (1992). Runoff and sediment yield from a semi-arid woodland in Eastern Australia. 1. The effect of pasture type. The Rangeland Journal 14, 26–39.
| Runoff and sediment yield from a semi-arid woodland in Eastern Australia. 1. The effect of pasture type.Crossref | GoogleScholarGoogle Scholar |
Gardener, C. J., McIvor, J., and Williams, J. (1990). Dry tropical rangelands: solving one problem and creating another. Proceedings Ecological Society of Australia 16, 279–286.
Great Barrier Reef Marine Park Authority (2012). ‘Informing the Outlook for Great Barrier Reef Coastal Ecosystems.’ (Great Barrier Reef Marine Park Authority: Townsville.)
Hancock, G. J., Wilkinson, S. N., Hawdon, A. A., and Keen, R. J. (2013). Use of fallout tracers 7Be, 210Pb and 137Cs to distinguish the form of sub-surface soil erosion delivering sediment to rivers in large catchments. Hydrological Processes , .
| Use of fallout tracers 7Be, 210Pb and 137Cs to distinguish the form of sub-surface soil erosion delivering sediment to rivers in large catchments.Crossref | GoogleScholarGoogle Scholar |
Harms, B. P., and Main, A. K. (2006). Key reference sites for Queensland: a compendium of soil and regolith reference sites. Department of Natural Resources, Mines and Water, Brisbane, QNRM06197.
Hawdon, A., Keen, R. J., Post, D. A., and Wilkinson, S. N. (2008). Hydrological recovery of rangeland following cattle exclusion. In: ‘Sediment Dynamics in Changing Environments’. IAHS Publ. 325. (Eds J. Schmidt, T. Cochrane, C. Phillips, S. Elliott, T. Davies and L. Basher.) pp. 532–539. (IAHS: Christchurch, New Zealand.)
Hawdon, A., Keen, R., and Vleeshouwer, J. (2009). A remote automated water quality stream gauging system design, CSIRO Land and Water Science Report 24/09, Townsville, Qld. Available at: www.clw.csiro.au/publications/science/2009/sr24-09.pdf (accessed 21 November 2013).
Kinsey-Henderson, A. E., Post, D. A., and Prosser, I. P. (2005). Modelling sources of sediment at sub-catchment scale: an example from the Burdekin Catchment, North Queensland, Australia. Mathematics and Computers in Simulation 69, 90–102.
| Modelling sources of sediment at sub-catchment scale: an example from the Burdekin Catchment, North Queensland, Australia.Crossref | GoogleScholarGoogle Scholar |
Kroon, F. J., Kuhnert, P. M., Henderson, B. L., Wilkinson, S. N., Kinsey-Henderson, A., Abbott, B., Brodie, J. E., and Turner, R.D.R. (2012). River loads of suspended solids, nitrogen, phosphorus and herbicides delivered to the Great Barrier Reef lagoon. Marine Pollution Bulletin 65, 167–181.
| River loads of suspended solids, nitrogen, phosphorus and herbicides delivered to the Great Barrier Reef lagoon.Crossref | GoogleScholarGoogle Scholar | 1:CAS:528:DC%2BC38XotlOntL4%3D&md5=b519cc31210c70866943b13922224543CAS | 22154273PubMed |
Landsberg, R. G., Ash, A. J., Shepherd, R. K., and McKeon, G. M. (1998). Learning from history to survive in the future: management evolution on Trafalgar Station, North-East Queensland. The Rangeland Journal 20, 104–118.
| Learning from history to survive in the future: management evolution on Trafalgar Station, North-East Queensland.Crossref | GoogleScholarGoogle Scholar |
Letcher, R. A., Jakeman, A. J., Merritt, W. S., McKee, L. J., Eyre, B. D., and Baginska, B. (1999). Review of techniques to estimate catchment exports. NSW EPA Report 99/73, Sydney.
Leuning, R., Cleugh, H. A., Zegelin, S. J., and Hughes, D. (2005). Carbon and water fluxes over a temperate Eucalyptus forest and a tropical wet/dry savanna in Australia: measurements and comparison with MODIS remote sensing estimates. Agricultural and Forest Meteorology 129, 151–173.
| Carbon and water fluxes over a temperate Eucalyptus forest and a tropical wet/dry savanna in Australia: measurements and comparison with MODIS remote sensing estimates.Crossref | GoogleScholarGoogle Scholar |
Ludwig, J. A., Wilcox, B. P., Breshears, D. D., Tongway, D. J., and Imeson, A. C. (2005). Vegetation patches and runoff-erosion as interacting ecohydrological processes in semiarid landscapes. Ecology 86, 288–297.
| Vegetation patches and runoff-erosion as interacting ecohydrological processes in semiarid landscapes.Crossref | GoogleScholarGoogle Scholar |
Ludwig, J. A., Bartley, R., Hawdon, A., Abbott, B., and McJannet, D. (2007). Patch configuration non-linearly affects sediment loss across scales in a grazed catchment in north-east Australia. Ecosystems 10, 839–845.
| Patch configuration non-linearly affects sediment loss across scales in a grazed catchment in north-east Australia.Crossref | GoogleScholarGoogle Scholar |
MacLeod, N. D., Nelson, B. S., McIvor, J. G., and Corfield, J. P. (2009). Wet season resting – economic insights from scenario modelling. The Rangeland Journal 31, 143–150.
| Wet season resting – economic insights from scenario modelling.Crossref | GoogleScholarGoogle Scholar |
McCulloch, M., Fallon, S., Wyndham, T., Hendy, E., Lough, J., and Barnes, D. (2003). Coral record of increased sediment flux to the inner Great Barrier Reef since European Settlement. Nature 421, 727–730.
| Coral record of increased sediment flux to the inner Great Barrier Reef since European Settlement.Crossref | GoogleScholarGoogle Scholar | 1:CAS:528:DC%2BD3sXhsV2rsbg%3D&md5=51070b1f70cb313ab38932ba283298a3CAS | 12610621PubMed |
McIvor, J. G. (2001). Pasture management in semi-arid tropical woodlands: regeneration of degraded pastures protected from grazing. Australian Journal of Experimental Agriculture 41, 487–496.
| Pasture management in semi-arid tropical woodlands: regeneration of degraded pastures protected from grazing.Crossref | GoogleScholarGoogle Scholar |
McIvor, J., and Gardener, C. J. (1990). Soil and vegetation characteristics of dry tropical rangelands for predicting pasture regeneration in exclosures. Proceedings Ecological Society of Australia 16, 273–277.
McIvor, J. G., Williams, J., and Gardener, C. J. (1995). Pasture management influences runoff and soil movement in the semi-arid tropics. Australian Journal of Experimental Agriculture 35, 55–65.
| Pasture management influences runoff and soil movement in the semi-arid tropics.Crossref | GoogleScholarGoogle Scholar |
McKeon, G., Hall, W., Henry, B., Stone, G., and Watson, I. (Eds) (2004). ‘Pasture Degradation and Recovery in Australia’s Rangelands: Learning from History.’ (Department of Natural Resources Mines and Energy Queensland: Brisbane.)
Northup, B. K., Dias, C. D., Brown, J. R., and Skelly, W. C. (2005). Micro-patch and community scale spatial distribution of herbaceous cover in a grazed eucalypt woodland. Journal of Arid Environments 60, 509–530.
| Micro-patch and community scale spatial distribution of herbaceous cover in a grazed eucalypt woodland.Crossref | GoogleScholarGoogle Scholar |
O’Reagain, P., Bushell, J., and Holmes, B. (2011). Managing for rainfall variability: long-term profitability of different grazing strategies in a northern Australian tropical savanna. Animal Production Science 51, 210–224.
| Managing for rainfall variability: long-term profitability of different grazing strategies in a northern Australian tropical savanna.Crossref | GoogleScholarGoogle Scholar |
Owens, J. S., Silburn, D. M., McKeon, G. M., Carroll, C., Willcocks, J., and deVoil, R. (2003). Cover-runoff equations to improve simulation of runoff in pasture growth models. Australian Journal of Soil Research 41, 1467–1488.
| Cover-runoff equations to improve simulation of runoff in pasture growth models.Crossref | GoogleScholarGoogle Scholar |
Peña-Arancibia, J. L., van Dijk, A. I. J. M., Guerschman, J. P., Mulligan, M., Bruijnzeel, L. A., and McVicar, T. R. (2012). Detecting changes in streamflow after partial woodland clearing in two large catchments in the seasonal tropics. Journal of Hydrology 416–417, 60–71.
| Detecting changes in streamflow after partial woodland clearing in two large catchments in the seasonal tropics.Crossref | GoogleScholarGoogle Scholar |
Pickup, G., Chewings, V. H., and Nelson, D. J. (1993). Estimating changes in vegetation cover over time in arid rangelands using Landsat MSS data. Remote Sensing of Environment 43, 243–263.
| Estimating changes in vegetation cover over time in arid rangelands using Landsat MSS data.Crossref | GoogleScholarGoogle Scholar |
Prebble, R. E., and Stirk, G. B. (1988). Hydrological effects of land use change on small catchments at the Narayen Research Station, Queensland. Australian Journal of Soil Research 26, 231–242.
| Hydrological effects of land use change on small catchments at the Narayen Research Station, Queensland.Crossref | GoogleScholarGoogle Scholar |
Prosser, I., Moran, C., Lu, H., Scott, A., Rustomji, P., Stevenson, J., Priestly, G., Roth, C. H., and Post, D. (2001). ‘Regional Patterns of Erosion and Sediment Transport in the Burdekin River Catchment.’ (Meat and Livestock Australia: Sydney.)
Renard, K. G., Foster, G. A., Weesies, D. K., McCool, D. K., and Yoder, D. C. (1997). ‘Agriculture Handbook 703.’ (United States Department of Agriculture: Washington, DC.)
Roff, G., Clark, T. R., Reymond, C. E., Zhao, J.-x., Feng, Y., McCook, L. J., Done, T. J., and Pandolfi, J. M. (2013). Palaeoecological evidence of a historical collapse of corals at Pelorus Island, inshore Great Barrier Reef, following European settlement. Proceedings of the Royal Society B: Biological Sciences 280, .
| Palaeoecological evidence of a historical collapse of corals at Pelorus Island, inshore Great Barrier Reef, following European settlement.Crossref | GoogleScholarGoogle Scholar | 23135672PubMed |
Rogers, L., Cannon, M., and Barry, E. (1999). ‘Land Resources of the Dalrymple Shire.’ (Department of Natural Resources and CSIRO: Brisbane.)
Roth, C. (2004). A framework relating soil surface condition to infiltration and sediment and nutrient mobilisation in grazed rangelands of north-eastern Queensland. Earth Surface Processes and Landforms 29, 1093–1104.
| A framework relating soil surface condition to infiltration and sediment and nutrient mobilisation in grazed rangelands of north-eastern Queensland.Crossref | GoogleScholarGoogle Scholar |
Sanjari, G., Yu, B. F., Ghadiri, H., Ciesiolka, C. A. A., and Rose, C. W. (2009). Effects of time-controlled grazing on runoff and sediment loss. Australian Journal of Soil Research 47, 796–808.
| Effects of time-controlled grazing on runoff and sediment loss.Crossref | GoogleScholarGoogle Scholar |
Sartz, R. S., and Tolsted, D. N. (1974). Effect of grazing on runoff from two small watersheds in southwestern Wisconsin. Water Resources Research 10, 354–356.
| Effect of grazing on runoff from two small watersheds in southwestern Wisconsin.Crossref | GoogleScholarGoogle Scholar |
Scanlan, J. C., Pressland, A. J., and Myles, D. J. (1996a). Grazing modifies woody and herbaceous components of North Queensland woodlands. The Rangeland Journal 18, 47–57.
| Grazing modifies woody and herbaceous components of North Queensland woodlands.Crossref | GoogleScholarGoogle Scholar |
Scanlan, J. C., Pressland, A. J., and Myles, D. J. (1996b). Run-off and soil movement on mid-slopes in North-east Queensland grazed woodlands. The Rangeland Journal 18, 33–46.
| Run-off and soil movement on mid-slopes in North-east Queensland grazed woodlands.Crossref | GoogleScholarGoogle Scholar |
Silburn, D. M., Carroll, C., Ciesiolka, C. A. A., deVoil, R. C., and Burger, P. (2011). Hillslope runoff and erosion on duplex soils in grazing lands in semi-arid central Queensland. I. Influences of cover, slope, and soil. Soil Research 49, 105–117.
| Hillslope runoff and erosion on duplex soils in grazing lands in semi-arid central Queensland. I. Influences of cover, slope, and soil.Crossref | GoogleScholarGoogle Scholar |
Siriwardena, L., Finlayson, B. L., and McMahon, T. A. (2006). The impact of land use change on catchment hydrology in large catchments: The Comet River, Central Queensland, Australia. Journal of Hydrology 326, 199–214.
| The impact of land use change on catchment hydrology in large catchments: The Comet River, Central Queensland, Australia.Crossref | GoogleScholarGoogle Scholar |
Thornton, C. M., Cowie, B. A., Freebairn, D. M., and Playford, C. L. (2007). The Brigalow Catchment Study: II. Clearing brigalow (Acacia harpophylla) for cropping or pasture increases runoff. Australian Journal of Soil Research 45, 496–511.
| The Brigalow Catchment Study: II. Clearing brigalow (Acacia harpophylla) for cropping or pasture increases runoff.Crossref | GoogleScholarGoogle Scholar |
Tongway, D., and Hindley, N. (1995). ‘Manual for Soil Condition Assessment of Tropical Grasslands.’ (CSIRO Publishing: Melbourne.)
Tothill, J. C., McDonald, C. K., Jones, R. M., and Hargreaves, J. N. G. (1992). ‘BOTANAL: A Comprehensive Sampling and Computing Procedure for Estimating Pasture Yield and Composition. Field Sampling.’ (CSIRO Division of Tropical Crops and Pastures: Brisbane.)
Walling, D. E. (2006). Human impact on land-ocean sediment transfer by the world’s rivers. Geomorphology 79, 192–216.
| Human impact on land-ocean sediment transfer by the world’s rivers.Crossref | GoogleScholarGoogle Scholar |
Wilcox, B. P. (2010). Transformative ecosystem change and ecohydrology: ushering in a new era for watershed management. Ecohydrology 3, 126–130.
| Transformative ecosystem change and ecohydrology: ushering in a new era for watershed management.Crossref | GoogleScholarGoogle Scholar |
Wilcox, B. P., Huang, Y., and Walker, J. W. (2008). Long-term trends in streamflow from semiarid rangelands: uncovering drivers of change. Global Change Biology 14, 1676–1689.
| Long-term trends in streamflow from semiarid rangelands: uncovering drivers of change.Crossref | GoogleScholarGoogle Scholar |
Wilkinson, S. N., Hancock, G. J., Bartley, R., Hawdon, A. A., and Keen, R. (2013). Using sediment tracing to assess processes and spatial patterns of erosion in grazed rangelands, Burdekin River basin, Queensland, Australia. Agriculture, Ecosystems & Environment 180, 90–102.
| Using sediment tracing to assess processes and spatial patterns of erosion in grazed rangelands, Burdekin River basin, Queensland, Australia.Crossref | GoogleScholarGoogle Scholar |