Increase in HIV diagnoses among men who have sex with men in New Zealand from a stable low period
Peter J. W. Saxton A B C , Nigel P. Dickson B , Susan M. McAllister B , Katrina Sharples B and Anthony J. Hughes AA Research Unit, New Zealand AIDS Foundation, PO Box 6663, Wellesley Street, Auckland 1141, New Zealand.
B AIDS Epidemiology Group, Department of Preventive and Social Medicine, University of Otago Medical School, PO Box 913, Dunedin, New Zealand.
C Corresponding author. Email: peter.saxton@otago.ac.nz
Sexual Health 8(3) 311-318 https://doi.org/10.1071/SH10087
Submitted: 13 July 2010 Accepted: 3 November 2010 Published: 17 August 2011
Journal Compilation © CSIRO Publishing 2011 Open Access CC BY-NC-ND
Abstract
Objectives: To describe trends in HIV diagnoses among men who have sex with men (MSM) in New Zealand 1996–2008, and to identify characteristics associated with HIV diagnoses in the resurgent phase. Methods: Data collected through routine surveillance of HIV infection, where the mode of transmission included homosexual contact, were analysed over the period 1996–2008. Results: Annual HIV diagnoses were low during 1996–2000, rose sharply between 2001 and 2005, and remained at an elevated plateau between 2006 and 2008. Over a quarter were attributed to HIV infection acquired overseas (28.6%). Trends in diagnoses of locally acquired HIV infection closely mirrored the trend of three diagnosis phases. Increases in locally acquired HIV occurred among virtually all characteristics of MSM. However, compared with MSM diagnosed in the low phase 1996–2000, individuals diagnosed in the resurgent phase 2001–05 were more likely to be aged 30–39, to have tested HIV-negative within the previous 2 years, to live in the Northern region encompassing Auckland, and to be of non-European ethnicity. The per capita HIV diagnosis rate among MSM was lowest in 1997, at 22.0 per million males aged 15–64, and highest in 2005 at 66.7 per million. Conclusion: The increase in HIV diagnoses among MSM in New Zealand was primarily due to an increase in locally acquired HIV infection, which disproportionately affected some groups of MSM. Factors driving this change in local epidemic conditions need to be identified. The rate of new HIV diagnoses among MSM remains low by international standards.
Additional keywords: characteristics, epidemic phases, per capita rates, trends.
Introduction
While men who have sex with men (MSM) bear the greatest burden of HIV infection in New Zealand, HIV prevalence remains low in this population.1 Anonymous unlinked seroprevalence studies in 1991–92 and 2005–06 revealed that 4.4% of MSM attending sexual health clinics were HIV-positive,1,2 a figure which is likely to overestimate HIV prevalence among all MSM, since this subgroup contains a high proportion of men presenting with a sexually transmissible infection (STI). Accordingly, fewer than 5% of MSM recruited at gay community venues and events in Auckland reported having received an HIV-positive diagnosis,3 and an analysis of national routine surveillance data estimated that diagnosed HIV prevalence was between 1.5% and 5% of MSM in 2009.4
These modest HIV prevalence estimates among MSM in a now mature epidemic are consistent with New Zealand having been one of the first countries in the world to record a decline in AIDS notifications.5 Notwithstanding this early success, there has recently been an increase in the number of new HIV diagnoses reported among MSM in this country,6 similar to that recorded in many industrialised nations.7–13
HIV transmission among MSM is not a random process. HIV is predominantly acquired through engagement in unprotected anal sex and spreads through networks of sexually connected individuals. If, over the long-term, the movement of HIV through a population is influenced by cycles of sexual network infiltration and partial saturation, and if the constituents of these networks can be described by their demographic characteristics, then any patterns in both the number and attributes of newly reported HIV diagnoses can help us to understand recent epidemic dynamics. These insights can then be used to better evaluate and target prevention resources, guide behavioural surveillance and inform other research activities.
This paper therefore characterises features of the New Zealand epidemic among MSM from 1996 to 2008 by examining data collected through enhanced routine surveillance of diagnosed HIV infection.14 First, trends in the overall number of new HIV diagnoses through western blot antibody testing among MSM will be described. Second, per capita HIV diagnosis rates will be calculated to compare the recent HIV epidemic experience among MSM in New Zealand and other countries where data are available. Third, the number of diagnosed HIV infections believed to have been acquired locally (in New Zealand) and those acquired overseas will be examined separately for trends over time, with a particular focus on the domestic epidemic and whether trends conform to identifiable phases. Fourth, the characteristics of MSM diagnosed with a locally acquired HIV infection will be examined using information collected through enhanced surveillance. This includes a description of the overall population of MSM diagnosed between 1996 and 2008, and, if distinct domestic epidemic phases can be identified, a comparison of MSM diagnosed between these periods. Finally, potential explanations for the overall increase in HIV diagnoses among MSM in New Zealand will be discussed, focussing on the key drivers of HIV spreading at a population level.
Methods
HIV is not a legally notifiable condition in New Zealand. Nevertheless, over the period considered, a small number of reference virus laboratories oversaw all HIV western blot antibody testing in this country, and these centres alerted the AIDS Epidemiology Group (AEG) at the Department of Preventive and Social Medicine, University of Otago, of each new positive test result using an anonymous code.
Until 1995, information was sought on likely mode of transmission, sex and age. Since 1996, a system of enhanced surveillance of HIV infection between the AEG, diagnosing physicians and the virus laboratories has collected more detailed information on the characteristics of people newly diagnosed.14 This includes additional data on likely place of infection (in New Zealand or overseas), ethnicity, region of residence, history of previous negative HIV tests and site of HIV test. From 2005, this has been extended further to include CD4+ counts. Although the system of enhanced surveillance of HIV infection is voluntary, as at the end of 2008, the AEG had collected information relating to 98.8% of all new diagnoses.
For ethnicity, the diagnosing clinician is asked to complete the ethnicity question used in the national census and to ask the patient about this. Multiple categories can be recorded, and where more than one is provided, the designated ethnicity is based on a hierarchical system (for example, New Zealand European and Maori is reported as ‘Maori’). For likely place of infection and previous negative test history, these were also based on the patients’ self-report. For new diagnoses via western blot antibody testing in which both MSM and injecting drug use (IDU) are a possible mode of transmission, these are reported separately as ‘MSM-IDU’.
Since 2001, the AEG has also regularly recorded information on new HIV cases identified through viral load testing.15 The majority of these relate to individuals for whom the original HIV-positive diagnosis through western blot antibody test was conducted overseas. As this paper focusses on the dynamics of local HIV transmission, and as regular collection of information on new cases identified through viral load testing was not initiated until well into the period being examined, these cases are not included in this analysis.
To provide an international context we express annual HIV diagnoses among the combined MSM and MSM-IDU cases as a rate per million males aged 15–64, using population estimates provided by Statistics New Zealand.16 These include all diagnoses through western blot antibody testing regardless of likely place of infection. Comparisons are limited to recently published rates from Australia, the USA and selected European countries.7,8
χ2-tests examined whether any proportional differences observed in the characteristics of locally acquired HIV diagnoses among MSM between epidemic phases were statistically significant; these were performed using Stata version 9 (StataCorp, College Station, TX, USA).
Results
Trends in the number of new HIV diagnoses
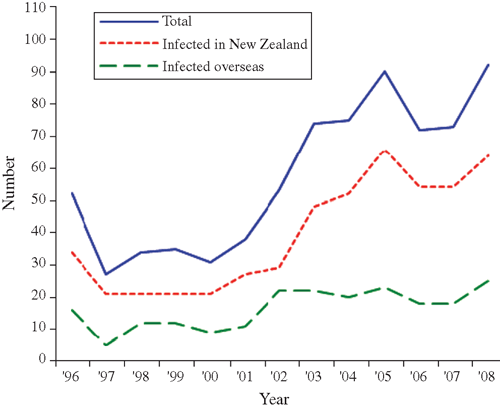
Overall, 746 new HIV diagnoses through western blot antibody testing were recorded among MSM between 1996 and 2008. These were low up to and including the year 2000, after which annual diagnoses increased (Fig. 1 and Table 1). The number of cases diagnosed in 2008 (n = 92) was the highest annual total since HIV antibody testing became available in New Zealand in 1985. Of the 746 new diagnoses among MSM, 21 (2.8%) had IDU as a possible mode of transmission recorded.
|

|
Consistent with previous analysis,14 enhanced surveillance data also confirm that male–male sex remains the dominant mode of transmission among all infections that were diagnosed and acquired in New Zealand. Seventy-six percent of the infections occurring in New Zealand over the period 1996–2000 were through sexual contact between men, rising slightly to 78% of all people infected in New Zealand over the period 2001–05. In 2008, this proportion had increased further (83%).
Annual rate of HIV diagnoses per million males
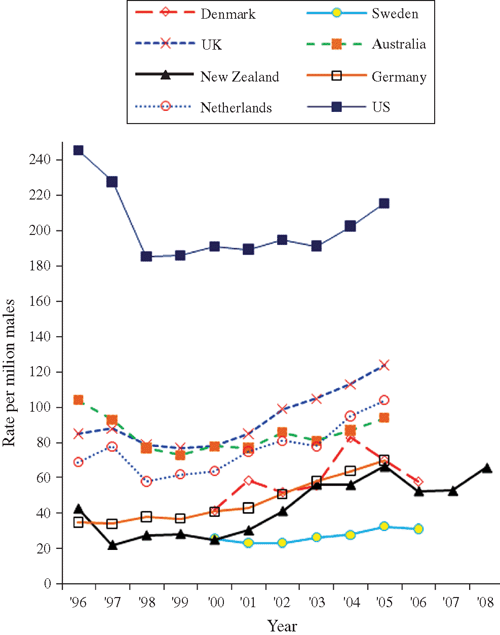
Fig. 2 expresses the overall annual number of HIV diagnoses among MSM (including MSM-IDU) as a rate per million males in New Zealand aged 15–64, and compares this to selected countries.7,8 The per capita HIV diagnosis rate in New Zealand ranged from 22.0 per million males aged 15–64 in 1997 to 66.7 per million in 2005. In all countries, the annual HIV diagnosis rate increased over time.7,8
|
Trends in locally and overseas acquired HIV infection
Between 1996 and 2008, over two-thirds (68.6%, n = 512) of new HIV diagnoses among MSM were believed to have been acquired in New Zealand, and over a quarter (28.6%, n = 213) in other countries (21 had an unknown place of infection) (Table 1).
Trends in the number of new HIV diagnoses by place of infection can be examined in the New Zealand surveillance data. Diagnoses of HIV acquired overseas among MSM were low until 2001 and then rose to a steady number of around 20 annual diagnoses from 2002 onwards. Diagnoses of locally acquired HIV infections were low between 1997 and 2000 when 21 annual diagnoses were recorded nationally, followed by a period of increasing locally acquired HIV diagnoses to a high of 66 in 2005, and remained elevated through to 2008 (Table 1 and Fig. 1). For the purpose of comparison, between 1996 and 2008, it is therefore possible to distinguish three general phases in locally acquired HIV diagnoses: a low phase between 1996 and 2000, a resurgent phase of equal length between 2001 and 2005, and a stable phase between 2006 and 2008.
Characteristics of locally-acquired HIV infection
Table 2 isolates HIV diagnoses among MSM where infection was believed to have been acquired in New Zealand and identifies the predominant characteristics of MSM diagnosed between 1996 and 2008. The majority of MSM were aged 30–39 (37.5%), lived in the Northern region (58.2%), were of New Zealand European ethnicity (74.8%) and had tested negative for HIV at least once before their positive diagnosis (52.2%).

|
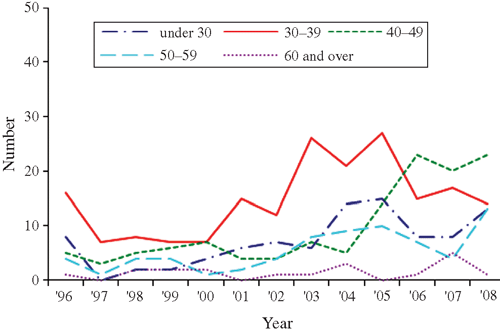
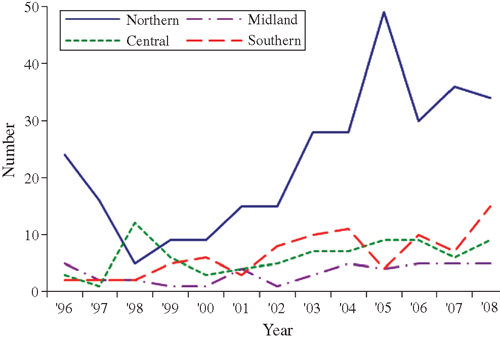
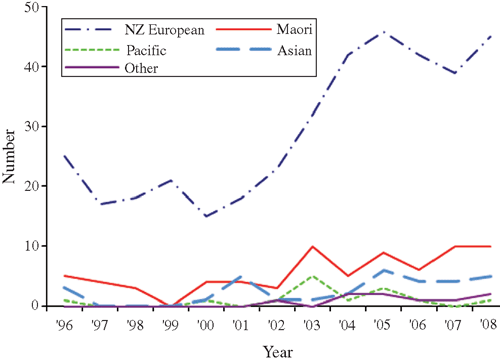
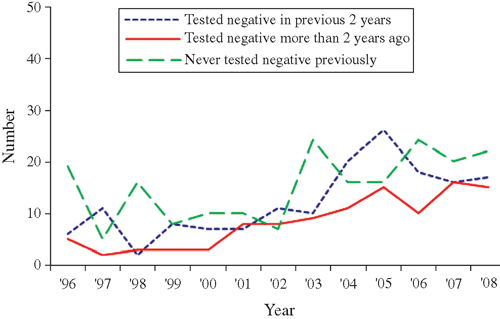
Changes in the pattern of locally acquired HIV diagnoses by age group, region of New Zealand, ethnicity and previous HIV-negative test history are illustrated in Figs 3–Figs 6. Table 2 also compares the characteristics of MSM diagnosed in the two periods of equal length: 1996–2000 and 2001–05, which correspond to the first two identifiable diagnosis phases. This enables a comparison of basic counts between the two periods, and the distribution of diagnoses according to case characteristics. The most recent period of 2006–08 is also included for comparison of proportions only.
|
|
|
|
From 1996–2000 to the equivalent period in 2001–2005, the number of locally acquired HIV diagnoses among MSM increased by 88% (118 HIV diagnoses in the low phase v. 222 HIV diagnoses in the resurgent phase) (Table 2). The increase in cases occurred among virtually all characteristics of MSM measured by the surveillance system. However, compared with MSM diagnosed during the low phase (1996–2000), individuals diagnosed in the resurgent phase from 2001 to 2005 were proportionately more likely to have tested HIV-negative in the 2 years before the HIV-positive diagnosis, to be aged 30–39, to live in the Northern region (encompassing the country’s largest city, Auckland, with a high concentration of gay men17), and were less likely to be a ‘European New Zealander’ (Table 2). These represent all western blot antibody cases reported to AEG; nevertheless, the numbers are small and the absence of statistically significant differences in age group, region of residence and ethnicity indicates that caution should be exercised when drawing conclusions from these comparisons.
In the most recent 3-year period leading up to 2008, MSM diagnosed during this phase exhibited broadly similar characteristics to MSM diagnosed in the preceding resurgent phase (2001–05). The main exception to this was age group at time of diagnosis (P < 0.001), which was by then most commonly MSM aged 40–49.
When comparing the characteristics of locally acquired HIV diagnoses in the low and resurgent phases, it is important to note that several groups of MSM moved from a position of being underrepresented to being represented as expected, given their distribution in the New Zealand population. This was most apparent for MSM of Pacific, Asian and ‘other’ ethnicities. Thus, although the number of diagnoses among MSM of Pacific, Asian and ‘other’ ethnicities increased between the two periods (n = 6 in 1996–2000, n = 30 in 2001–05), the rise in proportions (5.1% of all diagnoses in 1996–2000 to 13.5% in 2001–05) is most accurately characterised as a shift towards a more equal distribution across ethnic groups, given the ethnic profile of New Zealand men.16
Discussion
This paper describes several salient features of HIV diagnoses among MSM in New Zealand over the period 1996–2008. The overall number of new HIV diagnoses has risen markedly over this period. This was shown to be consistent with increased rates of new diagnoses per capita among MSM in several countries. Over two-thirds (68.6%) of new diagnoses were believed to have been acquired in New Zealand; trends in these exhibited three periods corresponding to a low phase in 1996–2000, a resurgent phase in 2001–05 and a stable phase in 2006–08.
The majority of locally acquired infections 1996–2008 occurred among MSM aged 30–39 who lived in Auckland, were of New Zealand European ethnicity and who had tested negative for HIV at least once before their positive diagnosis. MSM diagnosed in the domestic resurgent phase differed in their characteristics to MSM diagnosed in the earlier low phase. In particular, the higher number of MSM diagnosed in the resurgent phase (2001–05) who had recently received an HIV-negative test supports the contention that the rise in locally acquired HIV diagnoses represents recent patterns of domestic exposure rather than improved identification of long-standing prevalent infections.
A strength of this paper is the distinction drawn between locally acquired and overseas acquired HIV diagnoses. If trends in new HIV diagnoses reflect trends in HIV incidence, analysing surveillance data by place of infection can help us better understand patterns in domestic vulnerability and informs local prevention activities. The system of enhanced surveillance in New Zealand also appears to be robust, with information on 98.8% of all new diagnoses through western blot antibody testing during 1996–2008 being collected. The low proportion of missing information accompanying the surveillance data over this period has consequently meant that we did not have to impute MSM mode of transmission from cases where this was unknown.
A limitation of HIV surveillance data is that new HIV diagnoses provide a picture of past infection events, and comprise both recent incident and long-standing prevalent infections. Fluctuations in the annual number of new HIV diagnoses, as documented here, can also be caused by changing patterns in testing practices. Behavioural surveillance initiated among MSM in 2002 in Auckland – where the majority of newly diagnosed MSM resided – indicates that lifetime HIV testing rates have remained stable at around 70% between 2002 and 2006.3 Prior to this, the only available data for the period examined is from the cross-sectional study Project Male Call/Waea Mai, Tane Ma in 1996, which found a similar lifetime testing rate of 73.1% among Auckland respondents.18 However, further investigation of available HIV testing data in New Zealand is required to explore this possibility.
Potential drivers of the increase in new HIV infections
If the resurgence in HIV diagnoses among MSM in New Zealand reflects an actual increase in infections, and is not merely an artefact of testing practices, what are some potential explanations? Using the basic epidemic equation governing the reproductive rate of HIV (R0 = βcD, where β = the average per contact probability of transmission, c = the pattern of new sexual partner formation and D = the average duration of infectiousness),19,20 we can make some observations about these trends.
Foremost, vulnerability to HIV infection must have increased among these subpopulations of MSM in order for the growth in HIV infections to have disproportionately affected them. Vulnerability of groups, however, can be defined in several ways. Risk can increase if the average probability of transmission (parameter β) rises; for example, if these groups’ rate of condom use declines, if STI rates rise among them or if the average HIV viral load increases in this community relative to other groups. The latter could occur through a higher rate of undiagnosed HIV infection, or through a sudden spike in acute cases and, consequently, of individuals in the highly infectious primary stage of HIV infection, which itself increases the likelihood of secondary transmission.
Changes to the structure of sexual partnership formation (parameter c) can also increase vulnerability even if β remains fixed. Higher rates of sexual partner change, concurrency and changes in sexual contact patterns between different sexual activity classes will affect risk. For example, increasingly dissortative mixing between high and low HIV prevalence subgroups could plausibly increase transmission if these connections created new pathways for HIV to exploit. Alternatively, increasingly assortative mixing could further concentrate transmission within groups with an already high HIV prevalence.
During the resurgent diagnosis phase in New Zealand (2001–05), a possible catalyst for facilitating new forms of sexual partnering patterns was the growth in popularity of internet dating sites among MSM. Between 2002 and 2004, the proportion of MSM recruited in offline behavioural surveillance in Auckland who had engaged in sex with a man met on the internet in the preceding 6 months increased from 26.6% to 44.8%.3 For this to potentially affect HIV transmission, it requires only that the patterns of partner selection have reconfigured in transmission-inducing ways, and does not necessarily indicate that there has been an increase in the frequency of partnership formation.
Potentially one of the most profound influences on HIV transmission has been the decrease in AIDS-related mortality from highly active antiretroviral therapy and its effect on the HIV prevalence pool by increasing the duration of infectiousness (parameter D). The estimated number of MSM living with a diagnosed HIV infection in New Zealand accelerated from 2000, doubling between 1996 and 2005.4 If the expansion of the pool of undiagnosed HIV mirrored this trend, then even a stable rate of secondary transmission over time from total prevalent diagnosed and undiagnosed HIV cases will result in incrementally more annual HIV infection events, all other things being equal.21,22 Much will then depend on the relative contribution to annual HIV transmissions of individuals in different stages of HIV disease, and with diagnosed or undiagnosed infection.23–25
To better elucidate which factors help explain the increase in HIV diagnoses among MSM in New Zealand, further consideration should be given to disaggregated behavioural surveillance data on trends in condom use and HIV testing,3 repeat cross-sectional research on MSM living with diagnosed HIV,26 anonymous HIV seroprevalence studies1 and HIV prevention programs.27 Current gaps in research and surveillance that could shed light on drivers of the increase also need to be identified and prioritised, particularly research on sexual networks, STI surveillance for MSM and community HIV prevalence studies.
International comparison
The upward trend in HIV diagnoses parallels the increases in HIV notifications and HIV incidence among MSM reported in most industrialised countries.7–13 This suggests that the local epidemic surge is possibly driven by shared factors that are not unique to New Zealand. Even though the proportional rise in new cases has been high in New Zealand, over the period examined and where data were available, the rate of annual HIV diagnoses among MSM per million males was lower than that in the USA, the UK, Australia and the Netherlands, but appeared to be higher than the rate in Sweden.
Over a quarter of all new HIV diagnoses among MSM in New Zealand related to infections that were believed to have been acquired overseas, a figure which is higher than in the UK28 but lower than in Sweden.29 These differences could be explained by classification systems or differential population mobility, or could reflect the possibility that in lower HIV prevalence populations, uninfected risk-taking residents who travel overseas are more likely to become infected in destinations with a higher HIV prevalence. Differences between countries in this fraction will affect the interpretation of international comparisons, as will the (largely unknown) number of HIV infections acquired locally but diagnosed overseas and not recorded in the host nation’s surveillance system.
The overall proportion of total MSM cases that were MSM-IDU was small in New Zealand (2.8%); if there were large differences between countries in the contribution of MSM-IDU cases this would also influence comparisons and the interpretation of trends. Further consideration needs to be given to differences in HIV testing patterns between jurisdictions, which may create varying degrees of under-diagnosis. The completeness of each country’s HIV notification systems will affect the proportion of new HIV diagnoses that are known to arise from male–male sex as opposed to being imputed as such; in this respect, the New Zealand data presented here are of high quality.
Implications
The resurgent epidemic among MSM in New Zealand, coupled with the still relatively low annual diagnosis rate in international terms, has several implications.
The low prevalence of HIV (<5% among MSM) and the very low number of locally acquired HIV diagnoses between 1996 and 2000 means that New Zealand has a large proportion of HIV-negative MSM who are susceptible to infection. Compared with jurisdictions with broader epidemics among MSM, this may counterintuitively mean that HIV prevention programs in New Zealand must target the most vulnerable MSM even more vigorously in order to reduce incidence. This is because HIV infection is unlikely to have reached a high level of saturation among these subgroups and HIV transmission will therefore be more efficient if these networks are breached. MSM particularly at risk in this respect are likely to include those engaging in unprotected anal intercourse with multiple partners,30–33 especially those who do so in group sex contexts,34 and MSM with an STI.35
At the same time, since data are lacking on patterns of assortativity and dissortativity among MSM in New Zealand – which would help quantify the degree of sexual mixing between individuals with and without these characteristics – the promotion of ‘universal precautions’ through condom use should remain a high priority. This paper has provided information on the MSM who have been most represented in new locally acquired HIV diagnoses, and this should also be used to guide prevention decisions.
Epidemiological data can help evaluate the success or limitations of past prevention efforts.36 In this respect, the rise in HIV diagnoses in 2001–05 and the elevated plateau in 2006–08, need to be interpreted in the context of coincident increases in HIV diagnoses among MSM communities throughout the world,7–13 factors such as highly active antiretroviral therapy,12,37 internet dating12,37 and the previously low penetration of HIV into New Zealand MSM communities described above.
In the first decade of the epidemic, features of the New Zealand experience included an epidemic that developed later than in North America, Europe and Australia,38–40 an early community-led and scientifically-based response,41–44 law reform and health promotion that removed impediments to the delivery of effective HIV prevention and care,45,46 and a sustained bipartisan approach to HIV epidemic management between the government sector and community organisations.47
These initial factors are likely to have helped shape the second decade and beyond. An important question now is to discover which qualities have characterised the New Zealand response to the HIV epidemic among MSM after 1996. This may have consisted of a unique configuration of features, including the ability to foresee emerging threats due to geographic isolation and the opportunity to act early, a small population and issues of scale and coordination, a consistent emphasis on condom promotion, a relatively liberal society and a progressive human rights framework. These experiences need to be described fully and formally to inform our understanding of the more recent epidemic outcomes, as has been done for neighbouring countries such as Australia.48 There is also a dearth of existing studies on HIV and MSM in New Zealand, and more investment in research and analysis is warranted if past successes are to be maintained.
Conflicts of interest
None declared.
Acknowledgements
The AIDS Epidemiology Group at the University of Otago Medical School and the Research Unit at the New Zealand AIDS Foundation are funded by the Ministry of Health. PS undertook the majority of this work while in receipt of a PhD scholarship from the Faculty of Health Sciences, University of Otago. PS conceived the idea for the paper, took primary responsibility for the analysis and wrote the first draft; ND initiated the comparative analysis of per capita diagnosis rates, SM extracted the surveillance data, KS provided statistical advice and AH assisted with data interpretation. All authors contributed to the manuscript. The authors would like to thank Giedrius Likatavicius, HIV/AIDS Surveillance Unit, European Centre for Disease Prevention and Control, Stockholm, and Associate Professor Patrick Sullivan, Rollins School of Public Health, Emory University, Atlanta for generously sharing their study data.
References
[1] McAllister SM, Dickson NP, Sharples K, Reid MR, Morgan JM, Macdonald EJ, et al Unlinked anonymous HIV prevalence among New Zealand sexual health clinic attenders: 2005–2006. Int J STD AIDS 2008; 19 752–7.| Unlinked anonymous HIV prevalence among New Zealand sexual health clinic attenders: 2005–2006.Crossref | GoogleScholarGoogle Scholar | 1:STN:280:DC%2BD1cnnt1yltw%3D%3D&md5=0fff48cbcd6d454a5a5abb93997177ebCAS |
[2] Dickson NP, Paul C, Skegg DC, Sharples KJ, Lyttle PH, Say PJ, et al Unlinked anonymous monitoring of HIV prevalence at sexually transmitted disease clinics. N Z Med J 1993; 106 325–7.
| 1:STN:280:DyaK3szktFOqsw%3D%3D&md5=ba051e69b2d7509b3d11e199d36068e6CAS |
[3] Saxton P, Dickson N, Hughes A. GAPSS 2006: findings from the 2006 Gay Auckland Periodic Sex Survey. Auckland: New Zealand AIDS Foundation; 2006.
[4] Saxton P, Dickson N, McAllister S, Hughes A, Sharples K. Trends in HIV prevalence among homosexual men in New Zealand 1985–2009 [abstract 252]. 22nd Annual Conference of the Australasian Society for HIV Medicine (ASHM); October 20–22 2010; Sydney, Australia.
[5] Sharples K, Dickson NP, Paul C, Skegg DCG. HIV/AIDS in New Zealand: an epidemic in decline? AIDS 1996; 10 1273–8.
| HIV/AIDS in New Zealand: an epidemic in decline?Crossref | GoogleScholarGoogle Scholar | 1:STN:280:DyaK2s%2Fjsl2lsA%3D%3D&md5=5cead384adb798a00a8b6d388a100f11CAS |
[6] AIDS Epidemiology Group. AIDS – New Zealand. University of Otago, Dunedin; 2009. Available online at: http://dnmeds.otago.ac.nz/departments/psm/research/aids/pdf/63 AIDS-NZ March 2009.pdf [verified November 2010].
[7] Likatavicius G, Klavs I, Devaux I, Alix J, Nardone A. An increase in newly diagnosed HIV cases reported among men who have sex with men in Europe, 2000–6: implications for a European public health strategy. Sex Transm Infect 2008; 84 499–505.
| An increase in newly diagnosed HIV cases reported among men who have sex with men in Europe, 2000–6: implications for a European public health strategy.Crossref | GoogleScholarGoogle Scholar | 1:STN:280:DC%2BD1cjmtFCitg%3D%3D&md5=0018686838151c2898c59912980dca0aCAS |
[8] Sullivan PS, Hamouda O, Delpech V, Geduld JE, Prejean J, Semaille C, et al Reemergence of the HIV epidemic among men who have sex with men in North America, Western Europe, and Australia, 1996–2005. Ann Epidemiol 2009; 19 423–31.
| Reemergence of the HIV epidemic among men who have sex with men in North America, Western Europe, and Australia, 1996–2005.Crossref | GoogleScholarGoogle Scholar |
[9] Grulich AE, Kaldor JM. Trends in HIV incidence in homosexual men in developed countries. Sex Health 2008; 5 113–8.
| Trends in HIV incidence in homosexual men in developed countries.Crossref | GoogleScholarGoogle Scholar |
[10] Guy RJ, McDonald AM, Bartlett MJ, Murray JC, Giele CM, Davey TM, et al Characteristics of HIV diagnoses in Australia, 1993–2006. Sex Health 2008; 5 91–6.
| Characteristics of HIV diagnoses in Australia, 1993–2006.Crossref | GoogleScholarGoogle Scholar |
[11] Hall HI, Song R, Rhodes P, Prejean J, An Q, Lee LM, et al Estimation of HIV incidence in the United States. JAMA 2008; 300 520–9.
| Estimation of HIV incidence in the United States.Crossref | GoogleScholarGoogle Scholar | 1:CAS:528:DC%2BD1cXps1ygtrY%3D&md5=b6e75dc419f0e499ee16005080f97c32CAS |
[12] Stall R, Hart G. The continuing evolution of research on sexually transmitted infections among men who have sex with men. Sex Transm Infect 2008; 84 407–9.
| The continuing evolution of research on sexually transmitted infections among men who have sex with men.Crossref | GoogleScholarGoogle Scholar |
[13] van Griensven F, de Lind van Wijngaarden JW, Baral S, Grulich A. The global epidemic of HIV infection among men who have sex with men. Curr Opin HIV AIDS 2009; 4 300–7.
| The global epidemic of HIV infection among men who have sex with men.Crossref | GoogleScholarGoogle Scholar |
[14] Paul C, Wilson M, Dickson N, Sharples K, Skegg DC. Enhanced surveillance of HIV infections in New Zealand, 1996–1998. N Z Med J 2000; 113 390–4.
| 1:STN:280:DC%2BD3crhtVehtg%3D%3D&md5=2ddf96b33fab73b458bab13e4f160054CAS |
[15] AIDS Epidemiology Group. AIDS – New Zealand. University of Otago, Dunedin; 2002. Available online at: http://dnmeds.otago.ac.nz/departments/psm/research/aids/pdf/49 AIDS-NZ February 2002.pdf [verified November 2010].
[16] Statistics New Zealand. National population estimates, mean year ended 31 December. Wellington: Statistics New Zealand; 2006. Available online at: www.stats.govt.nz/methods_and_services/access-data/tables/national-pop-estimates.aspx [verified August 2009].
[17] Hughes A, Saxton P. Geographic micro-clustering of homosexual men: implications for research and social policy. Soc Pol J New Zealand 2006; 28 158–78.
[18] Saxton P, Hughes A, Segedin R, Robinson E, Aspin C. Male Call/Waea Mai, Tane Ma report Six: Regions. Auckland: New Zealand AIDS Foundation; 1998.
[19] Anderson RM, May RM. Infectious diseases of humans: dynamics and control. Oxford: Oxford University Press; 1992.
[20] May RM, Gupta S, McLean AR. Infectious disease dynamics: what characterizes a successful invader? Philos Trans R Soc Lond B Biol Sci 2001; 356 901–10.
| Infectious disease dynamics: what characterizes a successful invader?Crossref | GoogleScholarGoogle Scholar | 1:STN:280:DC%2BD3MzktlCqsw%3D%3D&md5=5dbafeb35d53109227c0ca9151637a8fCAS |
[21] Ginige S, Chen MY, Hocking JS, Grulich AE, Fairley CK. Rising HIV notifications in Australia: accounting for the increase in people living with HIV and implications for the HIV transmission rate. Sex Health 2007; 4 31–3.
| Rising HIV notifications in Australia: accounting for the increase in people living with HIV and implications for the HIV transmission rate.Crossref | GoogleScholarGoogle Scholar |
[22] White PJ, Ward H, Garnett GP. Is HIV out of control in the UK? An example of analysing patterns of HIV spreading using incidence-to-prevalence ratios. AIDS 2006; 20 1898–901.
| Is HIV out of control in the UK? An example of analysing patterns of HIV spreading using incidence-to-prevalence ratios.Crossref | GoogleScholarGoogle Scholar |
[23] Marks G, Crepaz N, Janssen RS. Estimating sexual transmission of HIV from persons aware and unaware that they are infected with the virus in the USA. AIDS 2006; 20 1447–50.
| Estimating sexual transmission of HIV from persons aware and unaware that they are infected with the virus in the USA.Crossref | GoogleScholarGoogle Scholar |
[24] Pinkerton SD. How many sexually-acquired HIV infections in the USA are due to acute-phase HIV transmission? AIDS 2007; 21 1625–9.
| How many sexually-acquired HIV infections in the USA are due to acute-phase HIV transmission?Crossref | GoogleScholarGoogle Scholar |
[25] Wilson DP, Hoare A, Regan DG, Law MG. Importance of promoting HIV testing for preventing secondary transmissions: modelling the Australian HIV epidemic among men who have sex with men. Sex Health 2009; 6 19–33.
| Importance of promoting HIV testing for preventing secondary transmissions: modelling the Australian HIV epidemic among men who have sex with men.Crossref | GoogleScholarGoogle Scholar |
[26] Grierson J, Thorpe R, Pitts M, Hughes T, Saxton P, Smith J, et al. HIV Futures New Zealand 2 [Mate āraikore a muri ake nei (Tuarua)]. Monograph Series Number 66. Melbourne: Australian Research Centre in Sex, Health and Society, La Trobe University; 2008.
[27] Dickson N, Davidson O. HIV prevention in New Zealand – still room for improvement. N Z Med J 2006; 119 1243
[28] Health Protection Agency. Sexually transmitted infections and men who have sex with men in the UK: 2008 report. London: Health Protection Agency; 2009.
[29] Arneborn A, Blaxhuit A. Increase of reported HIV infections in Sweden. Eurosurveill 2007; 12 3214
[30] Koblin BA, Husnik MJ, Colfax G, Huang Y, Madison M, Mayer K, et al Risk factors for HIV infection among men who have sex with men. AIDS 2006; 20 731–9.
| Risk factors for HIV infection among men who have sex with men.Crossref | GoogleScholarGoogle Scholar |
[31] Volk JE, Prestage G, Jin F, Kaldor J, Ellard J, Kippax S, et al Risk factors for HIV seroconversion in homosexual men in Australia. Sex Health 2006; 3 45–51.
| Risk factors for HIV seroconversion in homosexual men in Australia.Crossref | GoogleScholarGoogle Scholar |
[32] Read TR, Hocking J, Sinnott V, Hellard M. Risk factors for incident HIV infection in men having sex with men: a case-control study. Sex Health 2007; 4 35–9.
| Risk factors for incident HIV infection in men having sex with men: a case-control study.Crossref | GoogleScholarGoogle Scholar |
[33] Macdonald N, Elam G, Hickson F, Imrie J, McGarrigle CA, Fenton KA, et al Factors associated with HIV seroconversion in gay men in England at the start of the 21st century. Sex Transm Infect 2008; 84 8–13.
| Factors associated with HIV seroconversion in gay men in England at the start of the 21st century.Crossref | GoogleScholarGoogle Scholar | 1:STN:280:DC%2BD1c%2FlsFKqsg%3D%3D&md5=4ffe149c67f2c57ff4e09cf69d870898CAS |
[34] Prestage GP, Hudson J, Down I, Bradley J, Corrigan N, Hurley M, et al Gay men who engage in group sex are at increased risk of HIV infection and onward transmission. AIDS Behav 2009; 13 724–30.
| Gay men who engage in group sex are at increased risk of HIV infection and onward transmission.Crossref | GoogleScholarGoogle Scholar |
[35] Williamson LM, Dodds JP, Mercey DE, Hart GJ, Johnson AM. Sexual risk behaviour and knowledge of HIV status among community samples of gay men in the UK. AIDS 2008; 22 1063–70.
| Sexual risk behaviour and knowledge of HIV status among community samples of gay men in the UK.Crossref | GoogleScholarGoogle Scholar |
[36] Rehle T, Lazzari S, Dallabetta G, Asamoah-Odei E. Second-generation HIV surveillance: better data for decision-making. Bull World Health Organ 2004; 82 121–7.
[37] Elford J. Changing patterns of sexual behaviour in the era of highly active antiretroviral therapy. Curr Opin Infect Dis 2006; 19 26–32.
| Changing patterns of sexual behaviour in the era of highly active antiretroviral therapy.Crossref | GoogleScholarGoogle Scholar |
[38] Romeril KR. Acute HTLV III infection. N Z Med J 1985; 98 401
| 1:STN:280:DyaL2M7ovFSrsA%3D%3D&md5=543f134176d792f8dd45c92c1013fdc6CAS |
[39] Fraser AG, Henley JW, Ellis-Pegler RB, Benjamin CS, Childs WJ, Harvey VJ. The acquired immunodeficiency syndrome in Auckland in 1985. N Z Med J 1986; 99 485–8.
| 1:STN:280:DyaL283osFyhtw%3D%3D&md5=14977398eac42aa55e5634c4b377a06eCAS |
[40] Carlson RV, Skegg DC, Paul C, Spears GF. Occurrence of AIDS in New Zealand: the first seven years. N Z Med J 1991; 104 131–4.
| 1:STN:280:DyaK3M7oslejsQ%3D%3D&md5=f7a440c6e018fc9043854794c14908fbCAS |
[41] Parkinson P, Hughes T. The gay community and the response to AIDS in New Zealand. N Z Med J 1987; 100 77–9.
| 1:STN:280:DyaL2s7ksFelsw%3D%3D&md5=f9c5c609cadfc44a192727cc6d4a7624CAS |
[42] Crofts N, Ballard J, Chetwynd J, Dickson N, Lindberg W, Watson C. Involving the communities: AIDS in Australia and New Zealand. AIDS 1994; 8 S45–53.
[43] Davis P, Lichtenstein B. AIDS, sexuality and the social order in New Zealand. In: Davis P, editor. Intimate details and vital statistics: AIDS, sexuality and the social order in New Zealand. Auckland: Auckland University Press; 1996. pp. 1–10.
[44] Lindberg W, McMorland J. ‘From grassroots to business suits’: the gay community response to AIDS. In: Davis P, editor. Intimate details and vital statistics: AIDS, sexuality and the social order in New Zealand. Auckland: Auckland University Press; 1996. pp. 102–119.
[45] Plumridge E, Chetwynd J. AIDS policy response in New Zealand: consensus in crisis. Health Care Anal 1994; 2 287–95.
| AIDS policy response in New Zealand: consensus in crisis.Crossref | GoogleScholarGoogle Scholar | 1:STN:280:DyaK2M7ivVGjsw%3D%3D&md5=19019321e9354ba2fa7fd027714b9f06CAS |
[46] Lichtenstein B. Tradition and experiment in New Zealand AIDS policy. AIDS Public Policy J 1997; 12 79–88.
| 1:STN:280:DC%2BD3cvhvFGnuw%3D%3D&md5=7b0ea53b13c5956d33c6525e34debac2CAS |
[47] Davis P, Lichtenstein B. A viable partnership? In: Davis P, editor. Intimate details and vital statistics: AIDS, sexuality and the social order in New Zealand. Auckland: Auckland University Press; 1996. pp. 221–227.
[48] Fairley C, Grulich AE, Imrie JC, Pitts M. Investment in HIV prevention works: a natural experiment. Sex Health 2008; 5 207–10.
| Investment in HIV prevention works: a natural experiment.Crossref | GoogleScholarGoogle Scholar |


