

Probabilistic prediction of wildfire economic losses to housing in Cyprus using Bayesian network analysis
P. Papakosta A C , G. Xanthopoulos B and D. Straub AA Engineering Risk Analysis Group, Technische Universitaet München, Theresienstrasse 90, 80333, Munich, Germany.
B Hellenic Agricultural Organisation ‘Demeter’, Institute of Mediterranean Forest Ecosystems, Terma Alkmanos, 11528, Athens, Greece.
C Corresponding author. Email: patty.papakosta@gmail.com
International Journal of Wildland Fire 26(1) 10-23 https://doi.org/10.1071/WF15113
Submitted: 10 June 2015 Accepted: 13 October 2016 Published: 11 January 2017
Journal Compilation © IAWF 2017 Open Access CC BY-NC-ND
Abstract
Loss prediction models are an important part of wildfire risk assessment, but have received only limited attention in the scientific literature. Such models can support decision-making on preventive measures targeting fuels or potential ignition sources, on fire suppression, on mitigation of consequences and on effective allocation of funds. This paper presents a probabilistic model for predicting wildfire housing loss at the mesoscale (1 km2) using Bayesian network (BN) analysis. The BN enables the construction of an integrated model based on causal relationships among the influencing parameters jointly with the associated uncertainties. Input data and models are gathered from literature and expert knowledge to overcome the lack of housing loss data in the study area. Numerical investigations are carried out with spatiotemporal datasets for the Mediterranean island of Cyprus. The BN is coupled with a geographic information system (GIS) and the resulting estimated house damages for a given fire hazard are shown in maps. The BN model can be attached to a wildfire hazard model to determine wildfire risk in a spatially explicit manner. The developed model is specific to areas with house characteristics similar to those found in Cyprus, but the general methodology is transferable to any other area, as well as other damages.
Additional keywords: loss prediction, Mediterranean, vulnerability.
Introduction
Wildfire risk prediction is an important tool for fire management planning because it can justify and guide fire risk-management measures, including preventive measures targeting fuels (e.g. thinning, pruning, mechanical treatments, prescribed burning) (Ager et al. 2010) or elimination of potential ignition sources (e.g. activities of the public), fire suppression (e.g. firefighting crew allocation) and mitigation of consequences (e.g. property insurance, education of citizens to make their homes fire resistant). Wildfire risk is commonly defined as the expected net value loss in a particular geographic area and time period (Finney 2005). In recent years, significant effort has been devoted to fire risk analysis across wildlands, leading to methodological advances and the development of advanced tools (Finney 2006; Miller and Ager 2013).
In most forest landscapes, the highest wildfire risks are associated with houses damaged by forest fires. Therefore, the development of a method for assessing housing losses is an important step towards improved decision support for authorities and private owners. Significant research efforts are devoted to improved prediction of housing losses due to wildfires. Studies focus on the analysis of past house losses, either concentrating on the documentation of the events (Lynch 2004; Xanthopoulos 2008) or providing in-depth analysis and discussion (Gibbons et al. 2012; Syphard et al. 2012). Other studies use spatial simulation of fires (Ager et al. 2010; Salis et al. 2013; Mitsopoulos et al. 2015; Platanianaki et al. 2015). Only few studies compare model predictions with real-world data (Cohen 2000, 2004).
In general, it has been found that house losses due to wildfires are mainly influenced by fire characteristics (fire intensity, spread rate, burning ember density), by house location, surroundings (defensible space, distance from forest, fuel accumulation), design and construction materials, and by fire suppression effectiveness. The fire impact may be at various intensity levels and may include convective heating or direct contact of the flames, radiant heat flux from nearby flames and airborne firebrands (Cohen 2000; Koo et al. 2010; Mell et al. 2010). Focusing on the effect of meteorology on fire characteristics, Blanchi et al. (2010) analysed the relationship between house loss and the fire weather under which it occurred and found that virtually all of the losses occurred under extreme conditions. Harris et al. (2012) considered a measure of the power of the fire (PWR), calculated as the product of Byram’s fireline intensity (Byram 1959) and a portion of the length of the fire perimeter, and showed the existence of a strong relationship between community loss and PWR. Gibbons et al. (2012) examined the effectiveness of fuel management on decreasing house losses and found that all fuel treatments were more effective when undertaken closer to houses.
The vulnerability of a house is usually determined by its weakest point (Xanthopoulos 2004). In most cases, houses either survive a fire or are totally destroyed; partial damage is less common (Blong 2003). Structure flammability depends on exterior construction materials (e.g. roof type and roof material influence the ignition by firebrands (Koo et al. 2010; Gibbons et al. 2012)) and construction design (e.g. number, size and characteristics of openings). The most fire-resistant roofing materials that also remain effective under severe fire exposure are metal, clay tile and asphalt shingles (Forest Service British Columbia (FSBC) 2003). In addition, houses are not only a loss potential, but also serve as potential fuels (Cohen 2000). Therefore, building density is also included in studies of house losses due to wildfires (Gibbons et al. 2012; Syphard et al. 2012). However, for areas where houses are built with less flammable materials than those in Northern America and Australia, such as the Mediterranean region, this may be less relevant (Xanthopoulos et al. 2012). Poor firefighter access may explain why housing clusters with fewer roads are more vulnerable (Butler and Cohen 1998). Finally, there is significant variability in behaviour under fire even for houses with the same characteristics. Occasionally, houses with low ignitability can be destroyed even during low-intensity fire events, whereas houses with high ignitability can sometimes survive high-intensity fires (Cohen 2000).
Despite the insights into wildfire-related housing loss that are provided by these studies, there is currently no broadly accepted generalised predictive model that would allow performing cost assessments at sites other that the ones for which studies have been carried out. Reports on community wildfire protection plans use damage rating systems to assess consequences (Ohlson et al. 2003; Oregon Forestry Department (OFD) 2004; ECONorthwest 2007). Rating systems are also often used to evaluate the vulnerability of items at risk on the basis of expert knowledge (Tutsch et al. 2010; Penman et al. 2013).
The interdisciplinary domain knowledge needed to predict house loss requires model frameworks that can account for the interdependencies among the processes involved. Bayesian networks (BNs) are well suited to combine interdisciplinary models (Straub and Der Kiureghian 2010). They combine expert knowledge with quantitative models and data and can be modified when additional information is available. For these reasons, BNs are an ideal modelling framework for a quantitative system for the assessment of the consequences of a natural hazard. For example, they have been used in assessing volcano hazards (Aspinall et al. 2003), rock-fall hazards (Straub 2005), seismic hazards (Bayraktarli et al. 2005; Li et al. 2012; Bensi et al. 2014), avalanches (Grêt-Regamey and Straub 2006), floods (Vogel et al. 2013), tsunamis (Blaser et al. 2009) and landslides (Song et al. 2012). Applications of BNs to wildfires include the prediction and assessment of wildfire occurrence and burn severity (Dlamini 2010; Sunderman and Weisberg 2012; Papakosta et al. 2013; Zwirglmaier et al. 2013), wildfire spread (Dahmani and Hamri 2011), effectiveness of wildfire management measures such as fuel treatment and fire suppression (Penman et al. 2011, 2014), ecological consequences of wildfires (Howes et al. 2010), risk of human fatality from fires in buildings (Hanea and Ale 2009), fire spread in buildings (Cheng and Hadjisophocleous 2009) and wildfire causes (Biedermann et al. 2005).
In the present study, we propose a methodology to quantify economic loss to housing at a resolution of 1 km2. This methodology accounts for the lack of data and the variability among data types and sources, and facilitates incorporation of expert knowledge. It is based on a BN model that includes variables expressing hazard characteristics, houses at risk and their susceptibility, and fire suppression.
As a case study, the proposed BN is applied to Cyprus. The parameters of the model (initial probability distributions) are developed with both data and expert knowledge. Past wildfire disaster events in Cyprus from the period 2006–10 are chosen to demonstrate the model’s ability to predict housing economic loss (in €). For given hazard characteristics, the information is propagated through the Bayesian network and the model predicts expected housing economic loss (HEL). We examine the influence of the model parameters (including fire management options) on HEL. The BN is coupled with a geographic information system (GIS) and maps of expected economic losses for given wildfires are provided to illustrate the results. The predictions are compared with the damages registered in the NatCatSERVic.E database (https://www.munichre.com/de/reinsurance/business/non-life/natcatservice/index.html, accessed 14 November 2016) of the reinsurance company Munich Re. The model presented can potentially be transferred to other regions with similar hazard and house characteristics.
Methodology
Study area
The parameters of the proposed BN model are learnt for the Mediterranean island of Cyprus. The study area covers 5285 km2. The state forests of Cyprus are made up of the following plant communities: Pinus brutia (accounting for more than 80% coverage), Pinus nigra, mixed Pinus brutia–nigra, Cedrus brevifolia, mixed Cedrus brevifolia–Pinus brutia, Quercus alnifolia, mixed Pinus brutia–Quercus alnifolia, Eucalyptus spp. and riverine communities. The private forests in Cyprus in addition to Pinus brutia also include stands of Cupressus sempervirens, Ceratonia siliqua, Olea europaea, Juniperus phoenicia and Quercus infectoria. Furthermore, there is significant coverage of maquis and garrigue vegetation, which is found mainly on private land (Department of Forests, Ministry of Agriculture, Cyprus, http://www.moa.gov.cy, accessed 16 November 2016).
The topography of the island is dominated by the densely forested Troodos Range with Mount Olympus at 1953 m being its highest peak; to its north lies the central Messaoria plain while many coastal valleys surround it along the southern coast.
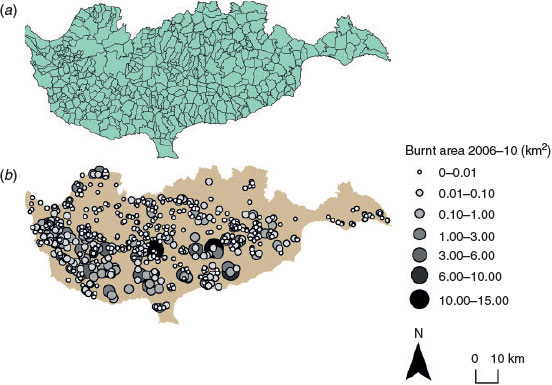
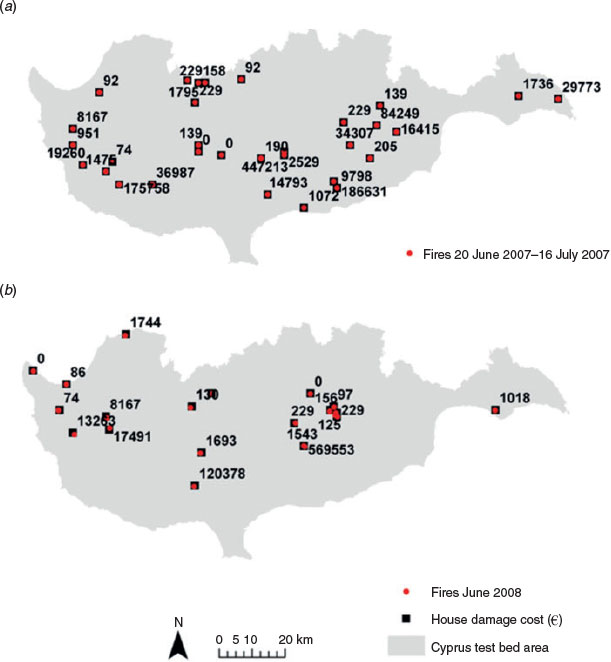
Owing to its Mediterranean climate, Cyprus is prone to fires. In the 2006–10 period, the annual mean occurrence rate of fires was 5.5 × 10⁻⁵ fires day–1 km–2 and the average total burnt area was 21 km2 year–1 (Papakosta and Straub 2015). Fires of all sizes were recorded, with 10% of recorded fires being less than 0.01 ha (100 m2). The total number of recorded fires in 2006–10 was 616, which corresponds to a mean annual number of fire occurrences of 123 (Fig. 1). The mean burnt area of the fires is 0.17 km2 and the standard deviation is 0.92 km2. The maximum burnt area recorded in 2006–10 was 13.62 km2 (Papakosta 2015).
|
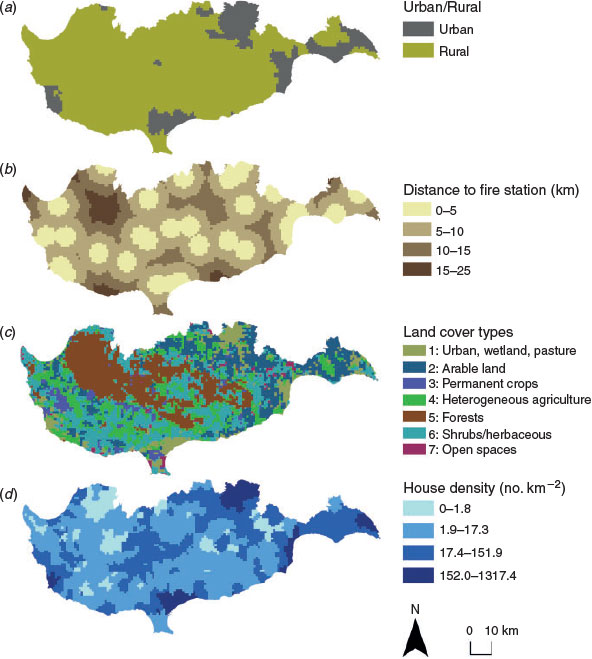
Besides human safety, the main assets at risk on Cyprus are buildings, protected natural habitats and agricultural areas (Fig. 2).
|
Risk assessment framework
In risk assessment for natural hazards, varying conventions are applied, and the terminology is not unified even within the forestry world (Hardy 2005). We therefore briefly summarise the concept and terminology of risk as used in the current paper.
In many areas of natural hazard risk assessment, it is common to express risk as a function of hazard, vulnerability and exposure; the latter is also known as value at risk, and characterises the damage potential. Vulnerability describes the response of the affected system to the hazard, e.g. the probability of a house being destroyed by a specific fire. This framework dates back to 1980 (Office of the United Nations Disaster Relief Co-ordinator (UNDRO) 1980) and is commonly used in earthquake (Carreño et al. 2007), flood (Kron 2002) or landslide (Guzzetti et al. 2005) risk assessments; it has also been adopted by the International Panel on Climate Change (IPCC) (Cardona et al. 2012).
The hazard  describes the hazard process in probabilistic terms, e.g. by means of occurrence probabilities for different types and magnitudes of events. Therefore, fire hazard in this study refers to both the occurrence and intensity of the phenomenon. This is similar to Scott (2006), who characterised wildfire hazard with burn probability, fireline intensity and a composite index. It is, however, in disagreement with the common approach of tying hazard only to the contribution of the forest fuels to fire danger (Hardy 2005; Miller and Ager 2013).
In spite of these differences, it is commonly agreed that risk is the expectation of losses (UNDRO 1980; Finney 2005). Using the above definitions, the risk to an asset (or resource)  is mathematically expressed as
wherein  is the probability (density) of a particular wildfire hazard event.
  is the vulnerability of asset
  , which describes the probability of damage
  conditional on a hazard event
  .
.  is the economic loss associated with the hazard and the damage scenario, it is a measure of exposure.
Wildfire risk has previously been defined as (Finney 2005; Miller and Ager 2013):
where  is the probability of a fire at intensity level
  and
and  is the response function of resource
  as a function of fire intensity level
  (Miller and Ager 2013).
  corresponds to
  , with the difference that the hazard (a fire at a specific intensity level) is modelled by a discrete number of scenarios; hence the integral in Eqn 1a is replaced by the summation. The inner integral in Eqn 1a corresponds to the response function:
This integral considers that a fire with a given intensity level  can lead to different responses, depending on which damages
  occur. In this study, this response function is developed for damage to housing.
Consequences can be classified based on their ability to be measured by market values as either tangible (e.g. house damage) or intangible (e.g. cultural heritage losses). Consequences can furthermore be classified according to whether they are direct (e.g. house damage) or indirect (e.g. erosion on slopes following the destruction of a stabilising forest). Tangible direct damages can be measured by the costs of repairing or replacing damaged assets, whereas intangible direct damages may often be measured in terms of number of affected items (Paul 2011).
In order to quantify consequences, vulnerability and exposure indicators are identified, which are related to the degree of loss and the items at risk by means of a BN model. Selecting the appropriate indicators is crucial for an accurate assessment of vulnerability and exposure. Indicators should be relevant, measurable, easy to interpret, and analytically and statistically sound (Birkmann 2006).
Bayesian networks
BNs are directed acyclic graphs and consist of nodes, arcs and probability tables attached to the nodes (Jensen and Nielsen 2007). In a discrete BN considered here, each node represents a discrete random variable whose sample space consists of a finite set of mutually exclusive states. The arcs describe the dependence structure among the random variables.
A conditional probability table (CPT) is attached to each of the nodes, defining the probability distribution of the random variable conditional on its parents. The full (joint) probabilistic model of the random variables  in the BN is the joint probability mass function (PMF),
  . By making use of the independence assumptions encoded in the graphical structure of the BN, this joint PMF is equal to the product of the conditional probabilities (Kjaerulff and Madsen 2013):
wherein  are realisations of the parents of
  . Eqn 3 states that the joint PMF of all random variables in the BN is simply the product of the conditional PMFs of each individual random variable given its parents. Therefore, the graphical structure of the BN and the conditional PMFs
  specify the full probabilistic model of
  .
.
Inference in BNs is performed by computing the conditional probabilities of selected variables given the available data on other variables. Efficient algorithms for performing these computations are implemented in software such as GeNIe (http://genie.sis.pitt.edu/, accessed 14 November 2016) or HUGIN (http://www.hugin.com/, accessed 14 November 2016). The latter is employed in this study. However, in the context of wildfire consequence assessments, the advantage of the BN is not its computational effectiveness but that it facilitates the combination of information from various sources into a single model.
We propose the BN model of Fig. 3 for assessing consequences to houses caused by wildfires. Houses are defined here as separate households contained within a multi-unit apartment building (dwelling unit) (Statistical Service 2010). The BN structure is based on phenomenological reasoning, the authors’ experiences and existing models, such as a fire-containment model. The present version of the model reflects the availability of data that can be used for defining and learning the model parameters, and may be modified if additional data become available. Table 1 summarises the definitions of the variables and the corresponding data sources. We remind the reader that the spatial resolution of the model is 1 km2, which is of relevance for the definition of the variables.

|

|
The BN includes variables that correspond to (1) hazard, (2) exposure, (3) vulnerability and (4) costs (Fig. 3). Connecting arcs show the causal relationships among the variables. The BN models the probabilistic relation between the hazard  , damage
  and cost
  , to compute the response function to a given wildfire hazard following Eqn 3. The BN thereby automatically performs the integration (or summation) over the possible damage states,
  .
.
(1) Wildfire hazard  is characterised by the variables Fire type, Burnt area and the Fire Weather Index (FWI) of the Canadian Forest Fire Weather Index System, a numeric rating of fire intensity, used as a general index of fire danger as influenced by weather conditions (Lawson and Armitage 2008). In the BN applied here, FWI influences only the result of suppression effectiveness. No link of FWI to the Burnt area and the Fire type is included. The reason for this omission is that in the present study, we account for specific hazard characteristics and are not interested in modelling the hazard itself. However, in a full risk analysis, these links must be included, as shown in Papakosta et al. (2014). Fire type distinguishes between a surface fire with flame length <3.5 m, a surface fire with flame length >3.5 m and a crown fire (Table 1). Burnt area represents the extent of the wildfire. Through the link to Fire type, the variable Burnt area also provides information on wildfire severity, because it influences the posterior probability distribution of the variable Fire type. The variables describing the fire hazard typically result from a fire hazard model (Papakosta and Straub 2013; Zwirglmaier et al. 2013). As our interest in the present study is in the response to a given hazard
  according to Eqn 3, these models need not be included here (the hazard characteristics
  are provided as an input to the consequence model).
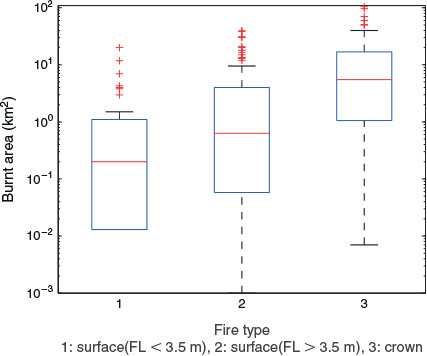
As a rule, more intense wildfires, i.e. those with longer flame lengths, are more difficult to extinguish and thus result in larger burnt areas (Rothermel and Deeming 1980). In the proposed model, there is an arc from Burnt area to Fire type, which is contrary to the causality among these two variables. Such a contra-causal connection is possible in BNs, but care is needed to ensure that the overall dependence structure among variables is consistent with reality (Straub and Der Kiureghian 2010). The arc is introduced here in view of an extension to a larger BN, which includes fire size prediction, i.e. a model that predicts Burnt area (Papakosta et al. 2014). The variable Fire type and its probabilities conditional on Burnt area are ideally defined based on data. As no data on Fire type are available for Cyprus, a dataset is used that includes the Fire type, the resulting Burnt area and the House damages of 195 fire events that took place in the wildland–urban interface (WUI) in Greece in the 1981–2003 period. These fire events resulted in 442 heavily damaged structures. Wildfire conditions in Greece are generally considered similar to those in Cyprus, as both countries have a Mediterranean climate and similar forest vegetation. Fig. 4 shows a boxplot of fire type versus resulting burnt area for the Greece data used to learn the CPT of Fire type.
|
(2) Exposure nodes in the BN describe the exposure of the system (items at risk). Urban or Rural discriminates urban from rural areas, which influences House density (house km–2) and House stock. House stock accounts for the house type portfolio at the mesoscale. It describes the relative distribution of house types in 1 km2, which include single houses, semi-detached or row houses, and apartments. Specifically for the study area, House stock can be in one of two states: 40s_25r_35a, meaning that 40% of the houses are single houses, 25% row houses and 35% apartments, and 70s_20r_10a, meaning 70% single houses, 20% row houses, 10% apartments (Table 1). The definition of House stock should be adjusted when modelling at different scales and for other regions. The vulnerability of House stock classes (single houses, row houses, apartments) based on the possible flammability of their surroundings is considered to be high for single houses, medium for row houses and low for apartments (Long and Randall 2004; OFD 2004). The house stock classification influences the costs of rebuilding, which is taken here as the construction value of the houses in monetary terms. The above variables were chosen to represent the exposure of the houses based on their arrangement and surrounding conditions. At the applied mesoscale, the portfolio of the variable House stock is the combination of house types in each 1-km2 spatial unit and is defined specifically for the study area. Fig. 2 shows selected exposure indicators of the study area.
(3) Fire containment in 24 h and Construction type are vulnerability nodes. The parents to the vulnerability variable Fire containment in 24 h are chosen based on Plucinski et al. (2012), where a logistic regression analysis is performed to determine the effect of multiple variables on fire containment. The probability of successful Fire containment in 24 h is modelled as:
where bx are the parameters of the model or regression coefficients, FFDI is the Forest Fire Danger Index and GFDI is the Grass Fire Danger Index, which were developed for Australia (McArthur 1967). Which of the two should be used depends on the vegetation type (forest, shrub, grass). Here, FFDI or FGDI are adapted to the FWI according to Dowdy et al. (2010).
Time for ground attack and Air time are the time needed by ground and air suppression crews to reach the fire. In the BN, Time for ground attack (min) is modelled as a function of the Distance to next fire station (km), which describes the shortest distance to the next fire station. The response time of the ground firefighting group is defined as 5 min. The mean vehicle velocity is assumed to be 70 km h–1. The response time of the air firefighting group is 10 min with a mean aircraft travel time of 306 km h–1 (190 mph). Land cover types refer to the land cover type nomenclature of the Corine Land Cover (Coordination of Information on the Environment Land Cover, CLC) created by the European Environment Agency (EEA) (http://www.eea.europa.eu/legal/copyright, accessed 14 November 2016) and influence the variable Vegetation type. Vegetation type can be grass, forest, shrub and non-burnable. Air suppression can be either present or absent (yes or no). The above variables are chosen to express the suppression result and how it influences the house damages.
Construction type categorises the houses based on the construction materials and roof type. It represents a portfolio of construction types found in the 1-km2 cell, and includes construction materials such as stone or mud, single or insulated brick, and roof types such as flat concrete or inclined roof with tiles (Table 1). The definition of Construction type may be modified when modelling at different scales and for different areas. The vulnerability node House damages represents the degree of damage to the house portfolio in the cell. Vulnerability is influenced by Fire type, Fire containment in 24 h, Construction type and House stock. It is expressed as percentage of houses totally destroyed in 1 km2. As House damages refers to the portfolio in the cell, it is expressed as the percentage of destroyed houses (Table 1). The definition of the CPT of House damages can vary based on the modelling scale and the available dataset. Here, the CPT of House damages results from a normalised summation of the individual contributions to the damage from each of the influencing variables. The influence of Fire type on House damages is quantified using the Greek dataset. The failure of Fire containment is assumed to lead to minor House damages with 60% probability and major House damages with 40% probability. The Construction type of houses in Cyprus includes mainly three types of structures. Traditional houses, mostly built in the period before 1945 with stone or mud walls and roofs with wood parts (Nemry and Uihlein 2008), are considered the most vulnerable. The vulnerability of houses built with single brick walls and flat reinforced concrete roofs in the period 1946–70 (Nemry and Uihlein 2008) is considered to be lower, and newer houses with insulated brick walls and inclined roofs with ceramic tiles are the most fire-resistant.
(4) The node Housing economic loss (HEL) in Fig. 3 expresses the housing economic loss in the 1-km2 cell as the product of House damage, Construction value, House density and Burnt area. HEL is expressed in monetary terms (€).
Coupling with GIS
The BN model is coupled with a GIS for both parameter learning and output mapping. GIS layers are used as inputs for some BN nodes and the spatially referenced output of the BN is returned and visualised in the GIS. First, the spatial information is managed in a geodatabase and attached to a 1 km2 grid. ArcGIS 10.1 is used for geospatial analysis and mapping (ESRI 2012). The CPTs of the BN model are trained with the attribute table of the grid, which combines the attributes of the GIS layers. After the learning process, the BN model is applied to additional spatial datasets for predictions. The new dataset is initiated as evidence on the BN nodes and the target node is updated via inference based on the trained CPTs. The output of these calculations is the expected losses (in €) in each 1-km2 cell of the study area. Evidence propagation is conducted as batch propagation within the BN software shell (HUGIN).
The BN is run separately for each of the grid cells. Note that spatial dependence between cells is represented through the dependence of the observed indicator variables, but not through the BN itself.
Results
The expected HEL estimated by the BN model for an average cell of the study area conditional on a fire occurring is 18 635 €. To obtain this result, the BN is evaluated without any information, i.e. all influencing variables are represented by their probability distributions reflecting an average 1-km2 area on Cyprus.
Fig. 5 illustrates the BN estimate of the HEL conditional on a fire with the lowest hazard conditions, i.e. with a burnt area <0.01 km2 and of fire type 1 (surface fire with flame length <3.5 m). The average HEL in a 1-km2 cell over the study area is 331 €. In each node of Fig. 5, the posterior marginal distribution of the variable is shown together with the expected HEL, given the corresponding state. As an example, were the FWI fixed to its largest value of 60–120, with all other parameters left unaltered, the expected HEL would increase to 580 €. For different land-cover types, the expected HEL varies from  (for urban areas and wetlands) to 588 € (for forested areas). Areas with forests (land cover type: 5) are expected to have the highest HEL, followed by shrubs (land cover type: 6) and permanent crops (land cover type: 3).

|
As expected, HEL increases proportionally with burnt area (Fig. 6). When burnt area > 1 km2, it exceeds the total area of the cell. In such a case, if burnt area were visualised as a circular buffer zone from the cell where fire occurred, this burnt area circle would also intersect with neighbouring cells. In this case, and because we still want to include bigger burnt areas in the study, for simplification, the neighbouring cells are assumed to have similar characteristics to the ‘fire’ cell (where fire occurs) and this would result in similar losses. The losses for the ‘fire’ cell when burnt area > 1 km2 are thus overestimated, because they include losses that are expected in neighbouring cells if they are similar to the ‘fire’ cell. The effect of Fire type can be studied by fixing this variable while leaving all others without evidence; the expected HEL varies between 7.6 × 10³ € (Fire type = 1) and 57 × 103 € (Fire type = 3).
|
To assess the sensitivity of HEL to the model variables and their variability, we compute the variance (and standard deviation) of HEL with respect to each individual variable. This variance-based sensitivity analysis is global, i.e. it accounts for the interaction among the input variables and the non-linearity of the model (Saltelli et al. 2008). The variables with the highest influence on HEL are (in decreasing order) House damage, Burnt area, Fire containment in 24 h, House density, Urban/rural, House stock, Construction value, Fire type, Air suppression, Vegetation type, Land cover, FWI, Construction value, Time for ground attack and Distance to next fire station (Fig. 7). The variable House stock is deterministically related to the variable Urban/rural, and hence their effect on HEL is the same.
|
Two examples of past fire periods were selected to compare the estimated HEL with available observations (Fig. 8). Based on the hazard characteristics (Burnt area and FWI) and the exposure and vulnerability indicators, the model estimates the expected HEL for each cell (1 km2) in which a fire occurred. The results vary from 0 to 570 × 103 €. The aggregated expected HEL from all fire events in the periods is also provided. The BN model gives results that are in agreement with actual recorded losses (Table 2). However, the NatCatSERVICE database (Munich Re) gives information on the number of houses damaged, and not on the resulting HEL, which hinders direct verification of the BN results. It is also noted that the BN model provides expected (mean) values, which do not have to coincide with the actual observed losses for a single event.
|

|
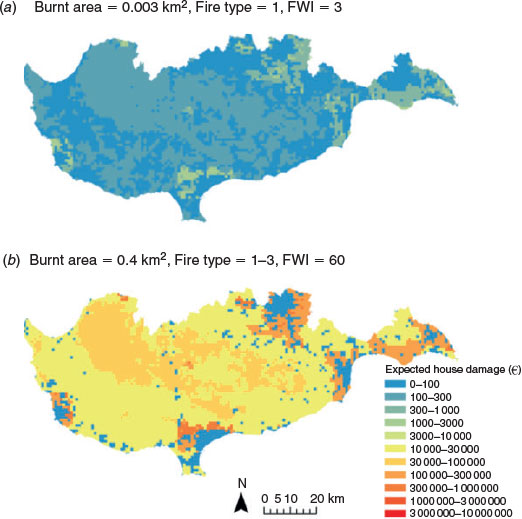
On the assumption of a specific fire occurring throughout the entire study area, it is possible to get estimates of the HEL in maps (Fig. 9). The specifics of the assumption (Burnt area, Fire type and FWI) are based on data for the prefectures of East Attica, West Attica, Corinthia and Viotia as reported by Xanthopoulos et al. (2014). As expected, the HEL under more destructive fire (Burnt area = 0.4 km2, Fire type = 1–3) and dryer vegetation conditions (FWI = 60) is higher than under less destructive and easier-to-contain fires (Burnt area = 0.003 km2, Fire type = 1) and humid vegetation conditions. Urban areas have the lowest conditional HEL, owing to the lack of flammable vegetation and a higher probability of fire containment. The peri-urban areas, which represent the coexistence of residential areas and natural vegetation, have the highest expected HEL values for a given fire hazard. Forested areas also exhibit an above-average expected HEL (see also Fig. 2c).
|
Discussion
Predictive models for quantitatively estimating consequences to houses are an important component of wildfire risk assessment. Our aim is to present a methodology than can be used in assessing different types of damages and can be useful in cases of variable data sources or even lack of data. The model should be able to incorporate other existing models. Moreover, we are interested in evaluating the influence of different variables on the damage economic loss. The model should be able to predict damage economic loss for given fire characteristics in monetary values at a 1-km2 spatial resolution.
The model shows that the WUI is expected to experience the highest damages, a result that agrees with previous studies (Mozumder et al. 2009; Gibbons et al. 2012; Syphard et al. 2012). Moreover, the influence of more severe fire danger conditions (FWI = 60) on the expected house losses shows that the majority of losses are expected to occur on days with adverse fire weather conditions, as found in other studies as well (Blanchi et al. 2010). Although such results are potentially useful and can serve as a plausibility check, they are not the main aim of the present study. Instead, the goal is to develop a predictive model for wildfire consequences based on readily available spatially and temporally variable indicators that are known to have an effect on wildfire risk.
Although the proposed model has been shown to give plausible and useful results and can be applied to other areas with similar characteristics, there are limitations that should be addressed. Mesoscale modelling requires that the indicators be representative for a 1-km2 spatial unit. This introduces uncertainties into the model, as it is necessary to identify representative states not of individual houses, but of portfolios of houses, e.g. housing stock, construction type. These must be adjusted when the model is transferred to other regions. The resulting BN includes the Australian model from Plucinski (2012) on fire suppression. Clearly, the conditions are different in the Mediterranean, but we believe that the model is still valuable as the variables influencing the probability of fire containment are similar in both regions. Furthermore, the approach is flexible. As we demonstrate, the BN can easily incorporate existing models, in this case a linear regression model, and with the same ease, the models can be replaced. The CPTs of the corresponding variables will simply need to change when a similar model calibrated with data from the Mediterranean is available. We have also demonstrated the ability of the model to incorporate expert knowledge, but in case of missing data, care is needed when incorporating such information.
The proposed model should be seen as an initial step towards a comprehensive consequence analysis for wildfires. Besides extending it to consequences other than house damage, the model should include additional factors known to influence wildfire consequences. The flexibility of the BN framework facilitates such an extension of the model. Additional influencing variables that could be added to increase the model accuracy include the adjacent vegetation influencing house damages, evacuation plans and a distinction between permanent and non-permanent house use to account for the suppression attempts of residents, the existence of fire protection plans at the community level to account for the preparedness of residents to protect their houses from fire, and the existence of house insurance against fire, which also influences residents’ behaviour in case of fire. These (and other) parameters can be included in the BN model by adding them as nodes, together with the appropriate links. Their inclusion does, however, require that quantitative models of their influence on house damage, or on other variables of the BN, are available.
Finally, data on actual house damages and fire characteristics would be valuable for model calibration and validation. Although databases on fires are available, it is difficult to obtain reliable statistics on the consequences of fires. In the absence of such data, the BN enables the combination of the limited available data with expert knowledge and models.
Conclusions
A BN model for estimating HEL at the mesoscale was developed and applied to the Mediterranean island of Cyprus. The coupling of a BN with GIS results in maps providing the expected building damage economic loss for different hazard types. The model is flexible and can be extended to include additional indicators and to assess consequences related to human safety, habitat and agricultural losses.
Acknowledgements
We thank Dr Matt Plucinski of the CSIRO Sustainable Ecosystems Bushfire Dynamics and Applications group for providing us with the Fire Containment calculator. The comments of two anonymous reviewers are highly appreciated. Participation of the second author was in the context of a research project on ‘Estimation of the cost of damages caused by forest fires’ funded by the Hellenic Agricultural Organization ‘Demeter’, Institute of Mediterranean Forest Ecosystems, Athens, Greece.
References
Ager AA, Vaillant NM, Finney MA (2010) A comparison of landscape fuel treatment strategies to mitigate wildland fire risk in the urban interface and preserve old forest structure. Forest Ecology and Management 259, 1556–1570.| A comparison of landscape fuel treatment strategies to mitigate wildland fire risk in the urban interface and preserve old forest structure.Crossref | GoogleScholarGoogle Scholar |
Aspinall WP, Woo G, Voight B, Baxter PJ (2003) Evidence-based volcanology: application to eruption crises. Journal of Volcanology and Geothermal Research 128, 273–285.
| Evidence-based volcanology: application to eruption crises.Crossref | GoogleScholarGoogle Scholar | 1:CAS:528:DC%2BD3sXovF2qt78%3D&md5=4608a8cd335eebc665a8c2265ad42bafCAS |
Bayraktarli YY, Ulfkjaer J, Yazgan U, Faber MH (2005) On the application of Bayesian probabilistic networks for earthquake risk management. In ‘Proceedings of ICOSSAR 05 – Safety and reliability of engineering’, 19–23 June 2005, Rome, Italy. (Eds G Augusti, G Schueller, M Ciampoli) pp. 20–23 (Millpress: Rome).
Bensi MT, Der Kiureghian A, Straub D (2014) Framework for post-earthquake risk assessment and decision-making for infrastructure systems. ASCE–ASME Journal of Risk and Uncertainty in Engineering Systems, Part A: Civil Engineering 1, 04014003
Biedermann A, Taroni F, Delemont O, Semadeni C, Davison A (2005) The evaluation of evidence in the forensic investigation of fire incidents (Part I): an approach using Bayesian networks. Forensic Science International 147, 49–57.
| The evaluation of evidence in the forensic investigation of fire incidents (Part I): an approach using Bayesian networks.Crossref | GoogleScholarGoogle Scholar | 1:STN:280:DC%2BD2crmvFGntA%3D%3D&md5=2398831285820c0918a182ed2870b696CAS |
Birkmann J (2006) Indicators and criteria for measuring vulnerability: theoretical bases and requirements. In ‘Measuring vulnerability to natural hazards’. (Ed. J Birkmann) pp. 55–77. (United Nations University Press: Tokyo).
Blanchi R, Lucas C, Leonard J, Finkele K (2010) Meteorological conditions and wildfire-related house loss in Australia. International Journal of Wildland Fire 19, 914–926.
| Meteorological conditions and wildfire-related house loss in Australia.Crossref | GoogleScholarGoogle Scholar |
Blaser L, Ohrnberger M, Riggelsen C, Scherbaum F (2009) Bayesian belief network for tsunami warning decision support. In ‘Proceedings of the 10th European conference on symbolic and quantitative approaches to reasoning with uncertainty (ECSQARU 2009), 1–3 July 2009, Verona, Italy. (Eds C Sossai, G Chemello) pp. 757–786. (Springer: Berlin)
Blong R (2003) A new damage index. Natural Hazards 30, 1–23.
| A new damage index.Crossref | GoogleScholarGoogle Scholar |
Byram GM (1959) Combustion of forest fuels. In ‘Forest fire: control and use’. (Ed. KP Davis) pp. 61–89. (McGraw-Hill: New York)
Butler BW, Cohen JD (1998) Firefighter safety zones: a theoretical model based on radiative heating. International Journal of Wildland Fire 8, 73–77.
| Firefighter safety zones: a theoretical model based on radiative heating.Crossref | GoogleScholarGoogle Scholar |
Cardona O-D, van Aalst MK, Birkmann J, Fordham M, McGregor G, Mechler R (2012) Determinants of risk: exposure and vulnerability In ‘Managing the risks of extreme events and disasters to advance climate change adaptation’. (Eds CB Field, V Barros, TF Stocker, D Qin, DJ Dokken, KL Ebi, MD Mastrandrea, KJ Mach, G-K Plattner, SK Allen, M Tignor, PM Midgley) A special report of Working Groups I and II of the Intergovernmental Panel on Climate Change (IPCC) pp. 65–108 (Cambridge University Press: Cambridge, UK).
Carreño M-L, Cardona OD, Barbat AH (2007) Urban seismic risk evaluation: a holistic approach. Natural Hazards 40, 137–172.
| Urban seismic risk evaluation: a holistic approach.Crossref | GoogleScholarGoogle Scholar |
Cheng H, Hadjisophocleous GV (2009) The modeling of fire spread in buildings by Bayesian network. Fire Safety Journal 44, 901–908.
| The modeling of fire spread in buildings by Bayesian network.Crossref | GoogleScholarGoogle Scholar |
Cohen JD (2000) Preventing disaster: home ignitability in the wildland–urban interface. Journal of Forestry 98, 15–21.
Cohen JD (2004) Relating flame radiation to home ignition using modeling and experimental crown fires. Canadian Journal of Forest Research 34, 1616–1626.
| Relating flame radiation to home ignition using modeling and experimental crown fires.Crossref | GoogleScholarGoogle Scholar |
Dahmani Y, Hamri ME (2011) Event triggering estimation for Cell-DEVS: wildfire spread simulation case. In ‘Proceedings of the UKSim 5th European symposium on computer modeling and simulation (EMS), 2011’, 16–18 November 2011, Madrid, Spain. (Ed. NJ Piscataway) (IEEE Computer Society: Washington, DC)
Dlamini WM (2010) A Bayesian belief network analysis of factors influencing wildfire occurrence in Swaziland. Environmental Modelling & Software 25, 199–208.
| A Bayesian belief network analysis of factors influencing wildfire occurrence in Swaziland.Crossref | GoogleScholarGoogle Scholar |
Dowdy AJ, Mills GA, Finkele K, de Groot W (2010) Index sensitivity analysis applied to the Canadian Forest Fire Weather Index and the McArthur Forest Fire Danger Index. Meteorological Applications 17, 298–312.
ECONorthwest (2007) Linn County community wildfire protection plan. Available at https://scholarsbank.uoregon.edu/xmlui/bitstream/handle/1794/5795/Linn_County_Wildfire_Plan.pdf?sequence=1 [Verified 14 November 2016]
ESRI (2012) ‘ArcGIS 10.1. ESRI.’ (Environmental Systems Resource Institute: Redlands, CA)
Finney MA (2005) The challenge of quantitative risk analysis for wildlife fire. Forest Ecology and Management 211, 97–108.
| The challenge of quantitative risk analysis for wildlife fire.Crossref | GoogleScholarGoogle Scholar |
Finney MA (2006) An overview of FlamMap fire modeling capabilities. In ‘Fuels management: how to measure success: conference proceedings’, 28–30 March 2006, Portland, OR. USDA Forest Service, Rocky Mountain Research Station, Proceedings RMRS-P-41, pp. 213–220. (Fort Collins, CO)
FSBC (2003) The home-owners firesmart manual – protect your home from wildfire (British Columbia Ministry of Forests, BC) Available at http://www.embc.gov.bc.ca/ofc/interface/pdf/homeowner-firesmart.pdf [Verified 14 November 2016]
Gibbons P, Van Bommel L, Gill AM, Cary GJ, Driscoll DA, Bradstock RA, Knight E, Moritz MA, Stephens SL, Lindenmayer DB (2012) Land-management practices associated with house loss in wildfires. PLoS One 7, e29212
| Land-management practices associated with house loss in wildfires.Crossref | GoogleScholarGoogle Scholar | 1:CAS:528:DC%2BC38XhvVyktbY%3D&md5=904190e7a8a85396c34f32aed5b055a3CAS |
Grêt-Regamey A, Straub D (2006) Spatially explicit avalanche risk assessment linking Bayesian networks to a GIS. Natural Hazards and Earth System Sciences 6, 911–926.
| Spatially explicit avalanche risk assessment linking Bayesian networks to a GIS.Crossref | GoogleScholarGoogle Scholar |
Guzzetti F, Salvati P, Stark CP (2005) Evaluation of risk to the population posed by natural hazards in Italy. In ‘Landslide risk management’. (Eds O Hungr, R Fell, R Couture, E Eberhardt) pp. 381–389. (Taylor & Francis Group: London)
Hanea D, Ale B (2009) Risk of human fatality in building fires: a decision tool using Bayesian networks. Fire Safety Journal 44, 704–710.
| Risk of human fatality in building fires: a decision tool using Bayesian networks.Crossref | GoogleScholarGoogle Scholar |
Hardy CC (2005) Wildland fire hazard and risk: problems, definitions, and context. Forest Ecology and Management 211, 73–82.
| Wildland fire hazard and risk: problems, definitions, and context.Crossref | GoogleScholarGoogle Scholar |
Harris S, Anderson W, Kilinc M, Fogarty L (2012) The relationship between fire behaviour measures and community loss: an exploratory analysis for developing a bushfire severity scale. Natural Hazards 63, 391–415.
| The relationship between fire behaviour measures and community loss: an exploratory analysis for developing a bushfire severity scale.Crossref | GoogleScholarGoogle Scholar |
Howes AL, Maron M, Mcalpine CA (2010) Bayesian networks and adaptive management of wildlife habitat. Conservation Biology 24, 974–983.
| Bayesian networks and adaptive management of wildlife habitat.Crossref | GoogleScholarGoogle Scholar |
Jensen FV, Nielsen TD (2007) ‘Bayesian networks and decision graphs.’ (Springer: New York).
Kjaerulff UB, Madsen AL (2013) ‘Bayesian networks and influence diagrams: a guide to construction and analysis.’ (Springer: New York).
Koo E, Pagni PJ, Weise DR, Woycheese JP (2010) Firebrands and spotting ignition in large-scale fires. International Journal of Wildland Fire 19, 818–843.
| Firebrands and spotting ignition in large-scale fires.Crossref | GoogleScholarGoogle Scholar |
Kron W (2002) Keynote lecture: flood risk = hazard × exposure × vulnerability. In ‘Proceedings of the flood defence (IFSD 2002)’, 10–13 September 2002, Beijing, China. (Eds B Wu, Z-Y Wang, G Wang, GHG Huang, H Fang, J Huang) pp. 82–97. (Science Press: New York)
Lawson BD, Armitage OB (2008) Weather guide for the Canadian Forest Fire Danger Rating System. Natural Resources Canada, Canadian Forest Service, Northern Forestry Centre, Edmonton, AB. Catalogue no. Fo134-8/2008E-PDF.
Li L, Wang J, Leung H, Zhao S (2012) A Bayesian method to mine spatial data sets to evaluate the vulnerability of human beings to catastrophic risk. Risk Analysis 32, 1072–1092.
| A Bayesian method to mine spatial data sets to evaluate the vulnerability of human beings to catastrophic risk.Crossref | GoogleScholarGoogle Scholar |
Long A, Randall C (2004) Wildfire risk assessment guide for homeowners (in the southern United States). School of Forest Resources and Conservation, University of Florida, Institute of Food and Agricultural Sciences (IFAS). Available at https://www.bugwood.org/acrobat/WildfireRAGH.pdf [Verified 14 November 2016]
Lynch DL (2004) What do forest fires really cost? Journal of Forestry 102, 42–49.
McArthur A (1967) Fire behaviour in eucalypt forests. Commonwealth of Australia, Forestry and Timber Bureau Leaflet 107. (Canberra, ACT).
Mell WE, Manzello SL, Maranghides A, Butry D, Rehm RG (2010) The wildland–urban interface fire problem – current approaches and research needs. International Journal of Wildland Fire 19, 238–251.
| The wildland–urban interface fire problem – current approaches and research needs.Crossref | GoogleScholarGoogle Scholar |
Miller C, Ager AA (2013) A review of recent advances in risk analysis for wildfire management International Journal of Wildland Fire 22, 1–14.
| A review of recent advances in risk analysis for wildfire managementCrossref | GoogleScholarGoogle Scholar |
Mitsopoulos I, Mallinis G, Arianoutsou M (2015) Wildfire risk assessment in a typical Mediterranean wildland–urban interface of Greece. Environmental management 55, 900–915.
| Wildfire risk assessment in a typical Mediterranean wildland–urban interface of Greece.Crossref | GoogleScholarGoogle Scholar |
Mozumder P, Helton R, Berrens RP (2009) Provision of a wildfire risk map: informing residents in the wildland–urban interface. Risk Analysis 29, 1588–1600.
| Provision of a wildfire risk map: informing residents in the wildland–urban interface.Crossref | GoogleScholarGoogle Scholar |
Nemry F, Uihlein A (2008) Environmental improvement potentials of residential buildings (IMPRO-Building). Joint Research Centre (JRC) scientific and technical series, European Commission, Spain, EUR 23493 EN. Office for Official Publications of the European Communities, Luxembourg.
Oregon Forestry Department (OFD) (2004) Wildfire risk explorer: identifying and assessment of communities at risk in Oregon, draft version 4.0. (Oregon Department of Forestry: Salem, OR)
Ohlson DW, Blackwell BA, Hawkes BC, Bonin D (2003) A wildfire risk management system – an evolution of the wildfire threat rating system. In ‘Proceedings of the 3rd international wildland fire conference and exhibition’, 3–6 October 2003, Sydney, NSW. Available at http://www.fire.uni-freiburg.de/summit-2003/3-IWFC/Papers/3-IWFC-131-Ohlson.pdf [Verified 15 November 2016]
Papakosta P (2015) Bayesian network models for wildfire risk estimation in the Mediterranean basin. PhD thesis, Technische Universitaet München, Germany.
Papakosta P, Straub D (2013) A Bayesian network approach to assessing wildfire consequences. In ‘Proceedings of the 11th international conference on structural safety and reliability’. (Eds G Deodatis, BR Ellingwood, DM Frangopol) pp. 3131–3138. (Taylor & Francis Group: London).
Papakosta P, Straub D (2015) Probabilistic prediction of daily fire occurrence in the Mediterranean with readily available spatiotemporal data. iForest
| Probabilistic prediction of daily fire occurrence in the Mediterranean with readily available spatiotemporal data.Crossref | GoogleScholarGoogle Scholar |
Papakosta P, Öster J, Scherb A, Straub D (2013) Fire occurrence prediction in the Mediterranean: application to southern France. In ‘EGU General Assembly conference abstracts’, 7–12 April 2013, Vienna, Austria. Vol. 15: 6336.
Papakosta P, Scherb A, Zwirglmaier K, Straub D (2014) Estimating daily fire risk in the mesoscale by means of a Bayesian network model and a coupled GIS. In ‘Proceedings of the vii international conference on forest fire research: advances in forest fire research’, 17–20 November 2014, Coimbra, Portugal. (Ed. DX Viegas) (ADAI/CEIF, University of Coimbra: Coimbra, Portugal).
Paul BK (2011) ‘Environmental hazards and disasters: contexts, perspectives and management.’ (John Wiley & Sons: Hoboken, NJ).
Penman TD, Price O, Bradstock RA (2011) Bayes Nets as a method for analysing the influence of management actions in fire planning. International Journal of Wildland Fire 20, 909–920.
| Bayes Nets as a method for analysing the influence of management actions in fire planning.Crossref | GoogleScholarGoogle Scholar |
Penman TD, Eriksen C, Blanchi R, Chladil M, Gill AM, Haynes K, Leonard J, McLennan J, Bradstock RA (2013) Defining adequate means of residents to prepare property for protection from wildfire. International Journal of Disaster Risk Reduction 6, 67–77.
| Defining adequate means of residents to prepare property for protection from wildfire.Crossref | GoogleScholarGoogle Scholar |
Penman TD, Bradstock RA, Price OF (2014) Reducing wildfire risk to urban developments: simulation of cost-effective fuel treatment solutions in south-eastern Australia. Environmental Modelling & Software 52, 166–175.
| Reducing wildfire risk to urban developments: simulation of cost-effective fuel treatment solutions in south-eastern Australia.Crossref | GoogleScholarGoogle Scholar |
Plucinski M (2012) Factors affecting containment area and time of Australian forest fires featuring aerial suppression. Forest Science 58, 390–398.
| Factors affecting containment area and time of Australian forest fires featuring aerial suppression.Crossref | GoogleScholarGoogle Scholar |
Plucinski M, McCarthy G, Hollis J, Gould J (2012) The effect of aerial suppression on the containment time of Australian wildfires estimated by fire management personnel. International Journal of Wildland Fire 21, 219–229.
| The effect of aerial suppression on the containment time of Australian wildfires estimated by fire management personnel.Crossref | GoogleScholarGoogle Scholar |
Rothermel RC, Deeming JE (1980) Measuring and interpreting fire behavior for correlation with fire effects. USDA Forest Service, Intermountain Forest and Range Experiment Station, General Technical Report INT-93. (Ogden, UT)
Salis M, Ager AA, Arca B, Finney MA, Bacciu V, Duce P, Spano D (2013) Assessing exposure of human and ecological values to wildfire in Sardinia, Italy. International Journal of Wildland Fire 22, 549–565.
| Assessing exposure of human and ecological values to wildfire in Sardinia, Italy.Crossref | GoogleScholarGoogle Scholar | 1:CAS:528:DC%2BC3sXpvFakt7k%3D&md5=56877e2504fc93d910712df09ed82afaCAS |
Saltelli A, Ratto M, Andres T, Campolongo F, Cariboni J, Gatelli D, Saisana M, Tarantola S (2008) ‘Global sensitivity analysis: the primer.’ (John Wiley & Sons: West Sussex, England).
Scott JH (2006). Comparison of crown fire modeling systems used in three fire management applications. USDA Forest Service, Rocky Mountain Research Station, Research Paper RMRS-RP-58. Available at http://www.fs.fed.us/rm/pubs/rmrs_rp058.pdf [Verified 17 November 2016]
Song Y, Gong J, Gao S, Wang D, Cui T, Li Y, Wei B (2012) Susceptibility assessment of earthquake-induced landslides using Bayesian network: a case study in Beichuan, China. Computers & Geosciences 42, 189–199.
| Susceptibility assessment of earthquake-induced landslides using Bayesian network: a case study in Beichuan, China.Crossref | GoogleScholarGoogle Scholar |
Statistical Service (2010) Construction and housing statistics. Available at http://www.mof.gov.cy/mof/cystat/statistics.nsf/All/02762FF6F1F58664C2257B8E002FC1BA/$file/CONSTRUCTION_AND_HOUSING-2010-060312.pdf?OpenElement [Verified 15 November 2016]
Statistical Service (2011) Conventional dwellings enumerated by year of construction (completion). Report table statistics. Available at http://www.mof.gov.cy/mof/cystat/statistics.nsf/populationcondition_22main_en/populationcondition_22main_en?OpenForm&sub=2&sel=2 [Verified 15 November 2016]
Straub D (2005) Natural hazards risk assessment using Bayesian networks. In ‘Proceedings of ICOSSAR 05 – Safety and reliability of engineering systems and structures’, 19–23 June 2005, Rome, Italy. (Eds G Augusti, G Schueller, M Ciampoli) pp. 2535–2542 (Millpress: Rotterdam, Netherlands)
Straub D, Der Kiureghian A (2010) Bayesian network enhanced with structural reliability methods: methodology. Journal of Engineering Mechanics 136, 1248–1258.
| Bayesian network enhanced with structural reliability methods: methodology.Crossref | GoogleScholarGoogle Scholar |
Sunderman SO, Weisberg PJ (2012) Predictive modelling of burn probability and burn severity in a desert spring ecosystem. International Journal of Wildland Fire 21, 1014–1024.
| Predictive modelling of burn probability and burn severity in a desert spring ecosystem.Crossref | GoogleScholarGoogle Scholar |
Syphard AD, Keeley JE, Massada AB, Brennan TJ, Radeloff VC (2012) Housing arrangement and location determine the likelihood of housing loss due to wildfire. PLoS One 7, e33954
| Housing arrangement and location determine the likelihood of housing loss due to wildfire.Crossref | GoogleScholarGoogle Scholar | 1:CAS:528:DC%2BC38XltlOit7w%3D&md5=66379074a13b8e411739faef98c5f26fCAS |
Tutsch M, Haider W, Beardmore B, Lertzman K, Cooper AB, Walker RC (2010) Estimating the consequences of wildfire for wildfire risk assessment, a case study in the southern Gulf Islands, British Columbia, Canada. Canadian Journal of Forest Research 40, 2104–2114.
| Estimating the consequences of wildfire for wildfire risk assessment, a case study in the southern Gulf Islands, British Columbia, Canada.Crossref | GoogleScholarGoogle Scholar |
Office of the United Nations Disaster Relief Co-ordinator (UNDRO) (1980) Natural disasters and vulnerability analysis: report of experts group meeting (9–12 July 1979). (Nabu Press: Charleston, SC).
Vogel K, Riggelsen C, Scherbaum F (2013) Challenges for Bayesian Network learning in a flood damage assessment application. In ‘Proceedings of ICOSSAR 13 – Safety and reliability of engineering’, 16–20 June 2013. (Columbia University: New York)
Xanthopoulos G (2004) Who should be responsible for forest fires? Lessons from the Greek experience. In ‘Proceedings of the second international symposium on fire economics, planning and policy: a global view’, 19–22 April, Cordoba, Spain. (Ed. A. González-Cabán) USDA Forest Service, Pacific Southwest Research Station, General Technical Report PSW-GTR-208. (Albany, CA)
Xanthopoulos G (2008) Parallel lines. Wildfire 17, 8–20.
Xanthopoulos G, Calfapietra C, Fernandes P (2012) Fire hazard and flammability of European forest types. In ‘Post-fire management and restoration of southern European forests’. (Eds F Moreira, M Arianoutsou, P Corona, J De las Heras) pp. 79–92. (Springer: Dordrecht, Netherlands)
Xanthopoulos G, Roussos A, Giannakopoulos C, Karali A, Hatzaki M (2014) Investigation of the weather conditions leading to large forest fires in the area around Athens, Greece. In ‘Proceedings of the VII international conference on forest fire research: advances in forest fire research’, 17–20 November 2014, Coimbra, Portugal. (Ed. DX Viegas) (ADAI/CEIF, University of Coimbra: Coimbra, Portugal)
Zwirglmaier K, Papakosta P, Straub D (2013) Learning a Bayesian network model for predicting wildfire behavior. In ‘Proceedings of the 11th international conference on structural safety and reliability’. (Eds G Deodatis, BR Ellingwood and DM Frangopol) (Taylor & Francis Group: London)