

Spatially varying constraints of human-caused fire occurrence in British Columbia, Canada
Philip E. Camp A and Meg A. Krawchuk B CA Department of Geography, Simon Fraser University, 8888 University Drive, Burnaby, BC V5A 1S6, Canada.
B Department of Forest Ecosystems and Society, Oregon State University, 336 Richardson Hall, Corvallis, OR 97331, USA.
C Corresponding author. Email: meg.krawchuk@oregonstate.edu
International Journal of Wildland Fire 26(3) 219-229 https://doi.org/10.1071/WF16108
Submitted: 11 June 2016 Accepted: 21 January 2017 Published: 23 February 2017
Journal Compilation © IAWF 2017 Open Access CC BY-NC-ND
Abstract
Human-caused wildfires are controlled by human and natural influences, and determining their key drivers is critical for understanding spatial patterns of wildfire and implementing effective fire management. We examined an array of explanatory variables that account for spatial controls of human-caused fire occurrence from 1990 to 2013 among six ecosystem zones that vary in human footprint and environmental characteristics in British Columbia, Canada. We found that long-term patterns of human-caused fire in ecosystem zones with a larger human footprint were strongly controlled by biophysical variables explaining conditions conducive to burning, whereas fire occurrence in remote ecosystem zones was controlled by various metrics of human activity. A metric representing the wildland–urban interface was a key factor explaining human-caused fire occurrence regardless of ecosystem zone. Our results contribute to the growing body of research on the varying constraints of spatial patterns of fire occurrence by explicitly examining human-caused fire and the heterogeneity of constraints based on human development.
Additional keywords: biogeoclimatic zones, human-caused ignitions, multiple regression, wildland–urban interface.
Introduction
Human-caused wildfires can be a threat to ecological systems, housing developments and valuable natural resources, and present high associated economic costs. Human-caused fires are problematic for fire suppression as they are frequently in close proximity to housing developments (Bar-Massada et al. 2014) and can destroy homes and force mandatory evacuations. For a typical year in British Columbia (BC), Canada, 40% of wildfires are human caused and some of these events are costly; for example, the cigarette-ignited 2003 McLure Fire cost over CAD$30 million to suppress and caused over $8.2 million in damages to private property (Kulig et al. 2013). As a result of climate change and sprawling human development, human-caused fire frequency is expected to increase in many parts of BC and the world (Hammer et al. 2007; Flannigan et al. 2009). To develop effective conservation and fire management practices in BC, researchers and managers need to understand the underlying forces influencing the spatial patterns of contemporary human-caused fire regimes.
Human-caused fires occur as a function of key underlying influences that control fire ignition. There are three factors required for a wildfire to occur: (1) the presence of an ignition source, (2) the presence and structure of fuels that support ignition and fire spread, and (3) the environmental conditions that support burning of those fuels (Moritz et al. 2005). Human-caused ignitions tend to cluster in certain areas, such as the wildland–urban interface (WUI; CIFFC 2003; Radeloff et al. 2005; Bar-Massada et al. 2014), defined here as areas where urban development intermingles with wildland vegetation. In the WUI, wildland fuels are adjacent to an abundance of potential ignition sources (people) leading to high human-caused fire frequency. Transport corridors, specifically roads, are also good predictors of human-caused ignitions (Cardille et al. 2001; Narayanaraj and Wimberly 2012). Roads are thought to be a proxy for ignition agents such as discarded cigarettes or sparks released from dragging automobile parts, and accessibility linked to human recklessness such as fireworks, barbecues and arson. Recreational sites and trails can also be a major source of human-caused ignitions because hiking and camping often include the building of a campfire that has the potential to spark and grow as a wildfire if left unattended (Pew and Larsen 2001; Reid and Marion 2005).
Although human-caused wildfire requires the presence of a human ignition agent to start a fire, wildfire is largely controlled by a combination of biophysical influences that inhibit or promote burning conditions. For instance, whether or not a fire spreads from initial ignition is closely associated with the daily variation in weather and types of wildland fuels present in the area (Pyne 1984). For example, the absence of moisture from lower than average precipitation and increased atmospheric demand from higher than average temperatures in both daily and longer temporal scales significantly influences whether an ignition occurs and if so whether dry conditions are present for a wildfire to spread (Girardin and Wotton 2009; Meyn et al. 2013). Fine fuels are critical for ignition and fire growth to become detectable (Pyne 1984), and ecosystems with high levels of dry fine fuels, such as in grasslands, shrublands and dry conifer forests, are typically more fire prone than temperate deciduous and coniferous forests, for example. Fire-conducive fuel structure and microclimates can be altered by human activity. Land use, such as timber harvesting, alters the structure of flammable biomass and has been associated with increases in both human- and lightning-caused fire frequency (Krawchuk and Cumming 2009; Lindenmayer et al. 2009). The harvesting process mechanically removes trees and leaves dry dead slash on the ground that promotes a structure that is more conducive to burning (Lindenmayer et al. 2009; Naficy et al. 2010). Timber harvest opens the canopy, resulting in an increase in local solar insolation that increases desiccation of fuels. Climate and weather, particularly temperature and precipitation, contribute to variability in wildfire behaviour and fire occurrence. In the Pacific Northwest of North America, the location of our study, periods of warmer temperatures and lower levels of precipitation promote burning conditions that are associated with increases in fire frequency and area burned (Littell et al. 2009; Meyn et al. 2013). Changes to future climate and land cover will affect wildfire occurrence and behaviour (Flannigan et al. 2009; Wang et al. 2016), and an explicit understanding of the climatic and fuel controls on human-caused wildfire is critical for fire management in upcoming decades.
The human role in contemporary wildfire occurrence underscores the need to understand how and why human-caused fire occurrence varies spatially. Numerous studies have analysed spatial patterns of contemporary human-caused wildfire across North America based on a variety of human and environmental variables, at different spatial and temporal scales. Unique combinations of roads, housing, land cover, recreation, climate and soil moisture, among others, differentially explain spatial patterns in wildfire among study areas (Sturtevant and Cleland 2007; Syphard et al. 2007; Littell et al. 2009; Faivre et al. 2014). Recent work examining human influences on wildfire across Canada and the United States (Parisien et al. 2016) found the relative influence of climate, enduring features, lightning and anthropogenic factors varied among the 16 hexels used to subdivide the area, with pervasive anthropogenic influences. Parisien et al. (2016) provide insight into spatial variability in human effects on fire probability, but their use of pooled data from lightning- and human-caused fires obscures differences that may exist between the two classes of fires. Studies explicitly focused on the province of BC have reported mixed conclusions about key explanatory variables controlling human-caused fire. Based on statistical models of daily human-caused wildfires across the entire province, biophysical variables such as weather were the strongest determinants of fire occurrence, whereas human variables such as road density were relatively insignificant (Magnussen and Taylor 2012). Using a coarser temporal scale and finer spatial resolution, and focusing on lightning- and human-caused fires combined, Taylor et al. (2005) developed models for six regions in BC and found that road and population density provided significant explanatory power in predicting the spatial variation in fire probability, but the sign of explanatory variables was inconsistent among the regions. Geographic heterogeneity in driving factors likely underpins differences in model outcomes in different locations and at different scales, and for different classes of fires; however, synthesis aimed at understanding this geographic variability is lacking.
Fire occurrence in different ecosystems is constrained by distinctive limiting factors. Krawchuk and Moritz (2011) propose the varying constraints hypothesis that outlines the heterogeneity of key limiting factors for global patterns of fire based on differences among ecosystems and across a gradient in net primary productivity. For example, the hypothesis predicts that in areas where resource availability (fuel, net primary productivity) is high, fuel moisture conditions will act as the dominant constraint on fire activity, suggesting conducive fire conditions are the main limiting factor in the ecosystem. In contrast, in areas where resource availability is lower or more variable, such as deserts, grasslands or dry forests and shrublands, the importance of fuel moisture decreases and availability of fuels is the main limiting factor of wildfire. We can extend the varying constraints hypothesis to the human realm to examine spatial differences of constraints on human-caused fire occurrence. In the context of BC, patterns of human-caused fire and socioecological conditions are highly variable among ecosystems; thus we expect heterogeneity in key drivers among them. For example, relatively hot and dry summers dominate the province’s rain-shadowed areas and contribute to a fire environment that is highly prone to wildfire ignition. These areas also have dense clusters of human development and an abundance of potential human ignition sources. In contrast, vast remote regions of cold, moist boreal forest have fewer human-caused fires, which are likely limited by different spatial controls.
Here, we examine the relative contribution of human activity to patterns of human-caused fire occurrence in recent decades among BC’s diverse ecosystems. Specifically, our work focuses on the development of statistical regression models, with explicit comparison and interpretation of spatial patterns and drivers of human-caused fire across gradients of climate, vegetation and human activity. Our main objectives are three-fold: to determine (1) what human influence and biophysical variables have the strongest effects on human-caused wildfire occurrence patterns, and how these variables differ among ecosystems, (2) what human influence variables are most influential, that is, have the largest effect sizes in driving human-caused fire occurrence across the study area as a whole, and (3) where human activity affects fire occurrence most prominently, that is, in which ecosystems are human influence variables most important, overall?
Methods
Study area
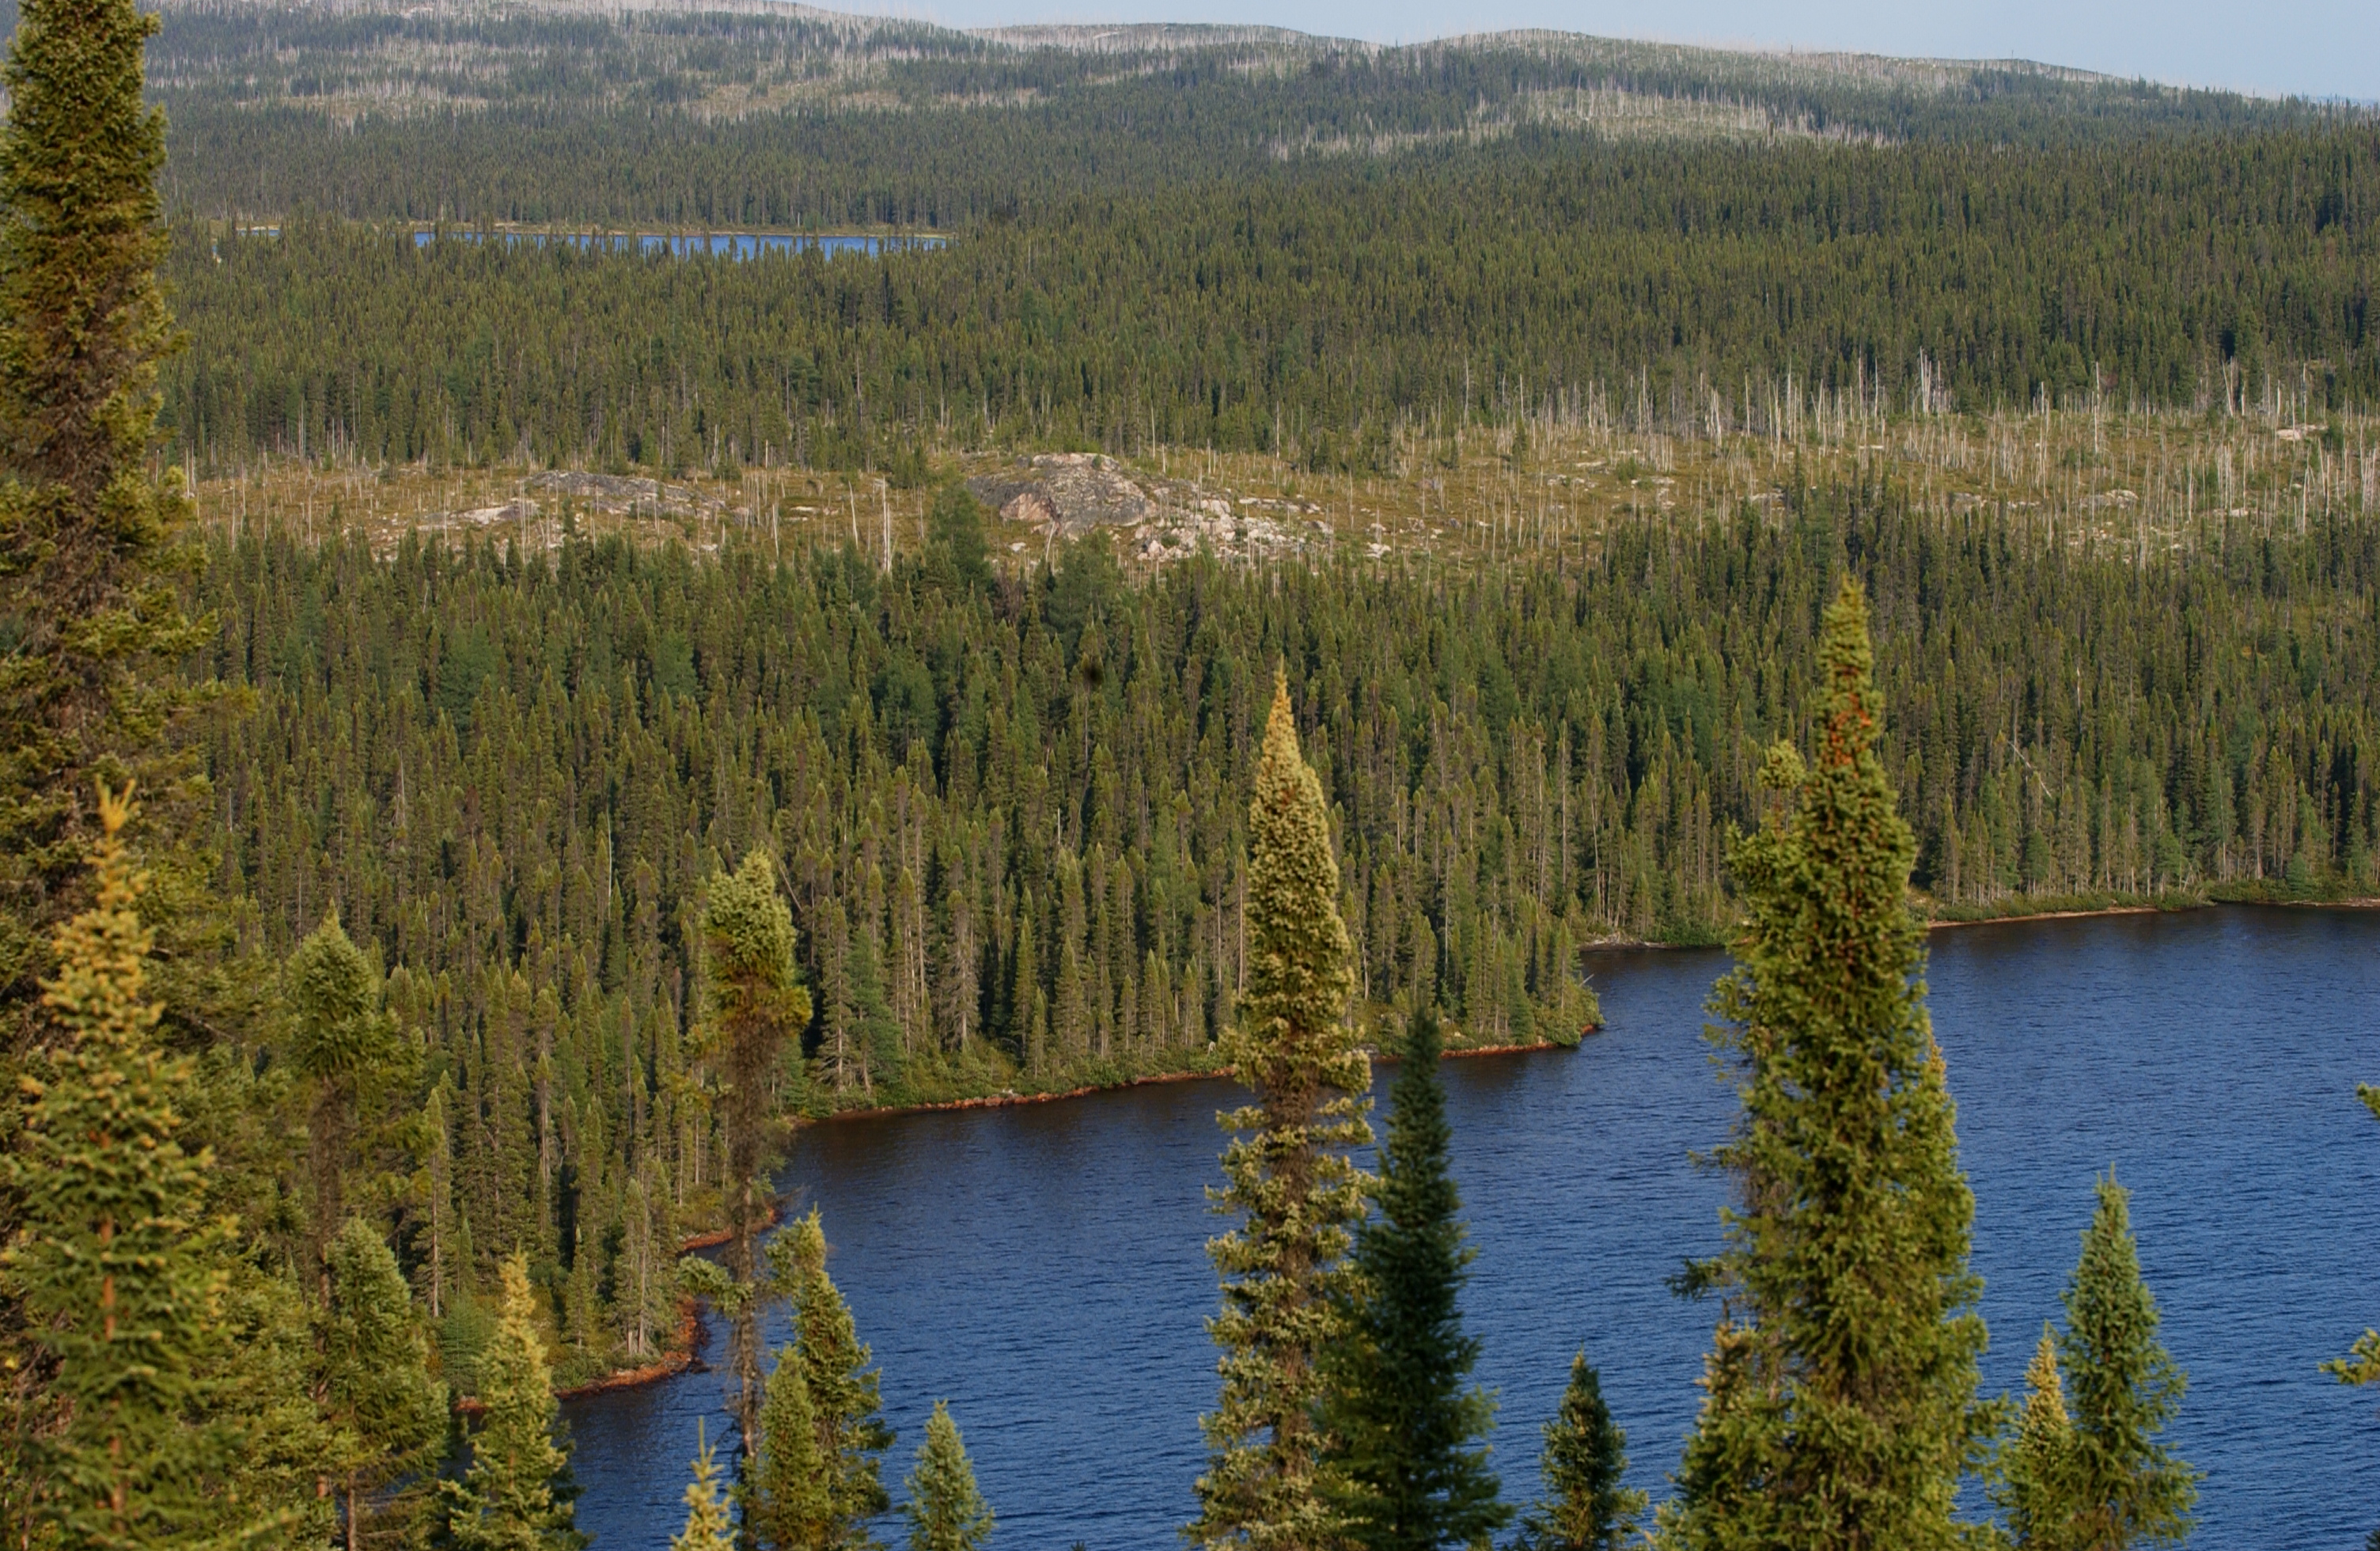
Our study area was a large region of BC, the westernmost province of Canada that occupies an area of ~950 000 km2. The province of BC is highly variable in temperature, precipitation and topography, resulting in a diverse range of ecosystems. Land managers and scientists in BC use the Biogeoclimatic Ecosystem Classification (BEC) system to identify 16 unique ecosystems based on soil, vegetation and topographic properties (Meidinger and Pojar 1991), which yield distinct fire regimes (Wong et al. 2004). For the purposes of this study, we focused on eight BEC zones covering 53% of the province that represent the bulk of where fire and human activity occurs. We combined three BEC zones, the Ponderosa Pine, Bunchgrass and Interior Douglas-fir zones, as they neighbour each other and have similar natural disturbance dynamics (Wong et al. 2004); combining zones boosted the sample size for model development because two of the three cover relatively small areas. The resulting study region includes six ‘ecosystem zones’ (Table 1; Fig. 1): Boreal White Black Spruce (hereafter BWBS), Coastal Western Hemlock (CWH), Interior Cedar–Hemlock (ICH), Ponderosa Pine + Bunchgrass + Interior Douglas-fir (PPBGIDF), Sub-boreal Pine–Spruce (SBPS) and Sub-boreal Spruce (SBS).

|

|
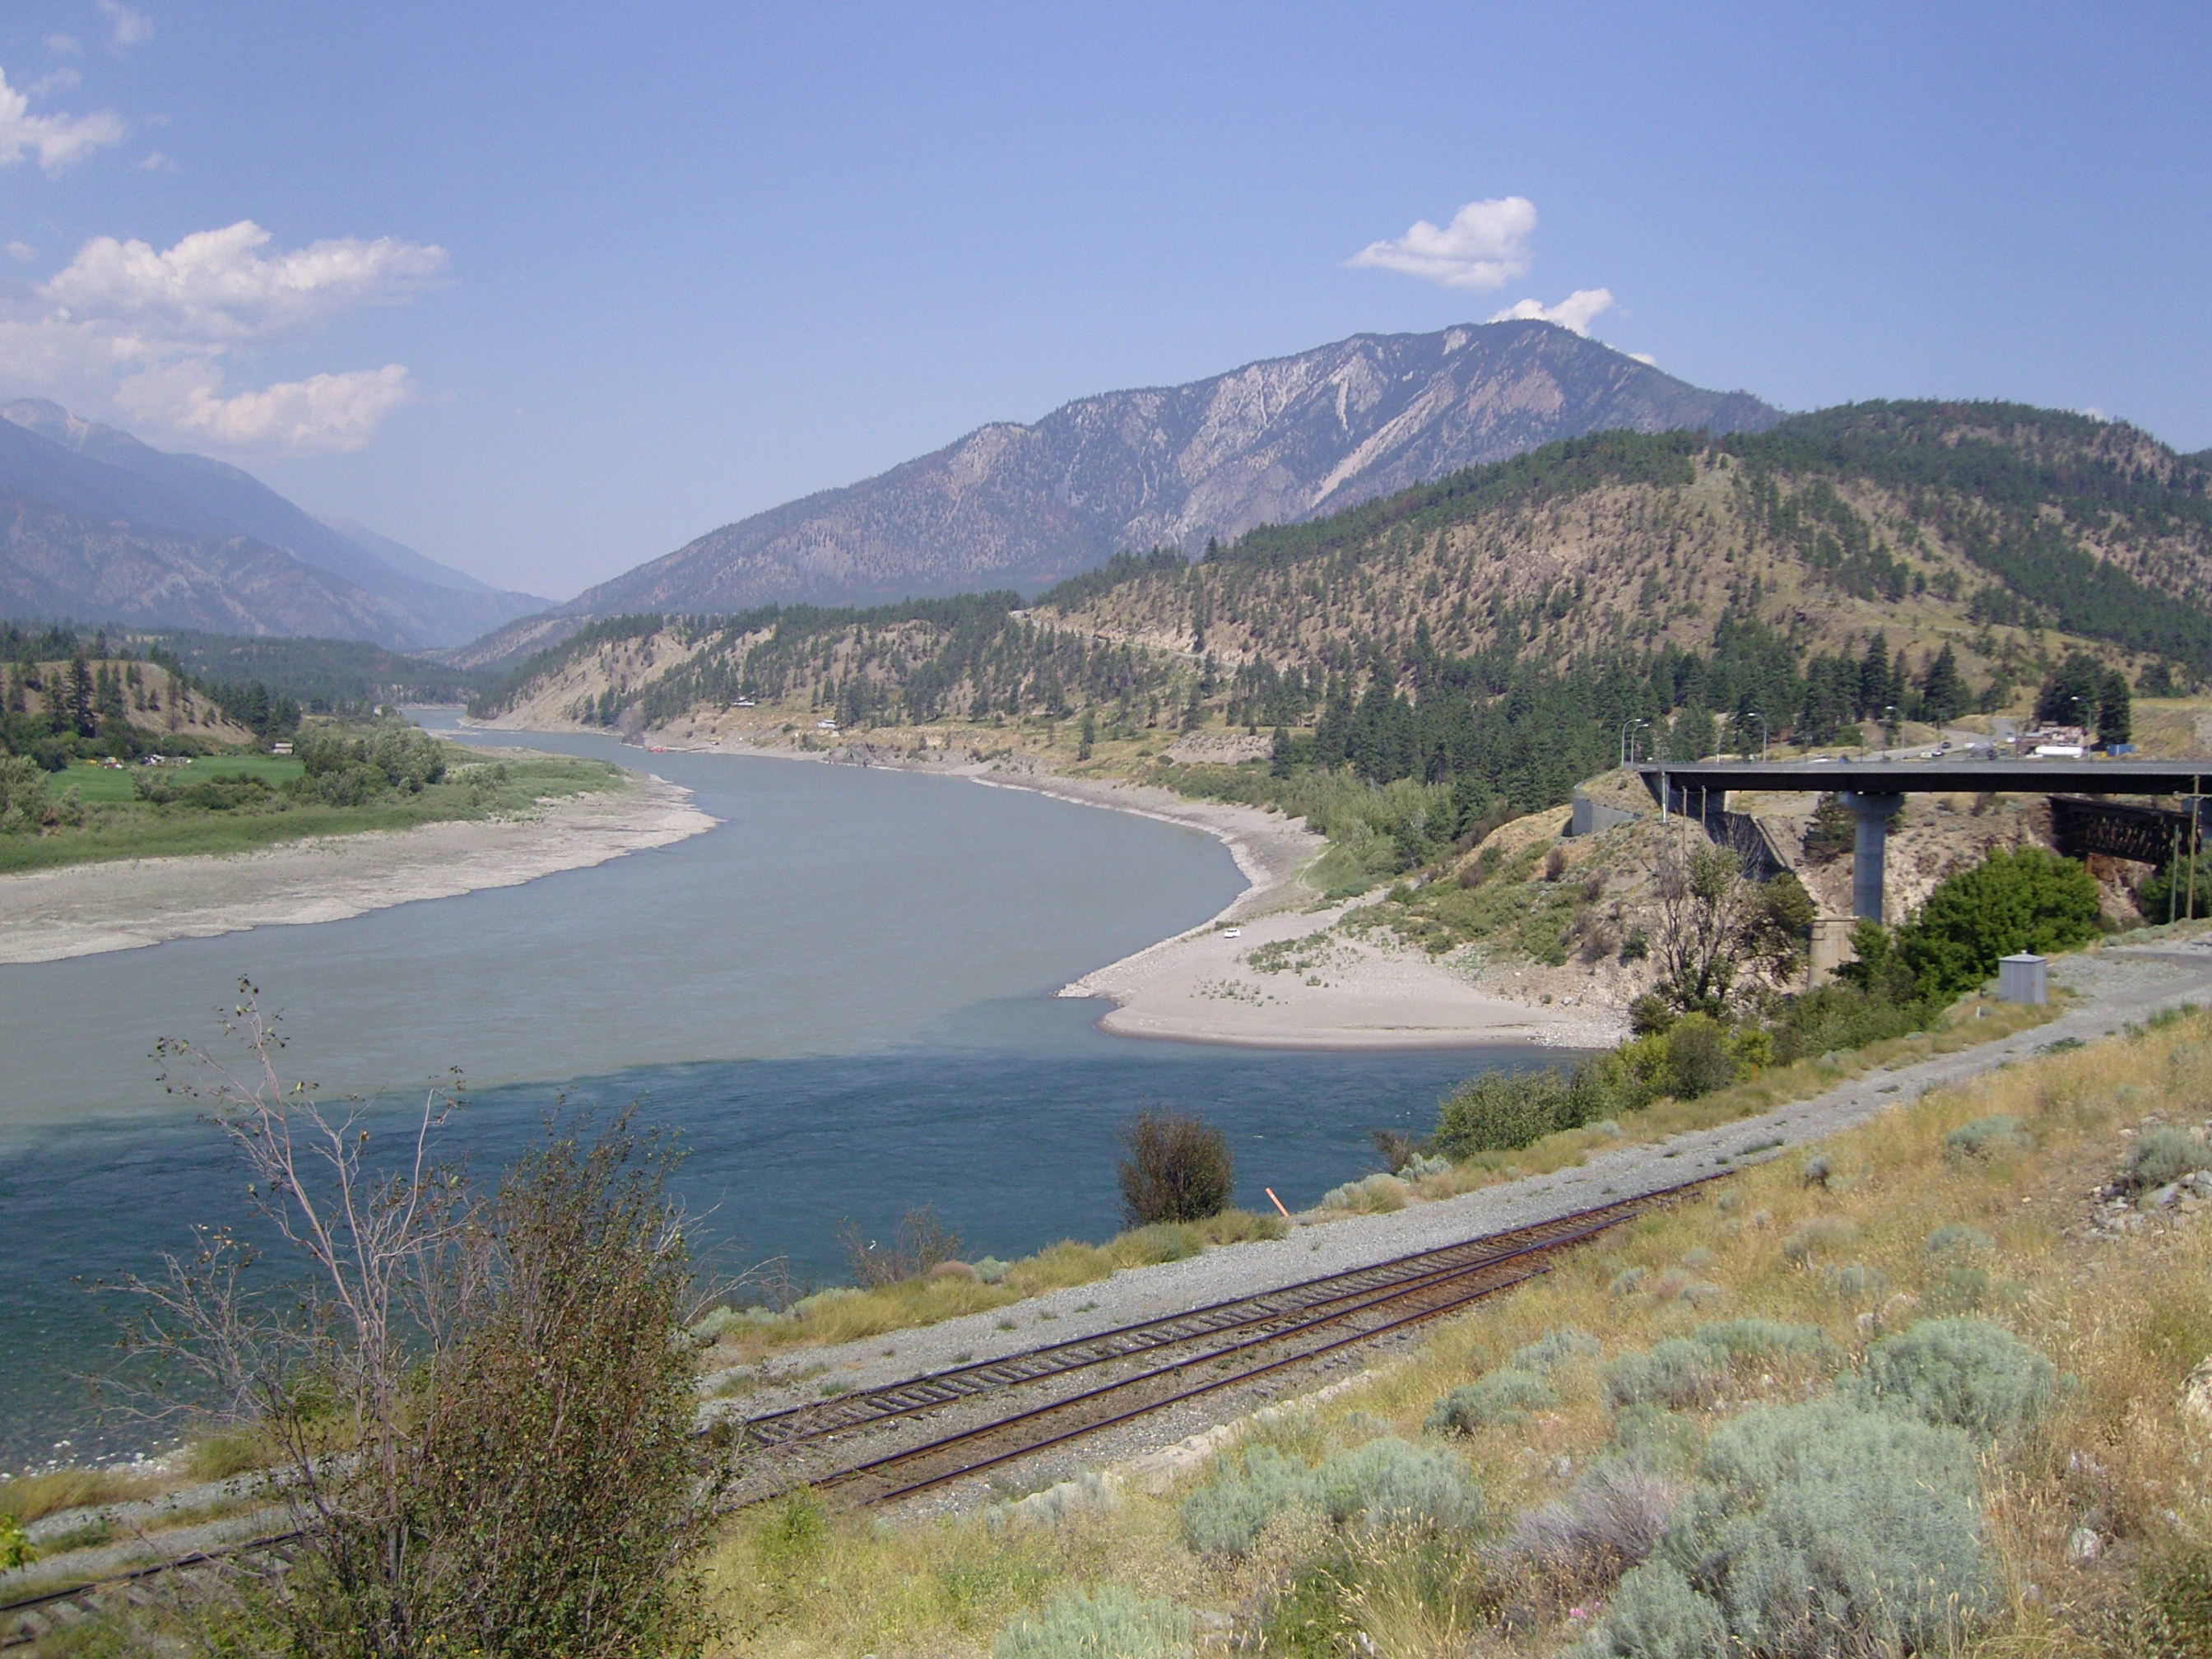
The six ecosystem zones exhibit distinct human and environmental heterogeneity. The BWBS zone has the largest area, covering BC’s section of Canada’s boreal forests. The summers are short but warm, and receive moderate levels of precipitation with some longitudinal variation. The BWBS zone is one of the least inhabited but supports several First Nations communities and natural resource hubs. The CWH zone occupies BC’s coastline, which receives the most precipitation in the province and supports BC’s temperate rainforests (Pojar et al. 1987). There is clustering of human development in the southern section of the CWH zone, including Vancouver, a provincial centre of commerce and culture. The ICH zone occupies the wettest region of the interior with the bulk of the zone on the windward side of the Columbia Mountains (Wong et al. 2004). The summers are typically warm and dry, though in comparison to other interior regions, the ICH receives notably more precipitation. Human development in the ICH is concentrated in the south, and includes the cities of Nelson and Trail, among others. The PPBGIDF zone is in the southern rain shadow of BC’s Coast Mountains, and is the hottest and driest of BC’s ecosystem zones during the summer (Pojar et al. 1987). The desirable summer temperatures and prominent natural resources result in a relatively large human footprint dominated by tourism, agriculture and forestry. The PPBGIDF zone includes the economic centre of BC’s interior, including the cities of Kamloops and Kelowna. The SBPS and SBS are the sub-boreal regions of the province, with the SBPS occupying a small region of the cold, high plateaus. The rain shadow from the Coast Mountains results in dry conditions almost year round, making this the second driest zone in the study. The cold climate limits agriculture and forestry resulting in only small communities and resource towns. The SBS zone neighbours the SBPS zone to the east and north, and has a slightly warmer temperature and more precipitation (Meidinger and Pojar 1991). The SBS zone is an important forestry hub for the province, spawning many resource communities and population centres, such as Prince George.
Data analysis
We developed Poisson and negative binomial generalised linear models (GLMs) for each ecosystem zone to model human-caused fire ignition counts for the period 1990–2013 against a set of human influence and biophysical variables (Table 2) representing potential ignition sources, resources to burn and conditions for burning.

|
Data for statistical models were collected at 10 × 10-km resolution resulting in 5428 sample cells, capturing the sum in fire activity over a 24-year period between 1990 and 2013. We chose the spatial and temporal resolution as a trade-off between an area able to capture variability of the drivers of the fire ignitions while generating a large enough sample size to produce robust statistical models. The 24-year study period represented an era when fire data collection methods were relatively consistent in BC and reflect a contemporary fire regime, the focus of our study. For each cell, we extracted counts of human-caused fire occurrence (sum count over the study period), as well as explanatory variables from existing datasets (Table 2). We chose the list of candidate human and biophysical variables due to their representation of fire behaviour and occurrence, and demonstrated use in previous studies in North America (Sturtevant and Cleland 2007; Syphard et al. 2007; Littell et al. 2009; Faivre et al. 2014). For a detailed description of the data compilation for statistical modelling, consult the online supplementary materials. The supplementary materials also include methods of mapping the WUI from Canada-wide land cover and 2011 Canadian census data, similar to a method first outlined in Radeloff et al. (2005).
Sample grids were assigned to respective ecosystem zones using maximum area tools in ArcGIS 10.1 (ESRI 2013). All data processing was done in ArcGIS 10.1 and data analysis was completed in the R statistical package (R Core Team 2013).
The focus of the study was to interpret the importance of each explanatory variable in each ecosystem zone and compare effects among zones, which can be difficult when dealing with variables in different units. Thus, we scaled the data by centring and standardising all explanatory variables by subtracting each variable’s mean and dividing by its standard deviation. Scaling preserves the relationship of the data, but converts all respective units to measures of their standard deviations rather than individual units (Schielzeth 2010). The standardised regression coefficients, or β coefficients, are directly comparable (Schielzeth 2010).
Regarding statistical modelling, when overdispersion was detected in fire data for a particular ecosystem zone, we used a negative binomial GLM that provides an extra parameter θ for estimating the overdispersion. We did not include interaction terms because the number of potential interactions occurring between the 17 explanatory variables would be relatively high and we had no a priori expectations for interactions among particular variables. We also excluded non-linear (e.g. quadratic) terms, as interpretations in multiple regression can be difficult where statistical effects are marginal and this is beyond the scope of this study.
We checked for correlation among variables, which can provide misleading estimates in multiple regression (Zuur et al. 2009), based on Spearman’s rank correlation tests. If we found two or more potential explanatory variables with a Spearman’s correlation greater than 0.7, we ran bivariate Poisson models of each against our fire count variable and discarded the terms with the lowest proportional deviance explained. We also examined the variance inflation factor (VIF) for each term in our final model. If explanatory variables had a VIF >10, we examined the two or more terms using bivariate regression and dropped the explanatory variable explaining the least variation in human-caused ignitions.
To select the best subset of explanatory variables for the final model for each ecosystem zone, we used backwards stepwise selection based on Akaike’s Information Criterion (AIC), which values parsimonious models and penalises for complexity. We also calculated a measure of variable importance by removing each term from the final model and calculating the relative contribution to the final AIC value, that is, the ΔAIC; the higher the ΔAIC, the more important the variable in the model.
After final model selection, we performed various model diagnostics to evaluate the model fitness, assess distributional assumptions and examine trends in the data. We examined residual spatial autocorrelation by using spline correlograms measuring positive or negative correlation of residuals. We also examined the amount of variability explained by each model using the proportional deviance explained, also referred to as D2, which is a similar metric to linear regression’s coefficient of determination, R2.
We employed an averaging technique to combine two measures of variable importance, the β coefficients (β) and ΔAIC, into a final ranking similar to methods in Syphard and Franklin (2009) and Bar-Massada et al. (2013). First, we selected the top six variables in the final model for each ecosystem zone and ranked these variables according to the two measures of variable importance, a weighting from 1 to 6. We chose the top six variables because this was the average number of final terms throughout all of the models. If one variable was present in the top six terms of one importance ranking (e.g. in the ΔAIC rank) but absent in the other (e.g. the β rank), we assigned a rank of two times the number of final terms for a maximum rank of 12. We considered this a simple and reasonable penalisation for inconsistent results between the two measures of variable importance. We then averaged the ranks between the β coefficient and AIC ranking to develop a final ranking system for all zones and ranking for each zone.
There are numerous ways in which our modelling approach could be improved. Nearly all variables we included in our models, although representing the full 24-year fire dataset, are an annual snapshot. For example, land cover data are a measure of one year, which we chose as a balance between reducing lengthy processing times and acquiring spatially explicit variables. We also used vegetation types in statistical modelling, but acknowledge the importance of specific fuel types in the fire ignition process. For example, dry fine fuels are the primary fuel type needed for a successful ignition and areas with high levels of dry fine fuels, such as grasslands, are typically more fire prone than areas with higher overall fuel loads, such as temperate rainforests, even accounting for variation in local climate (Pyne 1984). Though fuel types are important for the prediction of fire occurrence for fire management, the nature of our research question relies on examining the fire patterns on a longer temporal scale and coarser spatial scale. We opted to focus on the effects of general types of vegetation in determining variable importance and asking our research questions.
Results
There were 16 596 human-caused fires in 5428 sampling units within the six ecosystem zones. The PPBGIDF zone group had the highest average number of human-caused fires with 13.38 (s.d. = 18.10; Table 1) per 100 km2 sampling unit over 24 years. The BWBS, the largest and most remote zone, averaged the lowest number of fires, with 0.87 (s.d. = 2.58) per unit area and time. The SBPS, ICH, SBS and CWH zones all had similar averages: 3.01 (s.d. = 8.83), 2.48 (s.d. = 4.10), 2.42 (s.d. = 4.21) and 2.40 (s.d. = 6.76).
All models showed evidence of overdispersion and were fit using a negative binomial distribution. There was minor but significant residual spatial autocorrelation at short lag distances that we report but do not consider further. The models explained a substantial amount of variability. The proportional deviance explained, referred to as D2, is a measure of variability explained; 1.00 represents all variability explained and 0.00 represents none. D2 values ranged from 0.39 to 0.62 for the six models (see Tables S1–S6 in supplementary material available online), with BWBS having the highest value at 0.62 and CWH, the second highest with 0.50. PPBGIDF had a D2 value of 0.42, and the remaining three zones all had a value of 0.39.
Our first objective was to determine which human influence variables were important for quantifying spatial variability in human-caused fire in BC, and how these variables differed among ecosystems. Overall, WUI was the most frequently retained variable in the final models (Fig. 2; Table 2) and significant in all zones except the CWH. Rec areas was the second-most retained human influence variable, being significant in three zones: BWBS, CWH and SBS. Logging, Unpaved and Paved were all significant in two zones (Logging in BWBS and ICH; Unpaved in BWBS and SBPS; Paved in BWBS and SBS), whereas Trail and Rangelands were only retained respectively in the models for ICH and SBS. Table 2 provides the measures of variable importance with raw β coefficients and ΔAIC for each explanatory term. Details of the final models for each ecosystem zone are presented in Tables S1–S6. The following paragraphs provide detailed model results for each of the six ecosystems zones in alphabetical order.
|
For the BWBS zone, human influence variables were very important in controlling spatial patterns of human-caused fire ignition. The WUI, Logging, Unpaved and Paved variables were retained in the final model and were top variables in the average ranking system (Table S1). WUI had the largest β coefficient (Table 2; β = 1.94; s.e. = 0.19) and the second-largest ΔAIC. Logging had the largest ΔAIC and the third largest β coefficient (β = 0.79; s.e. = 0.10). Only one biophysical variable, Slope, was in the top six most important variables in BWBS according to average ranking.
For the CWH zone, human-caused fire occurrence was largely controlled by biophysical variables and no human influence variables were in the top six in either of the two rankings. Summer temp and Summer PPT were retained in the final model and tied as the most important variables according to the average ranking (Table S2), with both variables being ranked either first or second according to β coefficients or ΔAIC. Summer temp had the highest β coefficient (β = 1.22; s.e. = 0.13), and Summer PPT had the highest ΔAIC and second highest β coefficient (β = −0.71; s.e. = 0.06).
The model for the ICH zone retained a combination of human influence and biophysical variables. Summer temp had the highest average rank (Table S3), with the highest ΔAIC and second highest β coefficient (β = 1.12; s.e. = 0.09). Mixedwood had the highest β coefficient (β = −1.17; s.e. = 0.28) and the third highest ΔAIC. WUI was the highest human influence variable, ranking third overall, with the second highest ΔAIC and third highest β coefficient (β = 0.31; s.e. = 0.05). Logging was consistently ranked fourth between ΔAIC and β coefficients (β = 0.17; s.e. = 0.04).
For the PPBGIDF zone, biophysical variables were significant explanatory variables and were important for both ranking systems. The top four variables, all of which were biophysical, tied for the top ranking as there were inconsistencies between ΔAIC and β coefficient ranks (Table S4). The top variables were Conifer, Summer temp, Summer PPT and Shrub. Shrub had the highest ΔAIC, but only the fifth highest β coefficient (β = 0.38; s.e. = 0.05). Summer PPT had the highest β coefficient (β = −0.77; s.e. = 0.15), but only the fifth highest ΔAIC. Conifer was ranked the same in all rankings, being the third most important for both ΔAIC and β coefficient (β = 0.42; s.e. = 0.07). Summer Temp had the second highest β coefficient (β = 0.55, s.e. = 0.10), but only the fourth highest ΔAIC rank. WUI was the highest human influence variable and narrowly missed being tied with the top four variables, with the second highest ΔAIC but only the sixth highest β coefficient (β = 0.14; s.e. = 0.16).
For the SBPS zone, no disagreements were found between the two measures of variable importance (Table S5). WUI was the consensus top variable and one of two human influence variables retained. WUI obtained the highest ΔAIC rank and highest β coefficient (β = 4.90; s.e. = 1.10). The variable Summer PPT was ranked second for both ΔAIC and β coefficient ranks (β = −1.44; s.e. = 0.28). Decid was the third most important variable for both ΔAIC and β coefficients (β = 1.11; s.e. = 0.27). Unpaved was the only other human variable retained, ranking fourth for both AIC and β coefficient (β = 0.29; s.e. = 0.10).
For the SBS zone, Paved was the consensus top variable (Table S6), ranking first in both ΔAIC and β coefficient (β = 1.06; s.e. = 0.13). Decid (β = 0.44; s.e. = 0.06) and Shrub (β = 0.51; s.e. = 0.08) tied for the next most important variable, with Conifer (β = 0.62; s.e. = 0.15) and SW (β = 0.32; s.e. = 0.04) being tied to round out the top five variables. Rangelands (β = 0.93; s.e. = 0.31) was the second-most important human influence variable and ranked sixth overall.
The second objective was to assess the effect size of each human influence variable across the study area as a whole to better understand the relative influences of human activity on human-caused fire occurrence. Our quantification of influence was based on the averaged ranking system, similar to above, but here summarising only the human influence variables (Table 3). The rank order of variables was: WUI > Paved > Logging > Rec areas > Trail. The variable Rec areas, though consistently retained in many models across ecosystem zones, had little marginal effect, ranking 13th overall in influence. Trail was the least influential variable across all regions, being dropped everywhere expect ICH. All human influence variables had a positive effect on human-caused ignitions except Trail in the ICH zone, which was negative.

|
The third objective was to assess how the statistical effects of human influence varied among ecosystem zones. The BWBS model contained the most human variables, retaining five out of the seven potential options, and had the highest average rank for human variables, meaning it was the ecosystem zone where the effect sizes were the strongest. The SBS model retained the second highest number of human variables, keeping four variables, and had the third highest average rank. The zones where the statistical effect size of human influence was lowest were CWH and PPBGIDF, both retaining just one variable each: Rec areas and WUI, respectively; CWH and PPBGIDF also had the lowest ranks of human influence variables, last and second last, respectively. In fact, the relative importance of human influence variables tends to decrease with increasing WUI (Fig. 3). The BWBS and SBS zones had the lowest proportions, but strongest effects, of WUI. In contrast, areas with the highest proportions of WUI, PPBGIDF and CWH were areas where the human-caused fire occurrence was largely controlled by biophysical variables.
|
Discussion
Drivers of human-caused fire vary among ecosystem zones in BC, and contrary to what we expected, human influence variables had the strongest statistical effects in more remote areas. We expected fire to be controlled most strongly by human influences in areas with the highest human-caused fire density and greatest human footprint, as has been found in places with human-dominated fire regimes (e.g. Sturtevant and Cleland 2007; Syphard et al. 2007); however we found the opposite. The PPBGIDF (ponderosa pine, bunchgrass, interior Douglas-fir) and CWH (coastal western hemlock) are the most populated zones and contain the highest proportion of WUI and paved road densities in our study, but both zones retained only one human influence variable and, when retained, it had the lowest ranks of influence. In contrast, BWBS and SBS are some of the least developed of the ecosystem zones in the study with low mean paved road density and low proportions of WUI, but had the most human influence variables retained in models, with the highest averaged rank. The variability in key controls of human-caused fire forms a synthesis for understanding the spatial dynamics of fire in large heterogeneous regions with the potential to influence how fire management is implemented.
The differences in key drivers of human-caused fire occurrence across a gradient of human influence shares conceptually similar findings with the global-scale varying constraints hypothesis outlined by Krawchuk and Moritz (2011). In our work, dominant limiting factors of human-caused fire occurrence vary in a predictable way. Human influence factors are more important in explaining the long-term spatial variability of fire occurrence in areas where the human footprint is generally lower. By comparison, human-caused fire occurrence in areas with a larger human footprint is regulated by variables that explain the fuel’s ignition potential. The fire regime triangle provides a good model for interpreting our results, where the three sides of the triangle – ignitions, climate and vegetation – help explain the controls of a fire regime. The relatively urbanised dry southern interior, the PPBGIDF, has summers that are hot and dry, and potential human ignition sources are in abundance. Human-caused fire occurrence appears to be more strongly controlled by patterns of flammable fine fuels rather than sources of human-caused ignitions, which are relatively widespread in the environment. The PPBGIDF model results reflect this idea: four variables explaining the spatial variability in dry, fine fuel conditions (Conifer, Summer temp, Summer PPT, Shrub) tied as most important in explaining spatial variability in human-caused fire. Conifer, Summer temp and Shrub all had positive associations with the number of fires, whereas Summer PPT was negatively associated. By comparison, the boreal forest (BWBS) in the north-east of BC has relatively few people and our models suggested that spatial variability of potential ignition sources is the major limiting factor for human-caused fire in this remote region. In the BWBS, all variables accounting for the presence or movement of potential human ignition sources far outweighed any other biophysical variables in determining the spatial variability in fire. Parisien et al. (2016)’s continental analysis of the human influence on wildfire reinforces our findings on the heterogeneity of driving factors. Although human indices were associated with fire across North America, the effect of human influence was found to be less in some of the more human-altered regions.
Fire occurrence in moist forests was largely controlled by variables representing fire-conducive conditions. The coastal temperate rainforests of BC, the CWH, have large human populations in some regions of the zone, and the second highest proportion of WUI of the ecosystem zones; fuels and climate would control fire occurrence, not variables measuring human activity. Regardless of fire cause, fire ignition in wet forests is often constrained by climatic factors, as the high levels of precipitation act as a major regulator of ignitability and combustibility of fuel, and thus fire occurrence (Pyne 1984; Flannigan et al. 2009). The fact that summer temperature, with a positive association and precipitation, with a negative association, were top variables in the CWH model reinforced the documented climatic controls of fire patterns in wet forests. The ICH is another notable wet region in BC and, as such, would be presumed to have similar controlling factors to human-caused ignitions as would CWH. However, the zone receives less precipitation and has lower levels of human development; accordingly we observed a larger effect of human influence variables. Strong positive associations with summer temperature and vegetation type were also found, and significant but weak positive effects from timber harvesting and the WUI.
The sub-boreal regions SBPS and SBS offered mixed support for our developing synthesis of spatial variability in the limiting factors of human-caused ignitions. In the more remote and higher plateau of the SBPS, the dry climate and small human footprint suggest variation in ignitions sources (e.g. human factors) are likely the key limiting factor in the region. Proportion of WUI, though low in the zone, had a large effect size in both measures of variable importance and reflects WUI’s strong positive association with human-caused ignitions. The small number of human influence variables retained in the final model is most likely indicative of the undeveloped and undiversified human footprint in the ecosystem: the two human influence variables, WUI and unpaved road density, most likely account for the bulk of the spatial variability describing human ignition sources in the region.
The large, sub-boreal spruce region, the SBS, is heterogeneous with a range of human influences. Spatial pattern of fire in the zone appears to have a balance of explanatory power from both human influence and biophysical constraints. Paved road density was the top variable explaining human-caused ignitions. Paved road density’s large effect might reflect both the level of human development, as the metric of human presence, but also the accidental ignition of fires while re-creating near roads. After accounting for human-caused ignition sources, fire in the SBS appears to be limited by flammable fuels, because the next tier of important variables are all vegetation types.
Our WUI metric was the most important variable across all regions. The WUI metric clearly captured the bulk of human–fire interactions, supporting existing findings in other parts of North America showing that the edge of human development and specific housing patterns are strong predictors of human-caused ignition (Syphard et al. 2007; Hawbaker et al. 2013; Faivre et al. 2014). The WUI was ranked as the top variable in the average ranking system across all regions, meaning that, when included, it had some of the largest effect sizes in the models. Our modelling approach used multiple regression analyses, where term coefficients are marginal, that is, the effect of a variable after accounting for all other variables. The marginal effect of the WUI might be stronger than other human influence variables, as WUI can potentially capture other human–fire interactions – for example, escaped campfires or logging fires, which can cluster around small levels of housing development. The lack of significant human influence variables in previous research focused on human-caused fires in BC, such as in Magnussen and Taylor (2012), might be explained by the exclusion of WUI or other housing-related metrics in their analyses, although we understand that the focus of their research was on daily variations in fire and weather that require examinations of fine-scale dynamic processes. We strongly advise the inclusion of a WUI-type metric in future research and analysis on human-caused fire on multiple spatial and temporal scales to account for ignition source potential.
Metrics for recreational activities were positively associated with the number of human-caused ignitions, and likely represent the contribution of hiking, camping and hunting activities to human-caused wildfire. The proportion of recreational areas was the second-most retained human influence variable, important in the three largest zones: BWBS, SBS and CWH. However, when retained, the variable had little effect, most likely capturing a small but significant number of fires related to recreational activities in these large, diverse regions. In hindsight, the recreational areas explanatory variable likely misses important areas where popular recreational activities occur, for example, undesignated crown lands. A re-analysis with an expansive dataset with all types of recreational areas might lead to different conclusions with stronger effect sizes when the variables were retained.
Metrics representing forest industry activity were positively associated with human-caused fire. Proportion of timber harvesting areas was retained in two zones, BWBS and ICH. The BWBS has a relatively small harvesting footprint; the fact that proportion of timber harvesting is relatively low in the boreal region highlights how sensitive the region could be to a slight increase in industry footprint, although the variable could be retained in final models as a result of the overall low population density in the remote boreal regions of BC and not a signal of timber harvesting. In the ICH, the significant effect of harvest activity likely reflects the extensive, but heterogeneous forestry footprint in the region. The ICH has a productive forestry industry (Meidinger and Pojar 1991), and the presence of increased ignition sources related to the industry likely has a significant effect on human-caused fire occurrence in the region. The absence of a significant association from harvesting in the heavily logged CWH zone possibly supports existing research that the spatial variability in ignitions in very moist regions is largely controlled by variables related to climate (Lindenmayer et al. 2009). Landscapes harvested for timber can be associated with human activity and therefore an increased potential for human-caused ignitions, but also with changes to the microclimate of the area and fuel characteristics (Lindenmayer et al. 2009). Many of the changes attributed to harvesting operations in western North America have increased flammability of sites, at least in the near term (Donato et al. 2006; Krawchuk and Cumming 2009), specifically with dry dead slash accumulation that is highly flammable (Dodge 1972; Lindenmayer et al. 2009). In our unpublished results, proportion of timber harvesting sites was retained with a positive association in lightning-caused fire models for both BWBS and ICH using the same subset of human influence and biophysical variables.
Although human-caused wildfires have the potential to become large and influential for both human and ecological systems, it is important to note that the majority of human-caused fires are typically smaller than lightning-caused fires. The fuel structure and connectivity required for a fire to spread is often fragmented or treated in the locations where human-caused fires occur. Additionally, human-caused fires cluster around patterns of human development that have infrastructure, such as roads, that allows wildfire suppression teams to gain access and halt active fires, creating what is sometimes called the WUI fire paradox. Fire management at the WUI, such as fuel reduction treatments and restricted fire zones adjacent to human settlements, influence fire occurrence and fire size. Research has identified an overall negative linear relationship between fire probability and mean fire size across much of the globe, as increases in anthropogenic variables tend to decrease the size of fires (Hantson et al. 2015; Parisien et al. 2016). Fire management and suppression effects were not captured in our analyses. An analysis of large, human-caused fires is a logical next step for future research that would allow us to determine if large fires show different drivers from all human-caused fires considered together.
Our research expands on the increasing understanding of the drivers of spatial variation in human-caused fire occurrence and shows that the importance of specific socioecological drivers vary based on levels of human development. In areas with high levels of human development, our models suggest spatial patterns in human-caused fire occurrence will typically be more strongly controlled by variables related to climate and fuel structure. In contrast, areas with little human development may be particularly sensitive to future development that will increase the number of ignition sources. WUI-type metrics provide important and strong characterisation of spatial patterns in human-caused fire potential, regardless of the regional characteristics. Our work contributes to a synthesis on the constraints of wildfire for an uncertain future where expansion of human development (Theobald and Romme 2007) and climate change (Flannigan et al. 2009) create complex and evolving human–fire interactions.
Acknowledgements
We thank the creative minds at the Landscape and Conservation Science Research Group – specifically Kim House, Michael Ton, Marc Edwards, Anna Talucci and Kurt Frei – who provided valuable insight and expertise in helping craft our research. Funding for PEC was provided by Simon Fraser University, and NSERC DG and Engage grants to MAK. We thank Daniel Perrakis (BC Wildfire Service) for insightful review of this work.
References
Bar Massada A, Syphard AD, Stewart SI, Radeloff VC (2013) Wildfire ignition-distribution modelling: a comparative study in the Huron–Manistee National Forest, Michigan, USA. International Journal of Wildland Fire 22, 174–183.| Wildfire ignition-distribution modelling: a comparative study in the Huron–Manistee National Forest, Michigan, USA.Crossref | GoogleScholarGoogle Scholar |
Bar-Massada A, Radeloff VC, Stewart SI (2014) Biotic and abiotic effects of human settlements in the wildland–urban interface. Bioscience 64, 429–437.
| Biotic and abiotic effects of human settlements in the wildland–urban interface.Crossref | GoogleScholarGoogle Scholar |
GeoBC [formerly Base Mapping and Geomatics Services Branch] (2002) Gridded Digital Elevation Model product specifications, 2nd edn. December 2002. Victoria, BC.
BC Wildfire Service (2013) Fire incident locations – historical. Ministry of Forests, Lands and Natural Resources Operations. Victoria, BC. Available at http://catalogue.data.gov.bc.ca/dataset/fire-incident-locations-historical [Verified 3 February 2017]
Canadian Interagency Forest Fire Centre (CIFFC) (2003) The 2003 glossary of forest fire management terms. Available at http://www.salmonarmmuseum.org/docs/2003_fire_glossary.pdf [Verified 23 January 2017]
Cardille J, Ventura S, Turner M (2001) Environmental and social factors influencing wildfires in the Upper Midwest, United States. Ecological Applications 11, 111–127.
| Environmental and social factors influencing wildfires in the Upper Midwest, United States.Crossref | GoogleScholarGoogle Scholar |
Dodge M (1972) Forest fuel accumulation – a growing problem. Science 177, 139–142.
| Forest fuel accumulation – a growing problem.Crossref | GoogleScholarGoogle Scholar | 1:STN:280:DC%2BC3cvgslGmsQ%3D%3D&md5=1d03778c5638381e4ba047357940066aCAS |
Donato DC, Fontaine JB, Campbell JL, Robinson WD, Kauffman JB, Law BE (2006) Post-wildfire logging hinders regeneration and increases fire risk. Science 313, 615
| Post-wildfire logging hinders regeneration and increases fire risk.Crossref | GoogleScholarGoogle Scholar | 1:CAS:528:DC%2BD28Xnsl2htrc%3D&md5=e38a5d06f75b13c88e32f2ee4dee9247CAS |
ESRI (2013) ArcGIS Desktop: Release 10.2. Environmental Systems Research Institute, Redlands, CA.
Faivre N, Jin Y, Goulden ML, Randerson JT (2014) Controls on the spatial pattern of wildfire ignitions in Southern California. International Journal of Wildland Fire 23, 799–811.
| Controls on the spatial pattern of wildfire ignitions in Southern California.Crossref | GoogleScholarGoogle Scholar |
Flannigan MD, Krawchuk MA, de Groot WJ, Wotton BM, Gowman LM (2009) Implications of changing climate for global wildland fire. International Journal of Wildland Fire 18, 483–507.
| Implications of changing climate for global wildland fire.Crossref | GoogleScholarGoogle Scholar |
GeoBC (2013a) Digital road atlas (DRA) – demographic partially-attributed roads. Ministry of Forests, Lands and Natural Resource Operations. Available at http://catalogue.data.gov.bc.ca/dataset/digital-road-atlas-dra-demographic-partially-attributed-roads [Verified 03 February 2017]
GeoBC (2013b) Baseline thematic mapping present land use version 1 spatial layer. Ministry of Forests, Lands and Natural Resource Operations. Available at http://catalogue.data.gov.bc.ca/dataset/baseline-thematic-mapping-present-land-use-version-1-spatial-layer [Verified 03 February 2017]
Girardin MP, Wotton BM (2009) Summer moisture and wildfire risks across Canada. Journal of Applied Meteorology and Climatology 48, 517–533.
| Summer moisture and wildfire risks across Canada.Crossref | GoogleScholarGoogle Scholar |
Government of Canada Natural Resources Canada/Earth Sciences Sector/Canada Centre for Remote Sensing (2012) Canada 250m land cover time series 2000–2011. Ottawa, ON.
Hammer RB, Radeloff VC, Fried JS, Stewart SI (2007) Wildland–urban interface housing growth during the 1990s in California, Oregon, and Washington. International Journal of Wildland Fire 16, 255–265.
| Wildland–urban interface housing growth during the 1990s in California, Oregon, and Washington.Crossref | GoogleScholarGoogle Scholar |
Hantson S, Lasslop G, Kloster S, Chuvieco E (2015) Anthropogenic effects on global mean fire size. International Journal of Wildland Fire 24, 589–596.
| Anthropogenic effects on global mean fire size.Crossref | GoogleScholarGoogle Scholar |
Hawbaker TJ, Radeloff VC, Stewart SI, Hammer RB, Keuler NS, Clayton MK (2013) Human and biophysical influences on fire occurrence in the United States. Ecological Applications 23, 565–582.
| Human and biophysical influences on fire occurrence in the United States.Crossref | GoogleScholarGoogle Scholar |
Krawchuk MA, Cumming SG (2009) Disturbance history affects lightning fire initiation in the mixedwood boreal forest: observations and simulations. Forest Ecology and Management 257, 1613–1622.
| Disturbance history affects lightning fire initiation in the mixedwood boreal forest: observations and simulations.Crossref | GoogleScholarGoogle Scholar |
Krawchuk MA, Moritz MA (2011) Constraints on global fire activity vary across a resource gradient. Ecology 92, 121–132.
| Constraints on global fire activity vary across a resource gradient.Crossref | GoogleScholarGoogle Scholar |
Kulig JC, Kimmel A, Gullacher A, Reimer B, Townshend I, Edge DS, Lightfoot N, McKay M, Barnett M, Clague J, Coghlan A (2013) McLure Fire: lessons learned. Available at http://www.ruralwildfire.com [Verified 03 February 2017]
Lindenmayer DB, Hunter ML, Burton PJ, Gibbons P (2009) Effects of logging on fire regimes in moist forests. Conservation Letters 2, 271–277.
| Effects of logging on fire regimes in moist forests.Crossref | GoogleScholarGoogle Scholar |
Littell JS, McKenzie D, Peterson DL, Westerling AL (2009) Climate and wildfire area burned in western U.S. ecoprovinces, 1916–2003. Ecological Applications 19, 1003–1021.
| Climate and wildfire area burned in western U.S. ecoprovinces, 1916–2003.Crossref | GoogleScholarGoogle Scholar |
Magnussen S, Taylor SW (2012) Prediction of daily lightning- and human-caused fires in British Columbia. International Journal of Wildland Fire 21, 342–356.
| Prediction of daily lightning- and human-caused fires in British Columbia.Crossref | GoogleScholarGoogle Scholar |
Meidinger DV, Pojar J (1991) Ecosystems of British Columbia. Ministry of Forests, Research Branch, Victoria, BC.
Meyn A, Schmidtlein S, Taylor SW, Girardin MP, Thonicke K, Cramer W (2013) Precipitation-driven decrease in wildfires in British Columbia. Regional Environmental Change 13, 165–177.
| Precipitation-driven decrease in wildfires in British Columbia.Crossref | GoogleScholarGoogle Scholar |
Moritz MA, Morais ME, Summerell LA, Carlson JM, Doyle J (2005) Wildfires, complexity, and highly optimized tolerance. Proceedings of the National Academy of Sciences of the United States of America 102, 17912–17917.
| Wildfires, complexity, and highly optimized tolerance.Crossref | GoogleScholarGoogle Scholar | 1:CAS:528:DC%2BD2MXhtlersr7L&md5=16bcf250343cc7b1dadbcaac78f181adCAS |
Naficy C, Sala A, Keeling E (2010) Interactive effects of historical logging and fire exclusion on ponderosa pine forest structure in the northern Rockies. Ecological Applications 20, 1851–1864.
| Interactive effects of historical logging and fire exclusion on ponderosa pine forest structure in the northern Rockies.Crossref | GoogleScholarGoogle Scholar |
Narayanaraj G, Wimberly MC (2012) Influences of forest roads on the spatial patterns of human- and lightning-caused wildfire ignitions. Applied Geography (Sevenoaks, England) 32, 878–888.
| Influences of forest roads on the spatial patterns of human- and lightning-caused wildfire ignitions.Crossref | GoogleScholarGoogle Scholar |
Parisien MA, Miller C, Parks SA, DeLancey ER, Robinne FN, Flannigan MD (2016) The spatially varying influence of humans on fire probability in North America. Environmental Research Letters 11, 075005
| The spatially varying influence of humans on fire probability in North America.Crossref | GoogleScholarGoogle Scholar |
Pew KL, Larsen CPS (2001) GIS analysis of spatial and temporal patterns of human-caused wildfires in the temperate rain forest of Vancouver Island, Canada. Forest Ecology and Management 140, 1–18.
| GIS analysis of spatial and temporal patterns of human-caused wildfires in the temperate rain forest of Vancouver Island, Canada.Crossref | GoogleScholarGoogle Scholar |
Pojar J, Klinka K, Meidinger DV (1987) Biogeoclimatic ecosystem classification in British Columbia. Forest Ecology and Management 22, 119–154.
| Biogeoclimatic ecosystem classification in British Columbia.Crossref | GoogleScholarGoogle Scholar |
Pyne SJ (1984) ‘Introduction to wildland fire: fire management in the United States.’ (John Wiley & Sons: New York, NY).
R Core Team (2013) R: a language and environment for statistical computing. R Foundation for Statistical Computing, Vienna, Austria. Available at http://www.R-project.org/ [Verified 03 February 2017]
Radeloff VC, Hammer RB, Stewart S, Fried JS, Holcomb SS, McKeefry JF (2005) The wildland–urban interface in the United States. Ecological Applications 15, 799–805.
| The wildland–urban interface in the United States.Crossref | GoogleScholarGoogle Scholar |
Recreation Sites and Trails BC (2013) Recreation line. Ministry of Forests, Lands and Natural Resource Operations. Available at http://catalogue.data.gov.bc.ca/dataset/recreation-line [Verified 03 February 2017]
Reid SE, Marion JL (2005) A comparison of campfire impacts and policies in seven protected areas. Environmental Management 36, 48–58.
| A comparison of campfire impacts and policies in seven protected areas.Crossref | GoogleScholarGoogle Scholar |
Schielzeth H (2010) Simple means to improve the interpretability of regression coefficients. Methods in Ecology and Evolution 1, 103–113.
| Simple means to improve the interpretability of regression coefficients.Crossref | GoogleScholarGoogle Scholar |
Simon Fraser University – Geography (2015) Photo of Sub-Boreal Pine-Spruce biogeoclimatic zone. Available at http://www.sfu.ca/geog/geog351fall07/Group06/Pine/SpruceForest.jpg [Verified 3 November 2015]
Sturtevant BR, Cleland DT (2007) Human and biophysical factors influencing modern fire disturbance in northern Wisconsin. International Journal of Wildland Fire 16, 398–413.
| Human and biophysical factors influencing modern fire disturbance in northern Wisconsin.Crossref | GoogleScholarGoogle Scholar |
Syphard AD, Franklin J (2009) Differences in spatial predictions among species distribution modeling methods vary with species traits and environmental predictors. Ecography 32, 907–918.
| Differences in spatial predictions among species distribution modeling methods vary with species traits and environmental predictors.Crossref | GoogleScholarGoogle Scholar |
Syphard AD, Radeloff VC, Keeley J, Hawbaker TJ, Clayton MK, Stewart SI, Hammer R (2007) Human influence on California fire regimes. Ecological Applications 17, 1388–1402.
| Human influence on California fire regimes.Crossref | GoogleScholarGoogle Scholar |
Taylor SW, Parminter J, Thandi G (2005) Logistic regression models of wildfire probability in British Columbia. Forest Science Program Project Y05–012332, British Columbia Ministry of Forests Annual Technical Report Supplement 2, Victoria, BC.
Theobald DM, Romme WH (2007) Expansion of the US wildland–urban interface. Landscape and Urban Planning 83, 340–354.
| Expansion of the US wildland–urban interface.Crossref | GoogleScholarGoogle Scholar |
Wang X, Parisien MA, Taylor SW, Perrakis DD, Little J, Flannigan MD (2016) Future burn probability in south-central British Columbia. International Journal of Wildland Fire 25, 200–212.
| Future burn probability in south-central British Columbia.Crossref | GoogleScholarGoogle Scholar |
Wikipedia (2015a) Photo of Boreal White Black Spruce biogeoclimatic zone. Available at https://upload.wikimedia.org/wikipedia/commons/9/93/Taiga_Landscape_in_Canada.jpg [Verified 3 November 2015]
Wikipedia (2015b) Photo of Coastal Western Hemlock biogeoclimatic zone. Available at https://upload.wikimedia.org/wikipedia/commons/9/93/Taiga_Landscape_in_Canada.jpg [Verified 3 November 2015]
Wikipedia (2015c) Photo of Interior Cedar–Hemlock biogeoclimatic zone. Available at https://upload.wikimedia.org/wikipedia/commons/5/54/Glacier_np_canada.JPG [Verified 3 November 2015]
Wikipedia (2015d) Photo of Ponderosa Pine + Bunchgrass + Interior Douglas-fir biogeoclimate zone group. Available at https://upload.wikimedia.org/wikipedia/commons/a/af/Thomson_Frasier_Confluence_Lytton.JPG [Verified 3 November 2015]
Wikipedia (2015e) Photo of Sub-boreal Spruce biogeoclimatic zone. Available at https://upload.wikimedia.org/wikipedia/commons/thumb/7/7f/Prince_George_British_Columbia_2011.JPG/996px-Prince_George_British_Columbia_2011.JPG [Verified 3 November 2015]
Wong C, Dorner B, Sandmann H (2004) Historical variability of natural disturbances in British Columbia. Forrex Series 12, pp. 1–48 (Kamloops, BC).
Zuur AF, Ieno EN, Walker NJ, Saveliev AA, Smith GM (2009) Mixed effects models and extensions in ecology with R. (Springer: New York, NY).