

Vegetation and inundation characteristics of waterbird breeding sites in the Murray–Darling Basin, Australia
K. J. Brandis A * , R. J. Francis A and G. Bino A
A
Abstract
The Murray–Darling Basin serves as a crucial habitat for aggregating waterbirds; however, decades of large-scale regulation of rivers and water resources have adversely affected waterbird breeding in the Basin.
To understand the characteristics of wetlands that attract and support aggregating waterbirds, focusing on identifying environmental conditions conducive to waterbird breeding.
In total, 52 wetland sites across the Murray–Darling Basin, with high waterbird abundances, were identified, of which 26 supported waterbird breeding. Classification models were developed using temporally static and dynamic environmental datasets to discern wetland characteristics associated with waterbird breeding.
Analyses showed that wetlands supporting waterbird breeding contained a maximum inundated area of ‘other shrublands’ exceeding 3.635 km2 and variation in normalised difference vegetation index, possibly reflective of a ‘boom and bust’ ecological response.
Understanding the habitat requirements of wetlands to prompt waterbird breeding is critical for effective environmental water management and conservation strategies.
Targeted wetland management and environmental water allocation to support waterbird breeding populations in the Murray–Darling Basin is essential for continued waterbird breeding. There is a need for continued research to refine management strategies and ensure the long-term sustainability of waterbird populations in the face of ongoing environmental challenges.
Keywords: colonial waterbirds, conservation, inundation, Murray–Darling Basin, NDVI, river management, vegetation, waterbird breeding, wetland.
Introduction
Waterbirds are a fundamental component of aquatic and terrestrial ecosystems. In addition to their intrinsic values, they provide key ecosystem services (Green and Elmberg 2014), including as a source of nutrients (Hahn et al. 2007, 2008), seed and propagule dispersers (Green et al. 2008), and insect control (Green and Elmberg 2014). Waterbird breeding opportunities, reproductive success and population persistence are strongly linked to availability and quality of wetland habitats. In Australia, many species of waterbirds breed in large groups (>10,000 birds), forming either single- or mixed-species rookeries or colonies. These species, known as aggregating or colonial waterbirds, include members from the following four families: Ardeidae (herons, bitterns, egrets), Phalacrocoracidae (cormorants), Pelecanidae (pelicans) and Plataleidae (ibis and spoonbills). Often opportunistic breeders, they are reliant on river flows inundating floodplain wetlands (Bino et al. 2014; Brandis et al. 2021), and are known to traverse long distances to capitalise on suitable breeding habitat (Roshier et al. 2001; Kingsford et al. 2010a). Still, the precise characteristics of suitable wetland breeding habitat, which includes factors such as inundation extent, water depth, and nesting vegetation, are complex, multifaceted and poorly documented.
Aggregating waterbirds can be categorised on the basis of their nesting preferences, and include ground, shrub and tree preferences. The Australian pelican is the only ground-nesting aggregating species and is often found nesting on sandy islands or beaches (Marchant and Higgins 1990). Species that nest in inundated vegetation such as emergent macrophytes include ibis and spoonbills, with nests often built in lignum (Duma florulenta) or phragmites (Phragmites australis) (Marchant and Higgins 1990; Leslie 2001). Tree-nesting species, including cormorants, herons and egrets, build their nests primarily in trees along or within rivers and wetlands during periods of inundation (Marchant and Higgins 1990, Leslie 2001). It is not unusual, within a single wetland, for straw-necked ibis and spoonbills to nest in lignum or phragmites, whereas areas of inundated river cooba (Acacia stenophylla) and river red gum (Eucalyptus camaldulensis) are used by cormorants, egrets and nankeen night herons (Nycticorax caledonicus) (Spencer 2017). For aggregating waterbirds to reproduce successfully, flooding is required over a period of 5–6 months (Briggs et al. 1998; Leslie 2001; Brandis et al. 2011). For many species of aggregating wading birds (e.g. ibis, spoonbills, egrets, herons), nests need to be surrounded by water (Carrick 1962; Bancroft et al. 2002).
Waterbird populations in eastern Australia have been steadily declining over the past four decades (Kingsford et al. 2020; Brandis et al. 2021). These declines have been the result of widespread water-resource development, resulting in changes to river flow and wetland flooding regimes (Kingsford and Thomas 1995; Kingsford and Johnson 1998; Brandis et al. 2018), loss of wetland habitat, and land-use changes. The Murray–Darling Basin is a known stronghold for aggregating waterbird breeding in Australia (Brandis 2010; Arthur et al. 2012; Bino et al. 2020); however, there is little research on the habitat characteristics that make a wetland a suitable breeding site. Improving management and conservation outcomes hinges on understanding of habitat requirements for key life-history stages, including breeding, roosting and foraging. This study aimed to assess the inundation regime and vegetation communities of important breeding sites in the Murray–Darling Basin. Our goal was to identify critical thresholds for these indicators across the Murray–Darling Basin, as well as in each of its two river catchments (Darling (northern Basin) and Murray River (southern Basin) catchments) that would provide quantifiable guidance on the extent of vegetation communities and inundation thresholds necessary to support continued waterbird breeding across a large landscape.
Materials and methods
Study area
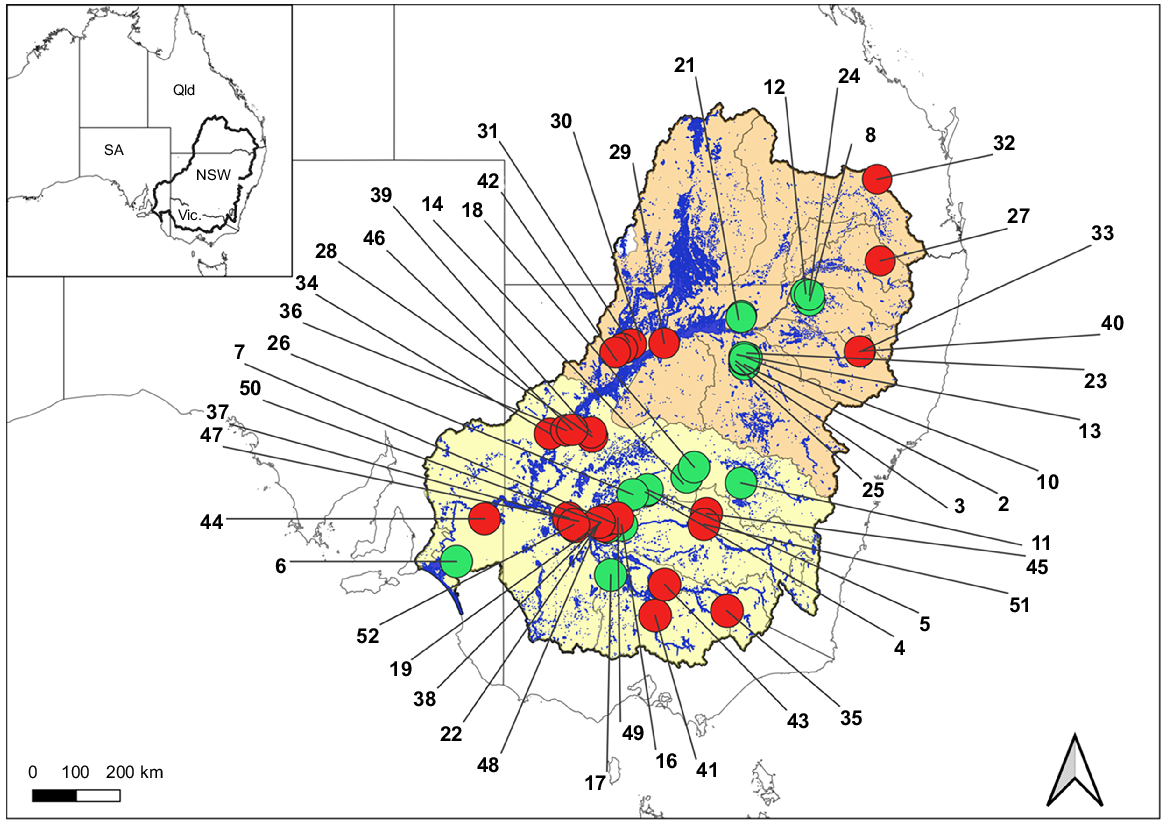
The Murray–Darling Basin is an area of 1,059,000 km2 in eastern Australia, spanning four States and one Territory (Fig. 1), with competing demands for water. It is the source of almost half of Australia’s total food production, accounting for 62% of Australia’s total irrigation water use, with 1200 GL of water applied to cotton irrigation alone in a single year (2020–2021) (Australian Bureau of Statstics 2022; see https://www.mdba.gov.au/basin). To manage agricultural demands, the majority of the Murray–Darling Basin rivers are highly regulated, controlled by dams and water-extraction infrastructure (Docker and Robinson 2014; Grafton and Wheeler 2018). The Basin is subdivided into the northern and southern Basins, where water runs into the Darling and Murray Rivers respectively. The two sub-basins differ climatically and topographically, with the northern Basin being generally hotter, drier and flatter, experiencing more evaporative water loss than does the southern Basin (Department of Climate Change Energy the Environment and Water 2022).
Waterbirds sites, breeding (green) and non-breeding (red), included in the habitat-characterisation models, located on wetlands (blue) within the northern (orange) or southern (yellow) Murray–Darling Basin (bold black line), in eastern Australia, covering the states of Queensland (Qld), New South Wales (NSW), Victoria (Vic.) and South Australia (SA). See Table 1 for wetland-site IDs.
Waterbird data
We collated waterbird data for the Murray–Darling Basin (2007–2021) from the following three primary sources: Waterbird spring ground surveys (NSW Department of Climate Change, Energy, the Environment and Water, data available from Atlas of Living Australia at www.ala.org.au); Eastern Australian Aerial Waterbird Survey, (Kingsford et al. 2020); and colonial waterbird reproductive success monitoring 2007–2021 (Brandis et al. 2011, 2022; Wassens et al. 2022).
We filtered the combined datasets for wetlands used by a subset of 18 aggregating species (Appendix A1). We classified waterbird data into breeding and non-breeding records, discriminating between wetlands with records of waterbird breeding, and wetlands with no records of breeding. We identified 206 wetlands with records of aggregating waterbird breeding between 2007 and 2021. We selected 52 wetlands, the top 26 breeding wetlands (>10,000 cumulative nests between 2007 and 2021) and 26 non-breeding wetlands with the highest cumulative abundances 2007–2021 (Fig. 1). These sites were spread across the northern and southern Basin; 22 sites in the northern Basin (14 breeding, 8 non-breeding) and 30 sites in the southern Basin (12 breeding, 18 non-breeding).
Habitat indicators
To identify the characteristics of breeding and non-breeding wetlands, we collated a range of temporally static and dynamic environmental data variables, for example, vegetation, inundation and climate, that were available at the Basin scale for the 52 wetlands. Each wetland site (point location) was buffered with a 40-km radius circular buffer to incorporate the environmental variables surrounding the wetland site. This distance was chosen as an estimate of the foraging distance that ibis travels from the breeding site (Martin and Portugal 2011).
We collated temporally static environmental variables as follows:
National vegetation information system (NVIS) present major vegetation groups (Department of Climate Change, Energy, the Environment and Water 2020a) and present major vegetation subgroups (Department of Climate Change, Energy, the Environment and Water 2020b).
Australian National Aquatic Ecosystems (ANAE) wetlands classification raster (Department of Climate Change, Energy, the Environment and Water 2012).
Wetlands topographic 1:250,000 shape-file layer (Kingsford et al. 2004).
For each of these static environmental variables, we calculated the area of each raster class within the 40-km buffer around each of the 52 wetlands, be it wetland type or vegetation group or subgroup.
We also collated temporally dynamic environmental variables as follows:
Geoscience Australia water observations from space (WOFS) rasters (Mueller et al. 2016).
Normalised difference vegetation index (NDVI) and enhanced vegetation index (EVI) from the MOD13Q1.006 Terra moderate resolution imaging spectroradiometer (MODIS) vegetation indices product (referred to as Terra MODIS) (MODIS valid ranges −2000 to 10,000, standardised from −1 to 1) (Didan 2021).
Terra vegetation continuous fields (tree cover, non-tree cover and non-vegetated classifications) from the MOD44B.006 product (DiMiceli et al. 2021).
ERA5-Land Hourly ECMWF climate reanalysis (minimum and maximum daily temperatures) (Hersbach et al. 2020).
We used the Geoscience Australia WOFS (Mueller et al. 2016) to analyse surface-water inundation for each of the 52 wetlands. This dataset, derived from Landsat 5–9 imagery, classifies pixels as flooded, dry or no data (i.e. cloud cover or shadow obscuring identification of water). We used the Digital Earth Australia Sandbox (an online computing environment) (Killough et al. 2021; Krause et al. 2021) to analyse the WOFS data and count the inundated pixels within each site. We calculated the maximum inundated area for each month between the years 2007 and 2021. We then derived the maximum, minimum and average annual areas of inundation of each wetland.
We processed the NDVI, EVI, ECMWF climate reanalysis temperature rasters using the Google Earth Engine (Gorelick et al. 2017). For NDVI, EVI and temperature, we collated the monthly average of pixel values within the 40-km radius of each wetland site. We then derived the maximum, minimum and average annual values for each wetland. NDVI and EVI indices were considered important as potential predictors of primary productivity (Phillips et al. 2008), and, by extension, availability of food resources for waterbirds. For the terra vegetation continuous fields, we calculated the monthly proportion cover of each of the three types (tree cover, non-tree cover and bare ground) for each wetland. We also calculated monthly NDVI indices per NVIS major vegetation group by using Google Earth engine. Similarly, we calculated the area inundated of each NVIS vegetation class by using the Digital Earth Australia Sandbox.
These processes were repeated for identified wetland sites in the northern and southern Basin subsets.
Habitat classification
To identify the environmental variables able to distinguish between breeding and non-breeding wetlands, we used classification tree analysis (Breiman et al. 1984). In our analysis, we employed the recursive partitioning and regression trees (rpart) algorithm for binary classification of breeding and non-breeding wetlands, utilising the ‘train’ function in caret package (ver. 6.0-94, see https://cran.r-project.org/package=caret; Kuhn 2008). The first stage involved hyperparameter tuning through repeated 10-fold cross-validation, repeated 100 times, to find the optimal complexity parameter. We used this optimal complexity parameter to build the final classification tree model by using the ‘rpart’ function in the rpart package (ver. 4.1.23, T. Therneau, B. Atkinson and B. Ripley, see https://cran.r-project.org/package=rpart). We used the area under the receiver operating characteristic curve (ROC) as a measure of model discriminatory power (Fawcett 2006) and compared the ability of the various indicators to distinguish between breeding and non-breeding sites. We tested classification models for each temporally static vegetation indicator separately, and another with all temporally static variables combined. For temporally dynamic variables, we used a classification model, which combined the maximum, minimum and mean annual values of NDVI, minimum and maximum temperatures, and area of inundation. We also combined static and dynamic indicators by calculating the area of inundation within the present major vegetation groups of the National Vegetation Information System (NVIS). All analyses were performed in the R environment (ver. 2.8.1, R Foundation for Statistical Computing, Vienna, Austria, see https://www.r-project.org/).
Results
Aggregating waterbird data
The top 26 breeding wetlands across the Basin had >10,000 nests (Table 1, Fig. 1). The top 26 non-breeding wetlands with the highest total abundances of waterbirds in 2007–2021 included sites with 1268–10,555 birds (Table 1, Fig. 1), and were spread across the northern Basin (14 breeding, 8 non-breeding) and southern Basin (12 breeding, 18 non-breeding).
| Site ID | Breeding | Northern or southern Basin | Name | Total abundance (2007–2021) | |
|---|---|---|---|---|---|
| 1 | Yes | North | Clear Lake, Narran Lake | 503,710 | |
| 2 | North | Wilancorah North (Monkeygar Swamp) | 306,004 | ||
| 3 | North | Macquarie Marshes | 260,470 | ||
| 4 | South | Booligal Swamp | 251,822 | ||
| 5 | South | Upper Merrimajeel | 202,920 | ||
| 6 | South | Lower Lakes and Coorong | 190,590 | ||
| 7 | South | Telephone Bank | 151,614 | ||
| 8 | North | Gwydir | 151,104 | ||
| 9 | North | Monkeygar Swamp | 109,914 | ||
| 10 | North | Zoo Paddock | 102,480 | ||
| 11 | South | Lake Cowal | 101,102 | ||
| 12 | North | Old Boyanga West | 90,420 | ||
| 13 | North | T Block/The Willows | 88,226 | ||
| 14 | South | Lake Brewster | 81,652 | ||
| 15 | North | Narran Lake Delta | 78,872 | ||
| 16 | South | Eulimbah Swamp | 70,624 | ||
| 17 | South | Kerang wetlands | 69,508 | ||
| 18 | South | Mid Lachlan | 68,228 | ||
| 19 | South | Talpee Creek | 56,598 | ||
| 20 | North | P Block | 36,424 | ||
| 21 | North | Clear Lake South | 36,018 | ||
| 22 | South | Kieeta Lake | 31,000 | ||
| 23 | North | Bora | 30,206 | ||
| 24 | North | Gingham Waterhole/Munwonga wetland | 24,516 | ||
| 25 | North | P Block/River Paddock | 22,470 | ||
| 26 | South | Cuba Dam (Merrowie Creek) | 20,004 | ||
| 27 | No | North | Coolmunda Dam | 10,555 | |
| 28 | South | Victoria Lake | 10,228 | ||
| 29 | North | Darling River | 10,131 | ||
| 30 | North | Cuttaburra Channels | 9566 | ||
| 31 | North | Yamaramie Swamp | 7389 | ||
| 32 | North | Unnamed wetland | 6773 | ||
| 33 | North | Split Rock Reservoir | 6494 | ||
| 34 | South | Lake Cawndilla | 4718 | ||
| 35 | South | Kiewa River | 3130 | ||
| 36 | South | Talyawalka Creek | 3025 | ||
| 37 | South | Murray River | 2348 | ||
| 38 | South | Lake Tala | 2274 | ||
| 39 | South | Eucalyptus Lake | 2059 | ||
| 40 | North | Oaky Creek | 1902 | ||
| 41 | South | Waranga Basin | 1894 | ||
| 42 | North | Tindeanda Tank Claypans | 1767 | ||
| 43 | South | Barmah–Millewa | 1691 | ||
| 44 | South | Pyap Lagoon | 1572 | ||
| 45 | South | Murray Channel | 1516 | ||
| 46 | South | Dry Lake | 1507 | ||
| 47 | South | Lake Caringay | 1479 | ||
| 48 | South | Murrumbidgee River Redbank Weir | 1428 | ||
| 49 | South | Murrumbidgee River | 1385 | ||
| 50 | South | Paika Lake | 1369 | ||
| 51 | South | Fivebough Swamp | 1306 | ||
| 52 | South | Lake Benanee | 1268 |
Habitat characterisation
Among the temporally static vegetation indicators, both the NVIS major groups and subgroups performed best in distinguishing between breeding and non-breeding wetland sites when using a classification-tree approach (Table 2). At the Basin scale, sites having an area of >1.437 km2 of ‘other shrublands’ in the major-groups dataset correctly classified 19 of the 26 wetlands as those supporting waterbird breeding, omitting seven sites with areas of <1.437 km2, with a ROC of 0.81. When vegetation subgroups were considered, breeding wetlands were identified as those having an area of <0.335 km2 of ‘Casuarina and Allocasuarina open woodlands with a shrubby understorey’ and <0.111 km2 of ‘Eucalyptus woodlands with ferns, herbs, sedges, rushes or wet tussock grassland’, correctly classifying 23 of the 26 breeding wetlands with an ROC of 0.82. Other static vegetation indicators did not perform as well (Table 2). When all temporally static variables were combined into a single model, the best classification tree identified the ‘other shrublands’ classification within the NVIS major-groups vegetation dataset as being the best predictor for the presence of waterbird breeding (Table 2). When considering classification for the northern Basin only, sites with an area of >0.846 km2 of ‘other shrublands’ in the major-groups dataset correctly classified all 14 wetlands as those supporting waterbird breeding (Table 2). For the southern Basin, wetland sites with an area of >0.0587 km2 of ‘regrowth, modified native vegetation’ in the major-groups dataset correctly classified 10 of the 12 wetlands as those supporting waterbird breeding.
| Dataset | AOI | Variable | Threshold (km2) | n | Breeding | No | Yes | ROC | |
|---|---|---|---|---|---|---|---|---|---|
| NVIS major groups | MDB | Other shrublands | 1.4366 | 52 | 26 (0.5) | 26 (0.5) | 0.81 | ||
| < | 33 (0.63) | Non-breeding | 26 (0.79) | 7 (0.21) | |||||
| > | 19 (0.37) | Breeding | 0 (0) | 19 (1) | |||||
| North | Other shrublands | 0.8461 | 22 | 8 (0.36) | 14 (0.64) | 0.8 | |||
| < | 8 (0.36) | Non-breeding | 8 (1) | 0 (0) | |||||
| > | 14 (0.64) | Breeding | 0 (0) | 14 (1) | |||||
| South | Regrowth, modified native vegetation | 0.0587 | 30 | 18 (0.6) | 12 (0.4) | 0.78 | |||
| < | 17 (0.57) | Non-breeding | 15 (0.88) | 2 (0.12) | |||||
| > | 13 (0.43) | Breeding | 3 (0.23) | 10 (0.77) | |||||
| NVIS subgroups | MDB | Casuarina and Allocasuarina open woodlands with a shrubby understorey | 0.3349 | 52 | 26 (0.5) | 26 (0.5) | 0.82 | ||
| > | 16 (0.31) | Non-breeding | 15 (0.94) | 1 (0.06) | |||||
| Eucalyptus woodlands with ferns, herbs, sedges, rushes or wet tussock grassland | 0.1112 | 36 (0.69) | Breeding | 11 (0.31) | 25 (0.69) | ||||
| > | 10 (0.19) | Non-breeding | 8 (0.8) | 2 (0.2) | |||||
| < | 26 (0.5) | Breeding | 3 (0.12) | 23 (0.88) | |||||
| North | Other Acacia tall open shrublands and tall shrublands | 0.0001 | 22 | 8 (0.36) | 14 (0.64) | 0.67 | |||
| < | 10 (0.45) | Non-breeding | 8 (0.8) | 2 (0.2) | |||||
| > | 12 (0.55) | Breeding | 0 (0) | 12 (1) | |||||
| South | Regrowth or modified graminoids | 0.6589 | 30 | 18 (0.6) | 12 (0.4) | 0.56 | |||
| < | 22 (0.73) | Non-breeding | 17 (0.77) | 5 (0.23) | |||||
| > | 8 (0.27) | Breeding | 1 (0.13) | 7 (0.88) | |||||
| ANAE | MDB | Freshwater meadow | 0.1067 | 52 | 26 (0.5) | 26 (0.5) | 0.73 | ||
| > | 23 (0.44) | Breeding | 3 (0.13) | 20 (0.87) | |||||
| Temporary tall emergent marsh | 0.0098 | 29 (0.56) | Non-breeding | 23 (0.79) | 6 (0.21) | ||||
| < | 20 (0.38) | Non-breeding | 19 (0.95) | 1 (0.05) | |||||
| > | 9 (0.17) | Breeding | 4 (0.44) | 5 (0.56) | |||||
| North | River cooba woodland riparian zone or floodplain | 0.0557 | 22 | 8 (0.36) | 14 (0.64) | 0.77 | |||
| < | 8 (0.36) | Non-breeding | 8 (1) | 0 (0) | |||||
| > | 14 (0.64) | Breeding | 0 (0) | 14 (1) | |||||
| South | Temporary stream | 0.0004 | 30 | 18 (0.6) | 12 (0.4) | 0.46 | |||
| < | 20 (0.67) | Non-breeding | 16 (0.8) | 4 (0.2) | |||||
| > | 10 (0.33) | Breeding | 2 (0.2) | 8 (0.8) | |||||
| Wetlands topographic | MDB | Lake | 2.7139 | 52 | 26 (0.5) | 26 (0.5) | 0.63 | ||
| < | 7 (0.13) | Non-breeding | 7 (1) | 0 (0) | |||||
| Lake | 0.3457 | 45 (0.87) | Breeding | 19 (0.42) | 26 (0.58) | ||||
| < | 13 (0.25) | Non-breeding | 10 (0.77) | 3 (0.23) | |||||
| Watercourse Area | 0.1937 | 32 (0.62) | Breeding | 9 (0.28) | 23 (0.72) | ||||
| > | 7 (0.13) | Non-breeding | 5 (0.71) | 2 (0.29) | |||||
| Lake | 1.0186 | 25 (0.48) | Breeding | 4 (0.16) | 21 (0.84) | ||||
| > | 7 (0.13) | Non-breeding | 4 (0.57) | 3 (0.43) | |||||
| < | 18 (0.35) | Breeding | 0 (0) | 18 (1) | |||||
| North | 22 | 8 (0.36) | 14 (0.64) | 0.44 | |||||
| South | Lake | 2.7139 | 30 | 18 (0.6) | 12 (0.4) | 0.49 | |||
| > | 7 (0.23) | Non-breeding | 7 (1) | 0 (0) | |||||
| Lake | 0.6805 | 23 (0.77) | Breeding | 11 (0.48) | 12 (0.52) | ||||
| < | 12 (0.4) | Non-breeding | 9 (0.75) | 3 (0.25) | |||||
| > | 11 (0.37) | Breeding | 2 (0.18) | 9 (0.82) |
Data were sourced from the Australian Government Department of Climate Change National Vegetation Information System (NVIS) major vegetation group fact sheet series (see https://www.dcceew.gov.au/environment/land/publications/nvis-fact-sheet-series-4-2).
When considering temporally dynamic indicators, at the Basin scale, 22 of the 26 breeding wetlands had a maximum annual NDVI score of >6096.4 (standardised to 0.22) and a minimum annual NDVI score of <2694 (−0.46) with a ROC of 0.74. For wetlands in the northern Basin, 12 of the 14 breeding sites had a minimum area of inundation of less than 0.97515 km2, with a ROC of 0.66. For sites in the southern Basin, all breeding wetlands had a maximum NDVI value of >6096.4 (0.22), with a ROC of 0.74 (Table 3).
| Dataset | AOI | Variable | Threshold | n | Breeding | No | Yes | ROC | |
|---|---|---|---|---|---|---|---|---|---|
| Terra vegetation continuous fields | MDB | Non-vegetated (km2) | 18.6854 | 52 | 26 (0.5) | 26 (0.5) | 0.75 | ||
| < | 24 (0.46) | Non-breeding | 18 (0.75) | 6 (0.25) | |||||
| Tree cover (km2) | 0.3326 | 28 (0.54) | Breeding | 8 (0.29) | 20 (0.71) | ||||
| < | 9 (0.17) | Non-breeding | 8 (0.89) | 1 (0.11) | |||||
| > | 19 (0.37) | Breeding | 0 (0) | 19 (1) | |||||
| North | Non-tree vegetation (km2) | 38.7384 | 22 | 8 (0.36) | 14 (0.64) | 0.51 | |||
| > | 7 (0.32) | Non-breeding | 5 (0.71) | 2 (0.29) | |||||
| < | 15 (0.68) | Breeding | 3 (0.2) | 12 (0.8) | |||||
| South | Non-tree vegetation (km2) | 38.8597 | 30 | 18 (0.6) | 12 (0.4) | 0.6 | |||
| < | 11 (0.37) | Non-breeding | 10 (0.91) | 1 (0.09) | |||||
| > | 19 (0.63) | Breeding | 8 (0.42) | 11 (0.58) | |||||
| Combined vegetation (NVIS major and subgroups) | MDB | Other shrublands (major groups) (km2) | 1.4366 | 52 | 26 (0.5) | 26 (0.5) | 0.81 | ||
| < | 33 (0.63) | Non-breeding | 26 (0.79) | 7 (0.21) | |||||
| < | 19 (0.37) | Breeding | 0 (0) | 19 (1) | |||||
| North | Other shrublands (major groups) (km2) | 0.8461 | 22 | 8 (0.36) | 14 (0.64) | 0.77 | |||
| < | 8 (0.36) | Non-breeding | 8 (1) | 0 (0) | |||||
| > | 14 (0.64) | Breeding | 0 (0) | 14 (1) | |||||
| South | Regrowth, modified native vegetation (major groups) (km2) | 0.0587 | 30 | 18 (0.6) | 12 (0.4) | 0.71 | |||
| < | 17 (0.57) | Non-breeding | 15 (0.88) | 2 (0.12) | |||||
| > | 13 (0.43) | Breeding | 3 (0.23) | 10 (0.77) | |||||
| Inundation (mean, max., min.) | MDB | Max. inundated area (km2) | 152.884 | 52 | 26 (0.5) | 26 (0.5) | 0.92 | ||
| < | 12 (0.23) | Non-breeding | 12 (1) | 0 (0) | |||||
| Mean inundated area (km2) | 61.201 | 40 (0.77) | 14 (0.35) | 26 (0.65) | |||||
| > | 21 (0.4) | Non-breeding | 14 (0.67) | 7 (0.33) | |||||
| < | 19 (0.37) | Breeding | 0 (0) | 19 (1) | |||||
| North | Min. inundated area (km2) | 0.97515 | 22 | 8 (0.36) | 14 (0.64) | 0.66 | |||
| > | 9 (0.41) | Non-breeding | 7 (0.78) | 2 (0.22) | |||||
| < | 13 (0.59) | Breeding | 1 (0.08) | 12 (0.92) | 0.47 | ||||
| South | Max. inundated area (km2) | 156.0123 | 30 | 18 (0.6) | 12 (0.4) | ||||
| < | 7 | Non-breeding | 7 (1) | 0 (0) | |||||
| Max. inundated area (km2) | 295.759 | 23 | 11 (0.48) | 12 (0.52) | |||||
| > | 14 | Non-breeding | 9 (0.64) | 5 (0.36) | |||||
| < | 9 | Breeding | 2 (0.22) | 7 (0.78) | |||||
| NDVI (mean, max., min.) × Inundation (mean, max., min.) × temperature (mean, max., min.) | MDB | Max. NDVI | 6096.44 | 52 | 26 (0.5) | 26 (0.5) | 0.78 | ||
| < | 20 (0.38) | Non-breeding | 17 (0.85) | 3 (0.15) | |||||
| Min. NDVI | 2693.98 | 32 (0.62) | Breeding | 9 (0.28) | 23 (0.72) | ||||
| > | 8 (0.15) | Non-breeding | 7 (0.88) | 1 (0.13) | |||||
| < | 24 (0.46) | Breeding | 2 (0.08) | 22 (0.92) | |||||
| North | Min. inundated area (km2) | 0.9752 | 22 | 8 (0.36) | 14 (0.64) | 0.66 | |||
| > | 9 (0.41) | Non-breeding | 7 (0.78) | 2 (0.22) | |||||
| < | 13 (0.59) | Breeding | 1 (0.08) | 12 (0.92) | |||||
| South | Max. NDVI | 6096.44 | 30 | 18 (0.6) | 12 (0.4) | 0.74 | |||
| < | 11 (0.37) | Non-breeding | 11 (1) | 0 (0) | |||||
| > | 19 (0.63) | Breeding | 7 (0.37) | 12 (0.63) |
At the Basin scale, the area of inundation of major vegetation groups for 20 of the 26 wetlands that supported waterbird breeding had a maximum inundated area of >3.6347 km2 in ‘other shrublands’ and of <1.6155 km2 in ‘mallee woodlands and shrublands’, with a ROC of 0.83 (Table 4). In the northern Basin, all 14 wetlands that supported waterbird breeding had a maximum area of inundated of >2.4462 km2 in ‘other shrublands’, yielding a model with a ROC of 0.80. In the southern Basin, 10 of the 12 wetlands which supported waterbird breeding had a maximum area of inundated of >0.0167 km2 in ‘regrowth, modified native vegetation’, yielding a model with a ROC of 0.72 (Table 4).
| Dataset | AOI | Variable | Threshold | n | Breeding | No | Yes | ROC | |
|---|---|---|---|---|---|---|---|---|---|
| NVIS major groups × inundation | MDB | Other shrublands (km2) | 3.6347 | 52 | 26 (0.5) | 26 (0.5) | 0.83 | ||
| < | 22 (0.42) | Non-breeding | 19 (0.86) | 3 (0.14) | |||||
| Mallee woodlands and shrublands (km2) | 1.6155 | 30 (0.58) | Breeding | 7 (0.23) | 23 (0.77) | ||||
| > | 10 (0.19) | Non-breeding | 7 (0.7) | 3 (0.3) | |||||
| < | 20 (0.38) | Breeding | 0 (0) | 20 (1) | |||||
| North | Other shrublands (km2) | 2.4462 | 22 | 8 (0.36) | 14 (0.64) | 0.80 | |||
| < | 8 | Non-breeding | 8 (1) | 0 (0) | |||||
| > | Breeding | 0 (0) | 14 (1) | ||||||
| South | Regrowth, modified native vegetation (km2) | 0.0167 | 30 | 18 (0.6) | 12 (0.4) | 0.72 | |||
| < | 16 (0.53) | Non-breeding | 14 (0.88) | 2 (0.13) | |||||
| > | 14 (0.47) | Breeding | 4 (0.29) | 10 (0.71) | |||||
| NVIS major groups × NDVI | MDB | Max. NDVI – chenopod shrublands, samphire shrublands and forblands | 6562.45 | 52 (1) | Non-breeding | 26 (0.5) | 26 (0.5) | 0.68 | |
| < | 31 (0.6) | Non-breeding | 23 (0.74) | 8 (0.26) | |||||
| > | 21 (0.4) | Breeding | 3 (0.14) | 18 (0.86) | |||||
| North | Max. NDVI – Acacia shrublands | 5474.758 | 22 | 8 (0.36) | 14 (0.64) | 0.66 | |||
| < | Non-breeding | 8 (0.8) | 2 (0.2) | ||||||
| > | Breeding | 0 (0) | 12 (1) | ||||||
| South | Max. NDVI – chenopod shrublands, samphire shrublands and forblands | 6562.45 | 30 | 18 (0.6) | 12 (0.3) | 0.73 | |||
| < | 16 (0.53) | Non-breeding | 15 (0.94) | 1 (0.06) | |||||
| > | 14 (0.47) | Breeding | 3 (0.21) | 11 (0.79) |
Considering the NDVI of major vegetation groups, at the Basin scale, 18 of the 26 sites that supported waterbird breeding, had a maximum NDVI of >6562.5 (0.31) in ‘chenopod shrublands, samphire shrublands and forblands’, with a ROC of 0.68 (Table 4). In the northern Basin, 12 of the 14 sites that supported waterbird breeding had a maximum NDVI of >5474.8 (0.09) in ‘Acacia shrublands’, yielding a model with a ROC of 0.66. In the southern Basin, 11 of the 12 sites that supported waterbird breeding had a maximum NDVI of >6562.5 (0.31) in ‘chenopod shrublands, samphire shrublands and forblands’, yielding a model with a ROC of 0.73 (Table 4).
Discussion
This study has identified inundation-extent thresholds and vegetation communities that support aggregating waterbird breeding across the Murray–Darling Basin and its two river catchments. When exploring vegetation requirements of wetlands that supported waterbird breeding, the NVIS group ‘other shrublands’ consistently emerged as an important variable. This group includes vegetation communities such as lignum shrubland and wetlands (NVIS Fact sheet MVG 17). Distinct differences were observed between the northern and southern Basin wetlands. Whereas the NVIS major vegetation group ‘other shrublands’ characterised breeding wetlands in the northern Basin, the ‘regrowth, modified native vegetation’ (NVIS Fact Sheet MVG 24–30) typified breeding wetlands in the southern Basin. This latter group is defined as regenerating native or non-native species following disturbance.
The consistent prominence of the ‘other shrublands’ category as a significant predictor of breeding sites is indicative of the intricate relationship between waterbirds and their surrounding vegetation. Shrublands, particularly those in wetland ecosystems, often provide essential resources such as nesting materials, shelter from predators, and abundant food sources in the form of aquatic invertebrates and fish (Rayner et al. 2015). Moreover, the structural complexity of shrublands can offer varied microhabitats, catering to the diverse nesting preferences of different waterbird species (Marchant and Higgins 1990). The health and distribution of these shrublands can be influenced by various factors, including water availability, soil salinity and anthropogenic disturbances (Craig et al. 1991; Meeson et al. 2002; Capon et al. 2009). As such, the presence and extent of ‘other shrublands’ not only serve as indicators of suitable breeding habitats but also reflect the overall ecological health and resilience of wetland ecosystems (Casanova and Brock 2000; Brock et al. 2006). Given the pivotal role of vegetation in supporting waterbird breeding, conservation strategies should prioritise the preservation and restoration of these critical shrubland habitats (Maher and Braithwaite 1992).
The significance of temporally dynamic indicators, especially the normalised difference vegetation index (NDVI), as a predictor of breeding sites highlights the dynamic nature of wetland ecosystems in floodplains. NDVI, a measure of vegetation greenness, can serve as a proxy for primary productivity (Phillips et al. 2008) and, by extension, the availability of food resources for waterbirds. High NDVI values typically indicate healthy vegetation, which can support a rich diversity of invertebrates and other prey essential for waterbird diets (Jenkins and Boulton 2003; Kingsford et al. 2010b). The observed NDVI thresholds in the study suggest specific ecological conditions that favour waterbird breeding. For instance, sites with large changes in NDVI values from low to high might reflect the ‘boom and bust’ nature of semi-arid wetlands, where periods of resource abundance alternate with scarcity (Bino et al. 2020). Such dynamics can influence the breeding strategies of waterbirds, with species potentially timing their breeding to coincide with periods of resource abundance (Roshier et al. 2008). As climate change and anthropogenic activities continue to affect wetland hydrology and vegetation dynamics, understanding the relationship between NDVI and waterbird breeding becomes crucial for adaptive management and conservation planning.
The identification of key habitat characteristics and thresholds that determine whether a wetland is a suitable waterbird breeding site is pivotal for setting management targets. Quantified environmental outcomes (QEOs) are instrumental in establishing targets and assessing progress towards them as part of the Murray–Darling Basin Plan (Johnson et al. 2021). The results of this study have provided a quantifiable objective with regards to vegetation and inundation extent and restoration targets. Monitoring these habitat variables over time can provide an assessment against set targets. However, the challenge lies in the dynamic nature of these habitats. Relying solely on static data layers is not sufficient. Although satellite imagery for environmental monitoring is well-established (Ustin 2004; Pickens and King 2014), many of the Australian vegetation datasets lack consistent wetland vegetation mapping at a scale suitable for a Basin-wide assessment. The vegetation layers currently available, NVIS and ANAE, are created from collated vegetation maps with varying mapping methods, resolution and quality. In addition, the original mapping of the collated layers is from a range of fixed points in time, and in some cases the age of the mapping is dated. Higher spatial-resolution wetland vegetation mapping would allow for more specific development of monitoring and management targets at key wetlands. The CART models used in this project identified a vegetation type ‘other shrublands’ as a key determinant of waterbird breeding habitat. However, this is derived from a static vegetation map, classifying vegetation types at a community level. It does not adequately describe the vegetation found in these wetlands to the level at which changes over time can be assessed or measured.
There are existing monitoring and mapping programs that could potentially aid in assessing QEOs. For instance, the Basin-wide Flow Monitoring and Environmental Research program collects data from select catchments and wetlands throughout the Basin (https://www.dcceew.gov.au/water/cewo/monitoring/mer-program). However, its coverage is not exhaustive and it does not cover all sites assessed in this study. Nonetheless the data collected as part of this project may be useful in determining baselines for some wetland sites.
This study identified the important environmental variables at a Basin scale for waterbird breeding. The presence of inundated shrubland (predominantly lignum dominated) and habitats that show large NDVI variability, reflective of a ‘boom and bust’ ecosystem model, are important conditions that make suitable breeding wetlands. This knowledge can inform water and wetland management decision-making (e.g. environmental watering schedules), assist in condition and response monitoring (e.g. tracking the effects of vegetation degradation and other stressors on important breeding wetlands), and provides targets for conservation and restoration (e.g. high-priority areas for protection) to ensure the ongoing provision of rookery sites and opportunities for waterbird breeding.
Declaration of funding
The authors acknowledge the support and funding from the Murray–Darling Basin Authority for the original study that formed the basis for this paper.
References
Arthur AD, Reid JRW, Kingsford RT, McGinness HM, Ward KA, Harper MJ (2012) Breeding flow thresholds of colonial breeding waterbirds in the Murray–Darling Basin, Australia. Wetlands 32, 257-265.
| Crossref | Google Scholar |
Australian Bureau of Statstics (2022) Water use on Australian farms. Available at https://www.abs.gov.au/statistics/industry/agriculture/water-use-australian-farms/latest-release
Bancroft GT, Gawlik DE, Rutchey K (2002) Distribution of wading birds relative to vegetation and water depths in the northern everglades of Florida, USA. Waterbirds 25(3), 265-277.
| Crossref | Google Scholar |
Bino G, Steinfeld C, Kingsford RT (2014) Maximizing colonial waterbirds’ breeding events using identified ecological thresholds and environmental flow management. Ecological Applications 24(1), 142-157.
| Crossref | Google Scholar | PubMed |
Bino G, Brandis K, Kingsford RT, Porter J (2020) Waterbird synchrony across Australia’s highly variable dryland rivers – risks and opportunities for conservation. Biological Conservation 243, 108497.
| Crossref | Google Scholar |
Brandis KJ, Kingsford RT, Ren S, Ramp D (2011) Crisis water management and ibis breeding at Narran Lakes in arid Australia. Environmental Management 48(3), 489-498.
| Crossref | Google Scholar | PubMed |
Brandis KJ, Bino G, Spencer JA, Ramp D, Kingsford RT (2018) Decline in colonial waterbird breeding highlights loss of Ramsar wetland function. Biological Conservation 225, 22-30.
| Crossref | Google Scholar |
Brandis KJ, Bino G, Kingsford RT (2021) More than just a trend: integrating population viability models to improve conservation management of colonial waterbirds. Environmental Management 68(4), 468-476.
| Crossref | Google Scholar | PubMed |
Briggs SV, Lawler WG, Thornton SA (1998) Relationship between control of water regimes in River Red Gum wetlands and abundance of waterbirds. Corella 22(2), 47-55.
| Google Scholar |
Capon SJ, James CS, Williams L, Quinn GP (2009) Responses to flooding and drying in seedlings of a common Australian desert floodplain shrub: Muehlenbeckia florulenta Meisn. (tangled lignum). Environmental and Experimental Botany 66, 178-185.
| Crossref | Google Scholar |
Carrick R (1962) Breeding, movements and conservation of ibises (Threskiornithidae) in Australia. CSIRO Wildlife Research 7(1), 71-90.
| Crossref | Google Scholar |
Casanova MT, Brock MA (2000) How do depth, duration and frequency of flooding influence the establishment of wetland plant communities. Plant Ecology 147, 237-250.
| Crossref | Google Scholar |
Craig AE, Walker KF, Boulton AJ (1991) Effects of edaphic factors and flood frequency on the abundance of lignum (Muehlenbeckia florulenta Meissner) (Polygonaceae) on the River Murray Floodplain, South Australia. Australian Journal of Botany 39, 431-443.
| Crossref | Google Scholar |
Department of Climate Change Energy the Environment and Water (2022) Northern Murray–Darling Basin. (DCCEEW) Available at https://www.dcceew.gov.au/water/policy/mdb/northernbasin
Department of Climate Change, Energy, the Environment and Water (2012) Australian national aquatic ecosystem classification framework. (Australian Government) Available at https://www.dcceew.gov.au/water/cewo/monitoring/aquatic-ecosystems-toolkit
Department of Climate Change, Energy, the Environment and Water (2020a) Australia – present major vegetation groups – NVIS version 6.0 (Albers 100 m analysis product). Published date 14 June 2023, date updated 23 January 2024. (Australian Government) Available at https://fed.dcceew.gov.au/maps/e7c56ffd33714b1bbf64893b4f13c34a/about
Department of Climate Change, Energy, the Environment and Water (2020b) Australia – present major vegetation subgroups – NVIS version 6.0 (Albers 100 m analysis product). Published date 14 June 2023, date updated 22 April 2024. (Australian Government) Available at https://fed.dcceew.gov.au/maps/96c3ac9325e14816a6ef450998571146/about
Didan K (2021) MODIS/Terra vegetation indices 16-day l3 global 250 m SIN grid V061. (NASA EOSDIS Land Processes Distributed Active Archive Center) [Data set] 10.5067/MODIS/MOD13Q1.061
DiMiceli C, Townshend J, Carroll M, Sohlberg R (2021) Evolution of the representation of global vegetation by vegetation continuous fields. Remote Sensing of Environment 254, 112271.
| Crossref | Google Scholar |
Docker B, Robinson I (2014) Environmental water management in Australia: experience from the Murray–Darling Basin. International Journal of Water Resources Development 30(1), 164-177.
| Crossref | Google Scholar |
Fawcett T (2006) An introduction to ROC analysis. Pattern Recognition Letters 27(8), 861-874.
| Crossref | Google Scholar |
Gorelick N, Hancher M, Dixon M, Ilyushchenko S, Thau D, Moore R (2017) Google Earth engine: planetary-scale geospatial analysis for everyone. Remote Sensing of Environment 202, 18-27.
| Crossref | Google Scholar |
Grafton RQ, Wheeler SA (2018) Economics of water recovery in the Murray–Darling Basin, Australia. Annual Review of Resource Economics 10(1), 487-510.
| Crossref | Google Scholar |
Green AJ, Elmberg J (2014) Ecosystem services provided by waterbirds. Biological Reviews 89(1), 105-122.
| Crossref | Google Scholar | PubMed |
Green AJ, Jenkins KM, Bell D, Morris PJ, Kingsford RT (2008) The potential role of waterbirds in dispersing invertebrates and plants in arid Australia. Freshwater Biology 53, 380-392.
| Crossref | Google Scholar |
Hahn S, Bauer S, Klaassen M (2007) Estimating the contribution of carnivorous waterbirds to nutrient loading in freshwater habitats. Freshwater Biology 52(12), 2421-2433.
| Crossref | Google Scholar |
Hahn S, Bauer S, Klaassen M (2008) Quantification of allochthonous nutrient input into freshwater bodies by herbivorous waterbirds. Freshwater Biology 53, 181-193.
| Crossref | Google Scholar |
Hersbach H, Bell B, Berrisford P, Hirahara S, Horányi A, Muñoz-Sabater J, Nicolas J, Peubey C, Radu R, Schepers D, Simmons A, Soci C, Abdalla S, Abellan X, Balsamo G, Bechtold P, Biavati G, Bidlot J, Bonavita M, De Chiara G, Dahlgren P, Dee D, Diamantakis M, Dragani R, Flemming J, Forbes R, Fuentes M, Geer A, Haimberger L, Healy S, Hogan RJ, Hólm E, Janisková M, Keeley S, Laloyaux P, Lopez P, Lupu C, Radnoti G, de Rosnay P, Rozum I, Vamborg F, Villaume S, Thépaut JN (2020) The ERA5 global reanalysis. Quarterly Journal of the Royal Meteorological Society 146(730), 1999-2049.
| Crossref | Google Scholar |
Jenkins KM, Boulton AJ (2003) Connectivity in a dryland river:short-term aquatic microinvertebrate recruitment following floodplain inundation. Ecology 84, 2708-2723.
| Crossref | Google Scholar |
Killough B, Rizvi S, Lubawy A (2021) Advancements in the open data cube and the use of analysis ready data in the cloud. In ‘Proceedings of 2021 IEEE International Geoscience and Remote Sensing Symposium IGARSS’, 11–16 July 2021, Brussels, Belgium. pp. 1793–1795. (IEEE) 10.1109/IGARSS47720.2021.9553063
Kingsford RT, Johnson W (1998) Impact of water diversions on colonially nesting waterbirds in the Macquarie Marshes of Arid Australia. Colonial Waterbirds 21(2), 159-170.
| Crossref | Google Scholar |
Kingsford RT, Thomas RF (1995) The Macquarie Marshes in arid Australia and their waterbirds: a 50-year history of decline. Environmental Management 19(6), 867-878.
| Crossref | Google Scholar |
Kingsford RT, Brandis K, Thomas RF, Crighton P, Knowles E, Gale E (2004) Classifying landform at broad spatial scales: the distribution and conservation of wetlands in New South Wales, Australia. Marine and Freshwater Research 55, 17-31.
| Crossref | Google Scholar |
Kingsford RT, Roshier DA, Porter JL (2010a) Australian waterbirds – time and space travellers in dynamic desert landscapes. Marine and Freshwater Research 61(8), 875-884.
| Crossref | Google Scholar |
Kingsford RT, Porter JL, Brandis KJ, Ryall S (2020) Aerial surveys of waterbirds in Australia. Scientific Data 7, 172.
| Crossref | Google Scholar |
Krause C, Dunn B, Bishop-Taylor R, Adams C, Burton C, Alger M, Chua S, Phillips C, Newey V, Kouzoubov K, Leith A, Ayers D (2021) Digital Earth Australia notebooks and tools repository. (Geoscience Australia) Available at https://docs.dea.ga.gov.au/notebooks/README.html
Kuhn M (2008) Building predictive models in R using the caret package. Journal of Statistical Software 28(5), 1-26.
| Crossref | Google Scholar |
Leslie DJ (2001) Effect of river management on colonially nesting waterbirds in the Barmah–Millewa Forest, south-eastern Australia. Regulated Rivers: Research & Management 17(1), 21-36.
| Crossref | Google Scholar |
Maher MT, Braithwaite LW (1992) Patterns of waterbird use in wetlands of the Paroo, a river system of inland Australia. The Rangeland Journal 14(2), 128-142.
| Crossref | Google Scholar |
Martin GR, Portugal SJ (2011) Differences in foraging ecology determine variation in visual fields in ibises and spoonbills (Threskiornithidae). Ibis 153, 662-671.
| Crossref | Google Scholar |
Meeson N, Robertson AI, Jansen A (2002) The effects of flooding and livestock on post-dispersal seed predation in river red gum habitats. Journal of Applied Ecology 39(2), 247-258.
| Crossref | Google Scholar |
Mueller N, Lewis A, Roberts D, Ring S, Melrose R, Sixsmith J, Lymburner L, McIntyre A, Tan P, Curnow S, Ip A (2016) Water observations from space: mapping surface water from 25 years of Landsat imagery across Australia. Remote Sensing of Environment 174, 341-352.
| Crossref | Google Scholar |
Phillips LB, Hansen AJ, Flather CH (2008) Evaluating the species energy relationship with the newest measures of ecosystem energy: NDVI versus MODIS primary production. Remote Sensing of Environment 112(12), 4381-4392.
| Crossref | Google Scholar |
Pickens BA, King SL (2014) Linking multi-temporal satellite imagery to coastal wetland dynamics and bird distribution. Ecological Modelling 285, 1-12.
| Crossref | Google Scholar |
Rayner TS, Kingsford RT, Suthers IM, Cruz DO (2015) Regulated recruitment: native and alien fish responses to widespread floodplain inundation in the Macquarie Marshes, arid Australia. Ecohydrology 8(1), 148-159.
| Crossref | Google Scholar |
Roshier DA, Robertson AI, Kingsford RT, Green DG (2001) Continental-scale interactions with temporary resources may explain the paradox of large populations of desert waterbirds in Australia. Landscape Ecology 16, 547-556.
| Crossref | Google Scholar |
Roshier DA, Doerr VAJ, Doerr ED (2008) Animal movement in dynamic landscapes: interaction between behavioural strategies and resource distributions. Oecologia 156, 465-477.
| Crossref | Google Scholar | PubMed |
Wassens S, Turner A, Spencer J, Brandis K, Michie L, Duncan M, Thiem J, Thomas R, Shuang X, Kobayashi T, Bino G, Talbot S, Moore E, Heath J, Hall A (2022) Commonwealth environmental water office monitoring, evaluation and research program Murrumbidgee River system technical report, 2014-22. Charles Sturt University.
Appendix A1.List of colonial waterbird species included in analyses and their nesting classification
| Classification | Species | |
|---|---|---|
| Ground-nesting species | Australian pelican, Pelecanus conspicillatus | |
| Shrub-nesting species | Australian white ibis, Threskiornis moluccus | |
| Shrub-nesting species | Glossy ibis, Plegadis falcinellus | |
| Shrub-nesting species | Royal spoonbill, Platalea regia | |
| Shrub-nesting species | Straw-necked ibis, Threskiornis spinicollis | |
| Tree-nesting species | Australasian darter, Anhinga novaehollandiae | |
| Tree-nesting species | Cattle egret, Bubulcus ibis | |
| Tree-nesting species | Egrets | |
| Tree-nesting species | Great cormorant, Phalacrocorax carbo | |
| Tree-nesting species | Great egret, Ardea alba | |
| Tree-nesting species | Intermediate egret, Ardea intermedia | |
| Tree-nesting species | Little black cormorant, Phalacrocorax sulcirostris | |
| Tree-nesting species | Little egret, Egretta garzetta | |
| Tree-nesting species | Little pied cormorant, Microcarbo melanoleucos | |
| Tree-nesting species | Nankeen night heron, Nycticorax caledonicus | |
| Tree-nesting species | Pied cormorant, Phalacrocorax varius | |
| Tree-nesting species | White-faced heron, Egretta novaehollandiae | |
| Tree-nesting species | White-necked heron, Ardea pacifica | |
| Tree-nesting species | Yellow-billed spoonbill, Platalea flavipes |