

Australian chlorofluorocarbon (CFC) emissions: 1960–2017
Paul J. Fraser A D , Bronwyn L. Dunse A , Paul B. Krummel A , L. Paul Steele A , Nada Derek A , Blagoj Mitrevski A , Colin E. Allison A , Zoë Loh A , Alistair J. Manning B , Alison Redington B and Matthew Rigby C
A Climate Science Centre, CSIRO Oceans and Atmosphere, Aspendale, Vic. 3195, Australia.
B Hadley Centre, UK Met Office, Exeter, EX1 3PB, UK.
C School of Chemistry, University of Bristol, Bristol, BS8 1TH, UK.
D Corresponding author. Email: paul.fraser@csiro.au
Environmental Chemistry 17(8) 525-544 https://doi.org/10.1071/EN19322
Submitted: 20 December 2019 Accepted: 26 August 2020 Published: 1 October 2020
Journal Compilation © CSIRO 2020 Open Access CC BY-NC
Environmental context. Chlorofluorocarbons (CFCs) are potent greenhouse and stratospheric ozone depleting trace gases. Their atmospheric concentrations are in decline, thanks to global production and consumption controls imposed by the Montreal Protocol. In recent years, the rates of decline of CFC atmospheric concentrations, especially for CFC-11 (CCl3F), are not as large as anticipated under the Protocol, resulting in renewed efforts to estimate CFC consumption and/or emissions to possibly identify new or poorly quantified sources.
Abstract. Australian emissions of chlorofluorocarbons (CFCs) have been estimated from atmospheric CFC observations by both inverse modelling and interspecies correlation techniques, and from CFC production, import and consumption data compiled by industry and government. Australian and global CFC emissions show similar temporal behaviour, with emissions peaking in the late-1980s and then declining by ~10 % per year through to the present. Australian CFC emissions since 1978 account for less than 1 % of global emissions and therefore make a correspondingly small contribution to stratospheric ozone depletion. The current CFC emissions in Australia are likely from ‘banks’ of closed-cell foams, and refrigeration–air conditioning equipment now more than 20 years old. There is no evidence of renewed consumption or emissions of CFCs in Australia. The reduction in CFC emissions has made a significant contribution to reducing Australian greenhouse gas emissions.
Keywords: atmospheric and ‘bottom-up’ emissions estimates, Australian and global chlorofluorocarbon emissions, emission estimates by inverse calculations and interspecies correlation, impacts on ozone depletion and climate change.
Introduction
Chlorofluorocarbons (CFCs) have been used extensively over the past 70 years as refrigerants, aerosol propellants, foam blowing and foam insulating agents, and solvents. CFCs used in aerosol cans and as solvents are typically released to the atmosphere within a few years of production, while CFCs in refrigeration and air conditioning equipment and in foams are released over longer time scales, up to decades. CFCs released to the atmosphere since the mid-20th century are responsible for ~35 % of stratospheric ozone depletion arising from natural and anthropogenic chlorine and bromine-containing ozone depleting substances (ODSs) and nearly 10 % of climate change driven by long-lived greenhouse gases – GHGs (Molina and Rowland 1974; Ramanathan 1975; Carpenter and Reimann 2014; Myhre and Shindell 2014).
The global production and consumption of CFCs, which currently supply 60 % of ozone depleting chlorine from the troposphere to the stratosphere (Rigby et al. 2014), were phased-out in 2010 under the international obligations of the Montreal Protocol (UNEP 2012). Under the same Protocol, manufacture and importation of CFCs within and into Australia were effectively banned at the end of 1995 (95 % phase-out), which, at that time, was well ahead of the requirements of the Montreal Protocol for developed countries (50 % phase-out by 2000; Environment Australia 2001). Although designed primarily to control the global production and consumption of ODSs, the resultant reduction in ODS emissions has had a significant impact on the mitigation of climate change (Velders et al. 2007; Carpenter and Daniel 2018).
Global emissions of the major CFCs – CFC-12 (CCl2F2), CFC-113 (CCl2FCClF2) and, in particular CFC-11 (CCl3F) – have not declined as rapidly as expected under the Montreal Protocol controls on production and consumption (Engel and Rigby 2018; Montzka et al. 2018). New, globally significant CFC-11 emissions, which commenced in ~2012 from east Asia, are a significant driver of the recent increase in global CFC-11 emissions (Montzka et al. 2018; Rigby et al. 2019). If global CFC-11 emissions were to continue into the future at the recent enhanced rate of 67 Gg per year, it could delay recovery of mid-latitude and Antarctic ozone depletion by ~7 and 20 years respectively (Carpenter and Daniel 2018). Avoiding these increased CFC-11 emissions could have a larger positive impact on stratospheric ozone than any other policy option considered in the latest assessment of stratospheric ozone depletion, including destruction of the CFCs still existing in CFC ‘banks’ found in foams, refrigeration and air conditioning equipment (Carpenter and Daniel 2018). However, recent re-evaluations of the magnitude of global CFC banks, and their related CFC emissions, indicate they may be underestimated (Lickley et al. 2020) and destruction of the CFC banks may be comparable, in relation to ozone recovery, to avoiding the increased CFC emissions from east Asia.
Countries are being encouraged to take action to locate and dispose of these banks of CFCs (Nature 2020). As with CFC-11, further, but smaller, delays in Antarctic ozone recovery might be anticipated if levels of CFC-12 and CFC-113 in the atmosphere do not decline as fast as anticipated (Carpenter and Reimann 2014) under Montreal Protocol production and consumption restrictions.
These findings have encouraged a new focus on the status of current CFC-11 emissions, and on emissions of other CFCs, at global and national levels, in both developed and developing countries. The Scientific Assessment Panel (SAP) to the Montreal Protocol, through SPARC (Stratosphere-troposphere Processes And their Role in Climate), is reviewing global CFC-11 research activities and is identifying research and observational gaps, to more accurately define the CFC-11 problem and recommend possible measures to address this issue (Harris et al. 2019). In this paper, we identify CFC emissions from south-east Australia (Victoria, SE South Australia, southern NSW, Tasmania) and estimate Australian CFC emission from their inception in the early 1960s through to 2017, in the context of this global effort to better understand past and present CFC emissions.
Australian atmospheric CFC trends and emissions (1983–2017) are estimated from observations made at Cape Grim, Tasmania (40.7 °S, 144.7 °E; 1982–2018) and Aspendale, Victoria (38.0 °S, 145.1 °E; 2004–2018), and, in the absence of atmospheric observations, from Australian CFC consumption estimates from production, import and export data for 1962–1982, compiled by the Australian government and the Australian refrigeration and air conditioning industries.
Comparisons of total emission and consumption data enable qualitative estimates of remaining CFC ‘banks’ in Australia and current and possible future emissions are discussed in terms of these legacy ‘banks’. Reducing CFC emissions can be significant in climate change mitigation. We assess the changes in Australian CFC emissions in the context of efforts to reduce total Australian GHG emissions.
Global CFC emissions
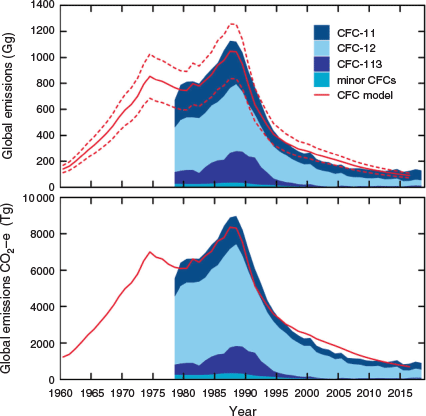
Global emissions of major and minor CFCs based on atmospheric observations – so-called ‘top-down’ estimates – peaked in 1987–88 at over 1100 Gg (k tonnes) per year (Fig. 1), declining by ~90 % (10 % per year) to 120 Gg in 2015. Global summed emissions of CFC-11, CFC-12 and CFC-113 from atmospheric observations peaked at 1090 Gg in 1987–88 and at 1050 ± 90 (95 % confidence interval, CI) Gg in 1987–88 from a model estimating emissions from CFC production, consumption and ‘banks’ – so-called ‘bottom-up’ estimates (Fig. 1; Rigby et al. 2014; Engel and Rigby 2018; Prinn et al. 2018; Lickley et al. 2020). These declining CFC emissions translate into a significant decline (~90 %) in carbon dioxide equivalent (CO2-e) emissions of 8000 Tg (1 Tg = 103 Gg) over the same period (Fig. 1).
|
Emissions of CFC-12 (CCl2F2) have declined approximately exponentially over this period, as expected under the Montreal Protocol, whereas emissions of CFC-11, CFC-113 (CCl2FCClF2), ΣCFC-114 (= CClF2CClF2+CCl2FCF3) and CFC-115 (CClF2CF3) stopped declining by the mid-2000s (Rigby et al. 2014; Engel and Rigby 2018; Montzka et al. 2018; Prinn et al. 2018; Vollmer et al. 2018). These data suggest that the emissions of all CFCs, except CFC-12, have not been responding as anticipated to Montreal Protocol-based restrictions on consumption since the mid-2000s. Subsequently, there has been an unexpected and persistent increase in global CFC-11 emissions since 2012 (Engel and Rigby 2018; Montzka et al. 2018; Prinn et al. 2018), owing largely to increased emissions from east Asia (Montzka et al. 2018), in particular from eastern mainland China (Rigby et al. 2019). South-west and central China may also be possible source regions for CFC-11 emissions (Lin et al. 2019), but it is not known whether emissions from these regions have increased in recent years. For the period 1978–2010, global CFC-11 emissions comprised 35 ± 5 (1σ) % of global CFC emissions; today (2015–2018) the CFC-11 fraction of global CFC emissions has increased to 60 ± 2 (1σ) %, largely owing to these increased emissions from China.
The increased emissions of CFC-11 from China are unlikely to arise from increased rates of release from pre-phase-out banks of CFC-11 in existing foams and refrigeration equipment, but are probably the result of new production and consumption not reported to the United Nations (Montzka et al. 2018; Rigby et al. 2019). To better quantify the magnitude and location of CFC-11 emissions in China, enhanced CFC-11 monitoring activities in China have been foreshadowed (Cyranoski 2019). There has also been a small but significant increase in global CFC-115 emissions since 2010, likely from east Asia-China (Engel and Rigby 2018; Vollmer et al. 2018).
In this paper, estimates of Australian CFC emissions from early 1960s to 2017 are based on atmospheric CFC observations at Cape Grim, Tasmania (1982–2018) and, in the absence of atmospheric data (1960s-early 1980s), are based on CFC consumption data, assuming that CFC emissions are related to CFC consumption. Australian CFC consumption data are based on CFC production data, compiled by the Australian CFC production industry, and CFC import data, compiled by the Australian government.
Australian CFC production, imports, exports and consumption
CFC production and imports
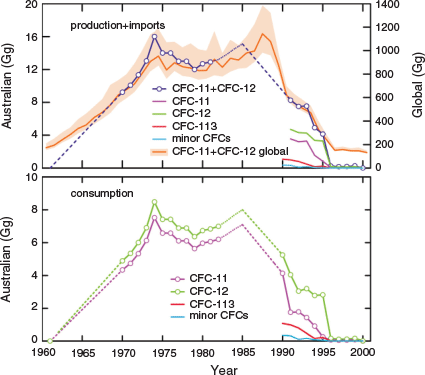
Two companies, Australian Fluorine Chemicals (AFC) and Pacific Chemicals Industries (PCI), commenced production of CFC-11/CFC-12 in Sydney, Australia, in the early 1960s. During 1970–1974, 75 % of Australian production was for aerosol products, 15 % for refrigeration and 10 % for foams (DEHCD 1976); by 1979–1980, the production split was 50 % for aerosols, 30 % for refrigeration and 20 % for foams (AEC/NHMRC 1983). Assuming 90 % of refrigeration was CFC-12 based (10 % CFC-11), foams were 90 % CFC-11 based (10 % CFC-12) and aerosols were 50 %/50 % CFC-11/CFC-12 (AFEAS 1997), then the overall Australian CFC production split would have been 46 % CFC-11/54 % CFC-12 in 1970–1980.
The only CFCs known to have been produced in Australia were CFC-11 and CFC-12, whose productions were reported as CFC-11+CFC-12. If CFC-113 had been produced in Australia, it would have been reported along with CFC-11+CFC-12 production. The global CFC-113 market in the 1960s was <10 % of the CFC-11+CFC-12 market and it is unlikely that the Australian CFC-113 market at that time would have been large enough to justify the installation of a separate production facility for CFC-113.
Data on Australian CFC production are limited, but available for the combined production of CFC-11 and CFC-12 for 1970–1981 and 1991–1995; scenarios of CFC-11+CFC-12 production and their uncertainties (±30 %, 1σ), based on the phase-out schedules for CFCs in aerosols, are available for 1982–1985 (Fig. 2; DEHCD 1976; AEC/NHMRC 1983); data are also available for the separate production of CFC-11 and CFC-12 for 1991–1995, after which production ceased (Environment Australia 2001). Production is assumed to be zero in 1962. For the intervening periods (1962–1969, 1986–1990), production data are obtained by linear interpolation.
|
The earliest CFC import data for Australia are from 1991. Once CFC production commenced in Australia, CFC imports were near zero (AEC/NHMRC 1983); however, pre-1962 (pre-production), small quantities of CFC imports were likely.
The data on Australian CFC-11+CFC-12 production and imports follows a similar pattern to global CFC-11+CFC-12 production (Fig. 2), the latter with peaks in 1974 and 1987–1988 (Lickley et al. 2020). Data on Australian production plus imports show an initial peak in 1974 and a second peak ~1985 (scenario data, AEC/NHMRC 1983), although a later peak is possible as the scenario data do not extend beyond 1985. Total Australian production plus imports for 1962–2000 was 345 Gg (k tonnes), assuming no CFC imports before 1962, which is 1.3 % of global production (25.1 Gg; Lickley et al. 2020) over the same period. The Australian gross domestic product (GDP) was 1.3 % of global GDP over the same period (https://data.worldbank.org/indicator/NY.GDP.MKTP.CD [verified March 2020]).
If there were Australian CFC imports before 1990 and 1970 such that Australian production plus imports followed the global production trends reported by Lickley et al. (2020) for 1960–1970 and 1985–1990, then total Australian production plus imports for 1960–2000 would have been ~5 % larger or 1.4 % of global production.
Australian production plus imports of CFC-11+CFC-12 declined by nearly 50 % from 8.3 Gg in 1991 to 4.1 Gg in 1995, 47 % CFC-11 and 53 % CFC-12 over this 5-year period, similar to the CFC split described above for 1970–1980 based on the CFC usage pattern in aerosols, refrigeration and foams. A 47 : 53 production split for CFC-11+CFC-12 is assumed for those years where individual CFC production data were not available.
There are no published estimates of the uncertainties in Australian CFC production. Historically, CFC producers globally have estimated the uncertainty in reported CFC production data at ±0.5 % (Fisher and Midgley 1994). However, production of CFC-11 and CFC-12 reported to UNEP (United Nations Environment Programme) differed from industry estimates in 1989 by ~5 %, with an additional 12–25 % of unreported production (Campbell and Shende 2005). A recent (Lickley et al. 2020) analysis of CFC-11+CFC-12 production, based on data reported to UNEP, suggest an average uncertainty range of ±20 % (95 % CI).
It is unlikely that there was unreported CFC production in Australia. For the 35-year CFC production period (1962–1995), there are production data for 18 years (1970–1981, 1991–1995) and production scenario data for four years (1982–1985), based on hydrocarbons replacing CFCs as aerosol propellants, resulting in the early closure of one CFC production facility (AEC/NHMRC 1983). If we assume ±10 % (2σ) uncertainty for these years and ±20 % (2σ) uncertainty for the years when production is calculated by linear interpolation, this results in an overall uncertainty of total Australian production of ±25 % (2σ).
Decommissioning of Australian CFC production facilities in Sydney commenced in the mid-1980s (AFC) and was completed in 1995 (PCI). To meet CFC demand in Australia, significant imports of CFC-11 and CFC-12 commenced, or possibly recommenced, in the mid-1980s and continued until 2000 when CFC imports had essentially ceased (Environment Australia 2001).
CFC exports and consumption
During the period 1990–1995, Australia exported 55 % of CFC-11 and 20 % of CFC-12 produced and imported (Environment Australia 2001). CFC-11 and CFC-12 are typically co-produced (TEAP 2019).
CFC consumption (production plus imports minus exports) data are available for CFC-11, CFC-12, CFC-113, CFC-114, the latter likely containing some CFC-114a, and CFC-115 for the period 1990–2000; the combined consumption of CFCs (CFC-11, CFC-12) was 14 Gg (14 k tonnes) in 1986, the base year for phase-out under the Montreal Protocol (Environment Australia 2001). We assume that the contributions of CFC-11, CFC-12, CFC-113, CFC-114 and CFC-115 to total CFC consumption in 1986 were the same as in 1990. Assuming zero imports and exports of CFCs into and from Australia in 1974, then the combined consumption of CFC-11 and CFC-12 in 1974 would not have exceeded 16 Gg, the amount produced. There have been no significant imports of CFCs into Australia after 2000. Since CFC consumption in Australia accounted for 98 % of CFC production, the overall uncertainty in CFC-11+CFC-12 consumption is likely the same as for production i.e. ±25 % (2σ).
In summary, CFC-12 and CFC-11 consumption data, derived from combined CFC-11 and CFC-12 production and scenario data, are available for 1970–1985 and individual CFC-11, CFC-12, CFC-113, CFC-114 and CFC-115 consumption data are available for 1990–2000. There are no CFC-113, CFC-114 and CFC-115 consumption data available for pre-1990. CFC-11 and CFC-12 consumptions are assumed to be zero in 1962, the year before production commenced in Australia. As indicated above, there may have been CFC imports before the commencement of Australian CFC production. It is unlikely that production would have commenced without the previous demonstration of a market for products using CFCs. Such a market could only have been established with CFC imports.
For the periods 1962–1969 and 1986–1989, consumption data were obtained by linear interpolation of published consumption data (Environment Australia 2001). It could be assumed that, during these periods, trends in CFC consumption followed global trends, and this results in small consumption differences (5 % larger) compared with those resulting from linear interpolation.
The Australian CFC consumption data (1962–2000) are shown in Fig. 2. Peak consumption for these CFCs occurred in 1974 (CFC-11: 7.5 Gg; CFC-12: 8.5 Gg), followed by a slow decline to 1979 (CFC-11: 5.6 Gg; CFC-12: 6.4 Gg), then increasing to 1985 (CFC-11: 7.1 Gg; CFC-12: 8.0 Gg). From 1985 to 1996, CFC-11 consumption declined rapidly to less than 0.1 Gg. During this period, Australian CFC-12 consumption declined more slowly than CFC-11 consumption, falling to 2.8 Gg by 1995, but it then collapsed to under 0.2 Gg in 1996. By 2000, consumption of CFC-11 and CFC-12 in Australia had virtually been eliminated, each falling to less than 0.01 Gg per year.
Total Australian consumption for 1962–2000 was 150 ± 40 Gg for CFC-11, 175 ± 45 Gg for CFC-12 and 5 ± 1 Gg for CFC-113 (1990–2000), for a total of 330 ± 85 Gg (all uncertainties 2σ). Owing to lack of early import data, it is not possible to estimate Australian consumption for CFC-113, CFC-114 and CFC-115 before 1990.
Australian CFC recovery and destruction
In response to obligations under the Montreal Protocol, the Australian government has required, under the Ozone Protection and Synthetic Greenhouse Gas Management Act 1989 (DoEE 2018) that the Australian refrigeration and air conditioning industries deal responsibly with ODSs, mandating the recovery, reprocessing or destruction of refrigerants, including CFCs and hydrochlorofluorocarbons (HCFCs). In 1993, these industries established a not-for-profit organisation, Refrigerant Reclaim Australia (RRA), to recover, reclaim and destroy surplus and unwanted refrigerants (RRA 2018).
In 2003, legislation was enhanced (Ozone Protection and Synthetic Greenhouse Gas Legislation Amendment Act 2003; DoEE 2018) making it mandatory for these industries to recover, return and safely dispose of ozone depleting and synthetic greenhouse gas refrigerants, including hydrofluorocarbons (HFCs) and perfluorocarbons (PFCs). In Australia, nearly all refrigerant recovery, reprocessing and destruction is carried out in the RRA program. Of the refrigerants recovered, 91 % are destroyed, 6 % reclaimed, 2 % used as feedstocks and 1 % are stored (RRA 2018).
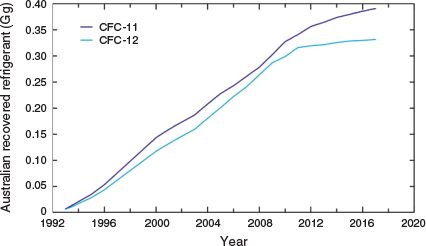
Since 1993, the RRA program has recovered over 6.5 Gg of surplus and unwanted refrigerants, including 3.2 Gg of HFCs, 2.6 Gg of HCFCs and 0.8 Gg of CFCs, including 0.4 Gg of CFC-11 and 0.3 Gg of CFC-12. The cumulative recoveries of CFC-11 and CFC-12 under the RRA program are shown in Fig. 3. Peak annual CFC-11 recovery occurred in 2010 (25 tonnes, 0.025 Gg) and, for CFC-12, 23 tonnes (0.023 Gg) in 2008. Small amounts of CFCs are still being recovered with 5 tonnes (0.005 Gg) of CFC-11 and 2 tonnes (0.002 Gg) of CFC-12 recovered in 2017 (M. Bennett, RRA, pers. comm., August 2018). The amounts of CFC-11 and CFC-12 recovered since 1993 (0.7 Gg) are small compared with the total CFC-11+CFC-12 consumption in Australia (1962–2000) of 325 Gg.
|
Experimental
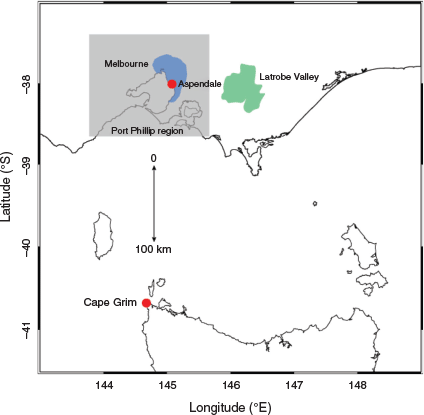
The atmospheric CFC data reported in this paper were obtained from in situ gas chromatographic (GC) instruments, incorporating electron capture detection (GC-ECD) and mass spectrometric detection (GC-MSD), operating at Cape Grim, Tasmania, and CSIRO Aspendale (Fig. 4). These activities are part of an international collaboration to measure abundances and trends of ODSs and non-CO2 greenhouse gases: GAGE (Global Atmospheric Gases Experiment, 1981–1994, Prinn et al. 2000; Fraser et al. 2016) and AGAGE (Advanced Global Atmospheric Experiment, 1994–present, Fraser et al. 2016; Prinn et al. 2018).
|
Quasi-continuous measurements of CFC-11 (1976–present), CFC-12 (1978–present), CFC-113 (1983–present), ΣCFC-114 and CFC-115 (1998–present) have been made at Cape Grim, using GC-ECD (CFC-11, CFC-12, CFC-113) and GC-MSD (CFC-113, ΣCFC-114, CFC-115) techniques (Fraser and Pearman 1978; Prinn et al. 2000, 2018; Sturrock et al. 2001; Krummel et al. 2006). The Cape Grim CFC-113 data were obtained initially (1983–2011) from GC-ECD instruments and more recently (2011–present) from a GC-MSD-Medusa instrument (Miller et al. 2008). For the period 2005–2010, a merged GC-ECD-GC-MSD CFC-113 dataset was used This change in CFC-113 measurement instrumentation was implemented because of superior GC-MSD precision compared with GC-ECD for CFC-113 and GC-ECD CFC-113 analysis problems (a post-2011 interfering chromatographic peak).
The AGAGE GC-MSD instruments at Cape Grim and Aspendale do not resolve CFC-114 (CClF2CClF2) and CFC-114a (CCl2FCF3) and we report their atmospheric abundances as a sum of CFC-114 and CFC-114a (ΣCFC-114) measurements. GC-MSD instrumentation at UEA (University of East Anglia) can separate and measure these CFCs. From analysis of the Cape Grim air archive at UEA, ΣCFC-114 measurements for baseline air at Cape Grim (and Aspendale) were a 93 : 7 mixture of CFC-114 and CFC-114a in 2016, and a 96 : 4 mixture in 1978 (Oram 1999; Sturrock et al. 2002; Laube et al. 2016; Vollmer et al. 2018).
The initial ΣCFC-114 data obtained at Cape Grim (1998–2004) on a GC-MSD-ADS (adsorption-desorption system; Prinn et al. 2000) were noisy (ΣCFC-114: ±0.3 ppt, ±2 %; CFC-115: ±0.5 ppt, ±6 %) and the small pollution episodes for ΣCFC-114 and CFC-115 could not be resolved from the baseline noise. From 2005, these small ΣCFC-114 (less than 0.3 ppt) and CFC-115 (less than 0.2 ppt) pollution episodes were detected from more precise data obtained on the GC-MSD-Medusa instrument with ΣCFC-114 and CFC-115 precisions of 0.3 % and 0.7 % respectively (Prinn et al. 2018). Pollution episodes at Aspendale are typically much larger than at Cape Grim and, for all CFCs, are well resolved on both GC-MSD instruments.
The carbon monoxide (CO) data for Cape Grim reported in this paper (1994–2018) were obtained from a GC instrument equipped with a mercuric oxide reduction (MRD) detector and for Aspendale (2018–2019) from a cavity ring-down spectrometer (CRDS).
Extensive details of GC instrumental analytical characteristics (precisions, linearity, calibration, overall measurement uncertainties) are given in Prinn et al. (2000, 2018) and Fraser et al. (2001, 2016). All CFC data are reported in the AGAGE SIO (Scripps Institution of Oceanography) gravimetric calibration scale. The CO data are reported in a CSIRO CO scale linked to a NOAA CO gravimetric scale (Novelli et al. 1991). Two types of GC-MSD instruments have been deployed at both Cape Grim and Aspendale, one using a pre-concentration, adsorption-desorption system operating at −50 °C (GC-MSD-ADS; Simmonds et al. 1995), the other using an enhanced cryogenic pre-concentration system operating at −165 °C (GC-MSD-Medusa; Miller et al. 2008; Arnold et al. 2012).
The GC-ECD, GC-MSD-ADS and GC-MSD-Medusa precisions (1 standard deviation (s.d.)) for the CFC-11, CFC-12 and CFC-113 measured at Cape Grim and Aspendale are similar on all three instruments: CFC-11, ±0.2 %; CFC-12, ±0.1 %; CFC-113, ±0.2 %. The CFC-114 and CFC-115 precisions on the GC-MSD-ADS at Cape Grim and Aspendale are ±2 % and ±6 % respectively. The CFC-114 and CFC-115 precisions on the GC-MSD-Medusa instruments at Cape Grim and Aspendale are ±0.3 % and ±0.7 % respectively. The GC-MRD CO precision is ±1 % (Francey et al. 1996). The CRDS CO measurement precisions at Aspendale and Cape Grim are ±3 % (near-infrared laser; Zellweger et al. 2019) and ±0.3 % (mid-infrared laser) respectively.
The absolute accuracies of the SIO CFC calibration scales have been estimated at 1–2 % (Prinn et al. 2018). Widely-deployed, independent CFC calibration standards are available from two USA laboratories (NOAA – National Oceanic and Atmospheric Administration, Boulder, Colorado, and SIO – La Jolla, California). The differences between the NOAA and SIO calibration scales for all five CFCs are less than 0.5 %. The absolute accuracy of the NOAA CO gravimetric scale is estimated to be ±3 % (Novelli et al. 1991).
The early CFC-11 GC-ECD measurement frequencies at Aspendale and Cape Grim were typically 3–4 per day, the GAGE CFC-11, CFC-12 and CFC-113 GC-ECD measurements at Cape Grim (1981–1994) were 12 per day, the AGAGE CFC-11, CFC-12, CFC-113 GC-ECD and the AGAGE CO GC-MRD measurements at Cape Grim (1994–present) are 18 per day. The air sample volume is 5 mL. These measurements are instantaneous with no time-averaged sampling.
The AGAGE CFC-11, CFC-12, CFC-113, ∑CFC-114, CFC-115 GC-MS measurement frequency at Aspendale (2005–present) and Cape Grim (1995–present) are 12 per day. The CFCs from each air sample (2 L) are cryo-trapped over 20 min, so the resultant measurement is a 20-min average, compared with the instantaneous measurements described above. At a sampling frequency of 12–18 CFC and CO measurements per day, the CFC and CO pollution episodes at Cape Grim (see below), which typically last 11–19 h, and Aspendale (8–24 h) are usually well resolved; the CO measurements at Aspendale are continuous.
The early atmospheric histories of CFC-113 (pre-1983) and CFC-114, CFC-115 (pre-1998) at Cape Grim were obtained from analysis of the Cape Grim air archive. The archive consists of ~120 baseline or background air samples (1978–present) collected at Cape Grim in 30–35 L stainless steel tanks at pressures from 700 to 3000 KPa. Collection and storage information, and a compendium of the 40-plus papers published using Cape Grim air archive data, are in Langenfelds et al. (1996) and Fraser et al. (2016, 2018). For CFC-114 and CFC-115, 55 air archive samples, from 43 months within the 1978–1998 timeframe, were analysed at CSIRO Aspendale on the GC-MS-Medusa instrument by BR Miller, a visiting scientist from SIO. Typically, each air archive sample was analysed five times; for CFC-114 and CFC-115, the average measurement precisions per sample were ± 0.3 % and ± 0.6 % respectively and for the three months when more than one sample was collected (two samples per month for June 1988 and January 1990, three samples per month for January 1997), the monthly precisions were ±0.9 % and ±0.6 % respectively.
The identification of pollution (local and regional) and baseline data in the AGAGE program is described in detail by O’Doherty et al. (2001) and Prinn et al. (2018). An identification flag (pollution or baseline) is assigned to each measurement using an objective (statistically based) algorithm. The algorithm examines the statistical distributions of 4-month bins of measurements (typically more than 4000 GC-ECD and 1400 GC-MSD measurements per bin), centred on one day at a time, after removing the trend over the bin period. A 3-D Lagrangian back-trajectory model, driven by re-analysed meteorology, is used to track the air-mass history of each measurement to confirm the statistical identification of pollution, e.g. whether the air mass passes over regions such as cities, which are likely sources of pollution. In addition, an observation is flagged as polluted if the atmosphere at the station is stable with low wind speeds and with known nearby pollution sources. Average annual pollution is a parameter used in this paper. This is the average in any one year of all data identified as pollution less a contemporary baseline value obtained from a best fit to all the baseline data in that year.
The Cape Grim CFC data identified as pollution are used to calculate regional emissions by interspecies correlation (ISC) and inverse modelling techniques (see below). The ISC technique involves using the back trajectories to further select CFC pollution data from only the regions for which emissions of the reference species (carbon monoxide – CO, in this study) have been independently estimated.
The Cape Grim CFC data reported in this paper are available at the AGAGE MIT webpage (https://agage.mit.edu/data/agage-data [verified December 2019]) and at the World Data Centre for Greenhouse Gases (WDCGG) webpage (https://gaw.kishou.go.jp/ [verified March 2020]). The Cape Grim CO data (1994–2000) are available from the WDCGG. The Cape Grim CO data (2001–2018) and Aspendale CFC (2005–2018) data are available on request (paul.krummel@csiro.au); the Aspendale CO data are preliminary (zoe.loh@csiro.au). The uncertainties for data in this paper are ±1σ unless otherwise indicated. The CFC emissions data are reported annually to the Australian government and are published in publicly accessible reports (e.g. Dunse et al. 2019). Long-term wind speed and direction records are available for Cape Grim but not for Aspendale; wind speed and direction data from the Bureau of Meteorology site at Moorabbin Airport, 7 km N of Aspendale, are used as proxy data for Aspendale, except for 2018–2019, when Aspendale wind direction data are available.
Results and discussion
CFCs in the Australian atmosphere
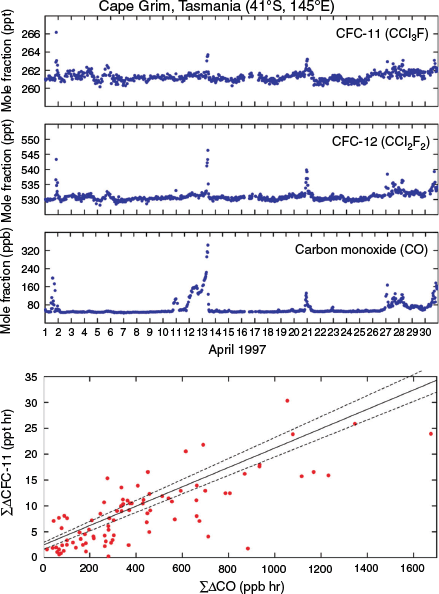
The first measurements of a CFC (CFC-11) in the Australian atmosphere were made at CSIRO, Aspendale, Victoria (Fig. 4), in July 1975 by PJ Fraser (CSIRO) and JE Lovelock (U. Reading, UK) using GC-ECD techniques (Fraser et al. 2018). The initial CFC-11 measurements at Aspendale (1975) and at the Australian Baseline Air Pollution Station at Cape Grim, Tasmania (1976, Fig. 4) were made as part of an independent CSIRO research program (1976–1983, Fraser and Pearman 1978; Fraser et al. 2016, 2018), but later, commencing in 1978, as part of a global, multi-laboratory, CFC measurement and modelling programs: AGAGE and predecessor programs (GAGE) and ALE (Atmospheric Lifetime Experiment) from 1978 to the present (Prinn et al. 2000, 2018).
The initial in situ GC-ECD CFC-11 measurements at Aspendale (Fraser et al. 1977) ceased in the late-1970s and were recommenced, along with measurements of CFC-12, CFC-113, ΣCFC-114 and CFC-115, using a GC-MSD-ADS instrument (2005–2006) and a GC-MSD-Medusa instrument (2006–present; Prinn et al. 2018). The Aspendale CFC records are not continuous, with significant periods of instrument down time in 2007, 2009 and 2012–2015 owing to instrumental and resource issues.
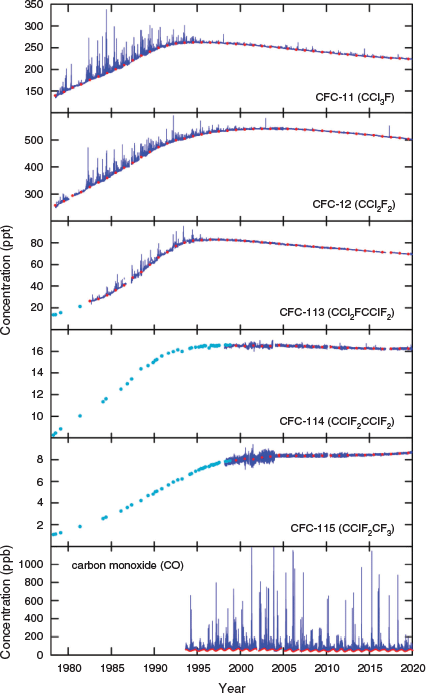
The CFC-11, CFC-12, CFC-113, ΣCFC-114, CFC-115 and CO data collected at Cape Grim and Aspendale are shown in Fig. 5 and Fig. 6 respectively. The baseline data at Cape Grim (Fig. 5) respond to global CFC emissions, transport processes between the northern and southern hemispheres and between the troposphere and the stratosphere (Ray et al. 2020), while the enhancements above baseline, so-called pollution events, arise from emissions of CFCs, largely from SE Australia. Baseline data for CFC-113, ΣCFC-114 and CFC-115 between 1978 and the time when in situ measurements commenced for each CFC have been obtained from analysis of the Cape Grim air archive (Fraser et al. 1996, 2018; Vollmer et al. 2018).
|
|
For CFC-11 at Cape Grim, maximum baseline concentrations (262.2 ± 0.4 ppt, parts per 1012 molar) were observed in 1995, declining by 14 % to 225.6 ± 0.2 ppt by 2018. The rate of decline of CFC-11 at Cape Grim has decreased from −1.9 ± 0.1 ppt per year (2006–2009) to −1.4 ± 0.3 ppt per year (2014–2018), the overall rate (2006–2018) being −1.7 ± 0.3 ppt per year.
For CFC-12, the maximum concentration (541.5 ± 1.3 ppt) occurred in 2004, declining by 6.2 % to 507.8 ± 0.4 ppt by 2018. The average rate of decline (2006–2018) at Cape Grim was −2.5 ± 0.6 ppt per year; unlike CFC-11, the rate of decline has increased, being −1.8 ± 0.3 ppt per year (2006–2009) increasing to −3.1 ± 0.4 ppt per year (2014–2018).
For CFC-113, the maximum concentration (82.8 ± 0.7 ppt) occurred in 1997, declining by 15 % to 70.4 ± 0.1 ppt in 2018. The rate of decline at Cape Grim has remained approximately constant: −0.6 ± 0.1 ppt per year (2006–2017), −0.7 ± 0.1 ppt per year (2006–2009) and −0.6 ± 0.1 ppt per year (2014–2018).
For ΣCFC-114, the maximum concentration (16.6 ± 0.1 ppt) occurred in 2004 declining by 1.9 % to 16.3 ± 0.1 ppt in 2018; for CFC-115, baseline concentrations, following a decade (2004–2013) of zero growth, have commenced to rise again, increasing overall from 7.8 ± 0.1 ppt in 1998 by 10 % to 8.6 ± 0.1 ppt in 2018.
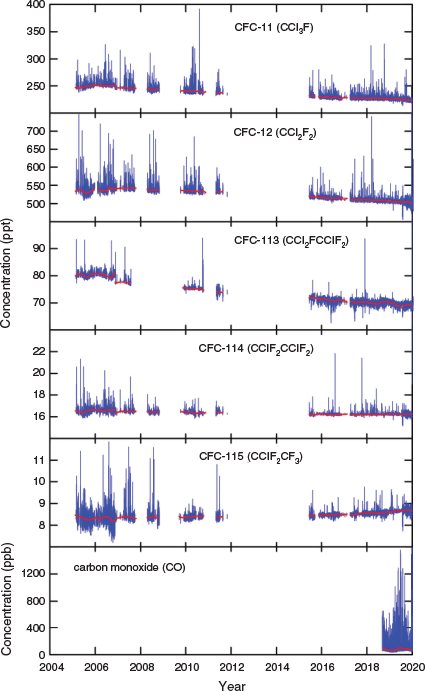
The Aspendale CFC and CO data are shown in Fig. 6. The Aspendale data define baselines for all CFCs similar to those observed at Cape Grim. In 2018, baseline annual concentrations for CFC-11, CFC-12, CFC-113, ΣCFC-114 and CFC-115 at Cape Grim were 225.6 ± 0.2, 507.8 ± 0.4, 70.4 ± 0.1, 16.3 ± 0.1 and 8.6 ± 0.1 ppt respectively, while for Aspendale they were 227 ± 2, 509 ± 3, 70.1 ± 0.7, 16.2 ± 0.1 and 8.6 ± 0.1 ppt respectively. Other years show a similar correspondence between baseline CFC levels observed at both locations.
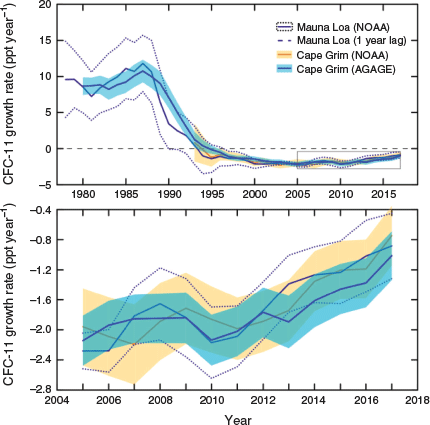
The rate of decline of CFC-11 in the atmosphere has slowed recently, as has been observed globally (Engel and Rigby 2018; Montzka et al. 2018), being −1.9 ± 0.1 ppt per year (2006–2009) increasing to −1.2 ± 0.3 ppt per year (2014–2017). This slowing of the expected rate of decline of CFC-11 in the atmosphere arises largely from new emissions of CFC-11 from east China (Rigby et al. 2019) and their impact on CFC-11 growth rates can be seen at Mauna Loa as well as at Cape Grim (Fig. 7). The CFC-11 growth rate at Mauna Loa stopped declining by 2001 and, for the following 13 years, averaged −2.0 ± 0.2 ppt per year before increasing around 2014, averaging −1.0 ± 0.2 for 2015–2018. For Cape Grim, the CFC-11 growth rate stopped declining around 2002, averaging −1.9 ± 0.1 until 2014, and increasing to −1.1 ± 0.2 for 2016–2018. The growth rate data in Fig. 7 suggest that the impact of the east China CFC-11 emissions is seen at Cape Grim ~1 year later than at Mauna Loa, owing to the 1–2 year interhemispheric transport time for long-lived tracers between the mid-latitudes of both hemispheres (Yang et al. 2019).
|
As observed at Cape Grim, the recent decline in Aspendale baseline CFC-11 levels has slowed. For the 3-year period of 2008–2011, background levels of CFC-11 declined by 6.2 ppt at Cape Grim and 6.7 ppt at Aspendale; for the 3-year period of 2015–2018, the declines were 3.5 ppt at Cape Grim and 3.8 ppt at Aspendale, with both sites showing a slowing in the rate of decline of 43–44 % over this period. At Aspendale, CFC-11 declined by −2.2 ± 0.9 ppt per year (2008–2011) and −1.3 ± 0.9 ppt per year (2015–2018).
Similar to observations at Cape Grim (Fig. 5), the CFC-12 data at Aspendale suggest an increase in the rate of decline, from −2.1 ± 0.3 ppt per year (2008–2011) to −3.1 ± 0.7 ppt per year (2015–2018), although the 2σ uncertainty levels overlap.
Baseline levels of CFC-113 at Aspendale show a significant decline, approximately constant in time (−0.8 ± 0.4 ppt per year, 2008–2011, −0.6 ± 0.2 ppt per year, 2015–2018). Baseline ΣCFC-114 levels are approximately constant and baseline levels of CFC-115 are increasing at Aspendale.
The Aspendale data show, for all CFCs, levels of pollution and pollution episodes that are observed at a higher frequency and at a greater magnitude compared with those at Cape Grim. Over the entire Aspendale record, the ratio of the annual average pollution data (the average enhancement of all CFC data identified as pollution above the corresponding baseline data in a particular year) at Aspendale to annual average pollution data at Cape Grim (2005–2018) is 10 ± 3 for CFC-11, 11 ± 2 (CFC-12), 6 ± 4 (CFC-113), 4 ± 2 (ΣCFC-114) and 3 ± 2 (CFC-115). This is indicative of the Aspendale instrument being much closer to the CFC pollution sources, largely from the Melbourne region, than the Cape Grim instrument. Cape Grim ‘sees’ CFC pollution, largely from the Melbourne urban complex, as an approximate point source 300 km away. Aspendale is embedded in the Melbourne CFC source region and likely ‘sees’ CFC pollution from 0–50 km away. Some of the pollution episodes seen at Aspendale are likely from a few 100 m away, so it is not surprising that they can be relatively large. The continuing observation of CFC pollution at Cape Grim and Aspendale after the CFC phase-out date reflects the existence of residual CFC ‘banks’ in the Melbourne region. The lower values for ΣCFC-114 and CFC-115 probably reflect the difficulty in identifying and quantifying pollution for these species in recent years when the levels of pollution are less than 0.1 ppt.
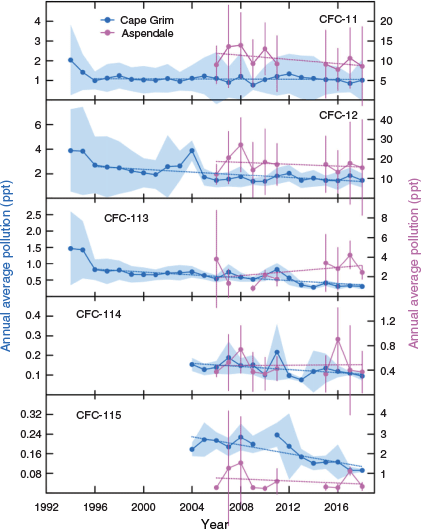
The Cape Grim and Aspendale CFC pollution data are shown in Fig. 8 and Table 1. The Cape Grim CFC-11 annual average pollution data show no significant change (−0.002 ± 0.004 ppt per year) from 1996 to 2018. The Aspendale CFC-11 average pollution data for 2015–2018 are ~20 % lower than CFC-11 pollution over the period 2007–2011, with the trend being −0.3 ± 0.2 ppt per year.
|

|
The Cape Grim CFC-12 annual average pollution data show about a 45 % decrease from 1996 to 2018, declining by −0.06 ± 0.02 ppt per year. The Aspendale CFC-12 average pollution for 2015–2018 are ~30 % lower than CFC-12 pollution over the period 2007–2011, although the trend (−0.2 ± 0.3 ppt per year) is not statistically significant.
The Cape Grim CFC-113 annual average pollution data declined by ~65 % from 1996 to 2018, declining by −0.022 ± 0.003 ppt per year. The Aspendale CFC-113 data suggest that the average pollution levels for 2015–2018 are ~60 % higher than for 2007–2011, with a trend of 0.12 ± 0.08 ppt per year. The Aspendale CFC-113 data are relatively poor quality for the period 2015–2018 compared with data from 2005–2011, making the detection of trends in the CFC-113 pollution data problematic. The Aspendale CFC-113 pollution data from 2006–2018 show a small, but barely significant, positive trend (0.10 ± 0.09 ppt per year).
The Cape Grim ΣCFC-114 annual average pollution data show a 50 % decline from 2004 to 2018, declining by 0.004 ± 0.002 ppt per year. The Aspendale ΣCFC-114 pollution data have not changed significantly from 2006 to 2018 (0.001 ± 0.015 ppt per year). The Cape Grim average annual CFC-115 pollution data have also declined by 50 % from 2004 to 2018, declining by −0.008 ± 0.002 ppt per year. The Aspendale CFC-115 data show declining pollution levels but the trend (−0.03 ± 0.04 ppt per year) is not statistically significant.
In summary, CFC-11, CFC-12 and CFC-113 pollution levels at Cape Grim have declined significantly since 1994, and ∑CFC-114 and CFC-115 pollution levels at Cape Grim have declined significantly since 2004. Aspendale CFC-11 and CFC-12 pollution levels have declined significantly since 2006, while Aspendale CFC-113 pollution levels have increased since 2006. ∑CFC-114 and CFC-115 pollution levels at Aspendale have not changed significantly since 2006.
The likely Melbourne origin of CFC pollution observed at Cape Grim is consistent with the CFC pollution ‘roses’ (Fig. 9) derived from the Cape Grim data for CFC-11, CFC-12 and CFC-113 (similar results – not shown – are obtained for ΣCFC-114 and CFC-115). In 1994–1996, CFC-11 pollution arriving at Cape Grim showed a maximum of 0.8 ppt in the 15 °–25 ° sector; by 2014–2016 this pollution maximum had declined by 45 %, consistent with declining emissions from Melbourne (see below). For CFC-12, the 1994–1996 pollution maximum in the 15 °–25 ° sector was 2.5 ppt, declining by over 90 % by 2014–2016, again consistent with declining emissions (see below). For CFC-113, the 1994–1996 pollution maximum in the 15 °–25 ° sector was 0.35 ppt, declining to near zero by 2004–2006 and remaining near zero through 2014–2016.

|
CFC-11, CFC-12 and CFC-113 pollution ‘roses’ for Aspendale are shown in Fig. 10. Owing to significant gaps in the CFC records at Aspendale, the pollution episodes are grouped into 2 periods: 2006–2012 and 2016–2018. There has been a 60 % decline in CFC-11 pollution between these periods and an 85 % decline in CFC-12 pollution over the same period, similar to the reductions in pollution for these CFCs seen at Cape Grim, indicative of declining emissions from the Melbourne region (see below).
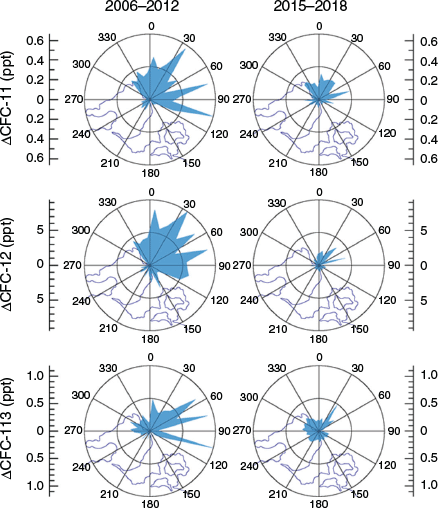
|
The Aspendale pollution ‘roses’ show that CFC-11, CFC-12 and CFC-113 emissions in the Melbourne region are largely from a sector NE of Aspendale. This is the same direction as the demographic (population) centre for Melbourne and suggests that the CFC emissions correlate with population density. The pollution ‘roses’ are not consistent with the locations of the major land-fill operations in Melbourne (NW, NE and SE of Aspendale, Fraser et al. 2014). The CFC pollution ‘roses’ are similar to those observed for the modern refrigerant HFC-134a (CH2FCF3), with significant population-dependent sources: automobile and domestic air conditioning and domestic refrigeration (Fraser et al. 2014).
Australian CFC emissions by interspecies correlation: 1994–2017
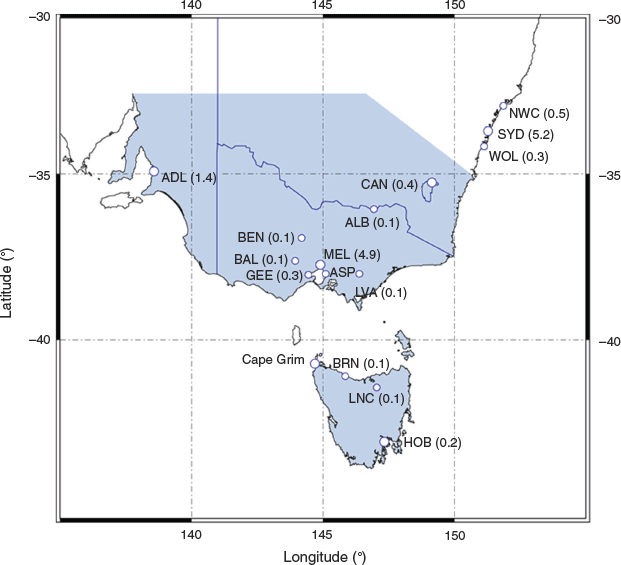
Atmospheric CFC and CO concentrations at Cape Grim respond to trace gas source fluxes embedded within a ‘footprint’ domain (Fig. 11) determined by the SE Australian meteorology. These ‘footprint’ maps are obtained from the UK Met Office NAME (Numerical Atmospheric dispersion Modelling Environment) Lagrangian particle dispersion model, described below, run in backward mode, to estimate the 30-day history of individual air masses arriving at Cape Grim. These 30-day history maps describe the surface fluxes in the previous 30 days that impact the observations at Cape Grim. The ‘footprint’ is a map of the dilution factors (s m−1) that relate trace gas concentrations (g m−3) to trace gas fluxes (g m−2 s−1). The annual maps (Fig. 11) are a sum of the hourly 30-day maps in any one year (Manning et al. 2011).

|
Based on these ‘footprint’ maps showing the spatial variation in these dilution factors and the locations of the population centres within the Cape Grim ‘footprint’, assuming regional emissions are proportional to regional population, CFC emissions from the Melbourne-Port Phillip region, including Ballarat and Bendigo, are calculated to have the largest impact (80 %) on Cape Grim measurements, followed by Sydney (10 %), Adelaide (4 %), Burnie-Launceston (3 %), Canberra (1 %), Albury-Wodonga (1 %), Hobart (1 %) and Brisbane-SE Queensland and Perth (both <1 %). More than 50 % of Australia’s population is in the Melbourne-Albury-Wodonga-Canberra-Sydney corridor. Fig. 11 shows that the Cape Grim ‘footprint’, and therefore the meteorology that brings air masses to Cape Grim, has not changed significantly over the period 2003–2018.
CFC emissions from the Melbourne-Port Phillip region (Fig. 4) have been estimated from Cape Grim pollution data by inter-species correlation (ISC; Dunse et al. 2001, 2005; 2019), where pollution episodes for species with unknown emissions, e.g. the CFCs, are compared with co-incident pollution episodes for a species with known emissions (e.g. CO; Fig. 12) within the Port Phillip region, where the source regions of both species are assumed to be approximately co-located. CFC and CO sources are not co-located precisely, although both CO and CFC-12 were both significantly emitted by automobile transport when CFC-12 was used in mobile air-conditioning. Both CO and CFC emissions appear to correlate with population density (see below). The error introduced into ISC emission calculations by source co-location uncertainty in the Port Phillip-Melbourne region is assumed to be small, especially as the resultant CO and CFC plumes are sampled at Cape Grim, 300 km away.
|
The CFC mass emission for the Melbourne-Port Phillip region for year x is calculated using Eqns 1 and 2:


where MCFC,x is the annual Port Phillip CFC mass emission for year x, MCO,x is the annual Port Phillip CO mass emission for year x, ACFC/CO, x – 1,x,x + 1 is the slope of the Cape Grim ΔCFC (CFC pollution) versus ΔCO (CO pollution) regression plot (Fig. 12) for years x – 1 to x + 1, MWCFC and MWCO are the molecular weights of the CFC and CO, ΔCOx is the annual average CO pollution at Cape Grim for year x and ΔCO2006 is the annual average CO pollution at Cape Grim for 2006.
The uncertainty in MCFC is the sum of the uncertainties in the slope term (αCFC/CO, ±5 %, 1 standard error (s.e.); Dunse 2002; this work), the CO emission term (MCO, ± 25 %, 1 s.e.; Dunse et al. 2005) and the ΔCOx/ΔCO2006 term (±15 %, 1 s.e.; this work). The 2006 Port Phillip CO emissions (796 Gg) are estimated as revisions (Delaney and Marshall 2011) to the Port Phillip Air Emissions Inventory (EPA 1998). The annual Port Phillip CO emissions are estimated by scaling the 2006 emissions by a factor equal to the ratio of the annual average Cape Grim CO pollution from Port Phillip in a particular year to the annual average Cape Grim CO pollution from Port Phillip in 2006.
Co-location of the CO and CFC emissions to the Port Phillip region is favoured by using only those CFC-CO pollution episodes that are shown to result from Port Phillip emissions by back trajectory techniques. As discussed above, Port Phillip emissions drive 80 % of all pollution data seen at Cape Grim. The next largest contributor is Sydney (10 %), followed by Adelaide (4 %); back trajectories ensure that no CFC or CO emissions from Sydney, Adelaide or the Latrobe Valley are involved in these ISC estimates of Melbourne-Port Phillip CFC emissions.
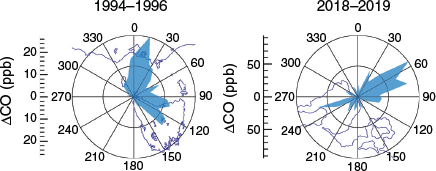
Within the Port Phillip-Melbourne region, CO emissions have been shown to correlate with population density (EPA 1998). The CFC (Fig. 10) and CO (Fig. 13) pollution ‘roses’ at Aspendale, with the dominant lobes pointing to the demographic centre of Melbourne, suggest that CFC emissions seen at Aspendale come from the populous NE sector while CO emissions also originate largely in this sector, probably owing to automobile emissions. From 350 km away at Cape Grim, the CFC (Fig. 10) and CO (Fig. 13) sources appear co-located.
|
Annual emissions, e.g. for 2010, are based on the pollution episodes for three consecutive years, 2009–2011; this enables 100–120 pollution episodes to be used to derive annual emissions of CFC-11 and CFC-12 and 20–30 pollution episodes used to derive emissions of CFC-113, ΣCFC-114 and CFC-115. This reduces year-to-year variability in emissions owing to variations in the air mass trajectories that bring polluted air from the Port Phillip region to Cape Grim.
NOAA air mass back trajectory analyses (Draxler and Hess 1997) and correlations with an urban marker species (HFC-134a, CH2FCF3) are used to confirm that the CFC pollution events at Cape Grim, used to derive CFC emissions, originate from the Melbourne-Port Phillip region. Air-mass back trajectories are used to exclude air parcels that have passed over the Latrobe Valley east of the Melbourne-Port Phillip region (Fig. 4), which has a disproportionately large CO source, with respect to population, from coal-fired power stations (EPA 1998).
A satellite-based bushfire-monitoring tool, Sentinel Hotspots (Geoscience Australia, https://hotspots.dea.ga.gov.au/ [verified December 2019]), provides dates and locations of fires across Australia. If available, this information is used to identify CO pollution events at Cape Grim that are affected by biomass burning (BMB). An alternative method to identify BMB uses a marker species, methyl chloride (CH3Cl), emitted significantly during BMB events. In addition, the intensity and structure of CO pollution episodes are used to identify BMB events; in particular, if the fire is in close proximity (e.g. on the Bass Strait islands) to Cape Grim. Cape Grim CO pollution episodes that are affected by BMB are excluded from this analysis.
Australian emissions are calculated from the Melbourne-Port Phillip region emissions, scaled on a population basis, with a scaling factor of 5.4. The ISC emission domain that impacts on Cape Grim is well defined by the back trajectories described above. The population within the domain is well quantified, so the error in the population ratio is likely to be small. However, there is an assumption that CFC emissions per capita are the same for the rest of Australia as they are for the Melbourne-Port Phillip region. We have no regional, e.g. Sydney, data to test this assumption.
These ISC-based annual emission estimates for Australia have been compared favourably to annual emission estimates from an independent technique – inverse modelling (InTEM, see below) for carbon tetrachloride (CCl4), where ISC/InTEM = 1.07 ± 0.10, 2002–2011 (Fraser et al. 2014) and HFC-152a (CH3CHF2), where ISC/InTEM = 0.97 ± 0.15, 2003–2011 (Simmonds et al. 2016). The ISC-based emission estimates for CFC-11, CFC-12 and CFC-113 are discussed below and shown in Fig. 14, together with emission estimates by inverse modelling.
|
Australian CFC emissions by inverse modelling: 2004–2017
The inverse modelling methodology (InTEM: Inversion Technique for Emission Modelling), used to estimate Australian CFC emissions, has been developed over the past two decades at the UK Met Office (Manning et al. 2003, 2011; Arnold et al. 2018) and derives an emissions distribution map that, when dispersed by atmospheric mixing processes, produces a time series of model CFC measurements at Cape Grim that best matches, through a minimisation technique, the actual CFC observations at Cape Grim.
The Lagrangian atmospheric transport model NAME simulates the atmospheric processes that disperse these gridded emissions. NAME has also been developed at the UK Met Office (Ryall and Maryon 1998; Jones et al. 2007; Manning et al. 2018) and employs underpinning 3-D meteorology from the Met Office operational weather forecast model (UM – Unified Model). NAME follows theoretical particles in the modelled 3-D atmosphere defined by the UM meteorology. Insights into how gridded emissions are dispersed and diluted in the atmosphere can be obtained by following the release of many thousands (~20) of such particles into the specified NAME model domain. NAME is run backwards in time to estimate the previous 30-day history of the air before it arrives at Cape Grim. The UM horizontal and vertical resolutions (40 km, 31 levels in 2002) have improved with time (horizontal: 40 km to 10 km in 2018; vertical: 31 to 59 levels in 2018). The horizontal resolution of the NAME output is set at 25 km.
InTEM can robustly estimate CFC emissions from regions that contribute significantly to the atmospheric CFC concentration observed at Cape Grim. The contributions that different regions (boxes) make to the observed Cape Grim concentrations vary. Grid boxes that are distant from Cape Grim contribute little to the observed concentrations, whereas those that are close to Cape Grim have a larger impact. To balance the contributions from different grid boxes, those that are more distant from Cape Grim are grouped together into increasingly larger regions. There are inherent uncertainties in both the Cape Grim and meteorological observations and in the temporal-spatial resolution of the inverse model. Their magnitudes have been estimated and are incorporated into the InTEM framework to derive an overall uncertainty of the resulting model emissions.
In this study, a 3-year inversion period is used which increments at 1-year intervals. As with the ISC technique above, use of a 3-year inversion period increases the number of observations within the inversion period, thereby reducing the uncertainty in the resultant emissions. However, information on any possible seasonality of emissions is lost. The inversion system uses observational data from only one measurement site (Cape Grim), which means that some likely large emission source regions in Australia, for example the Brisbane/Gold Coast/Sunshine Coast and Sydney/Wollongong/Newcastle regions, with ~40 % of Australia’s population, contribute a very small component of the measured signal on an infrequent basis.
InTEM CFC emission estimates are made for the SE region of Australia that incorporates all of Victoria and Tasmania as well as southern and south-western New South Wales and eastern South Australia (Fig. 15), with ~38 % of Australia’s population. Assuming CFC emissions are proportional to population, Australian CFC emissions are obtained by scaling these SE Australian emissions on a population basis. InTEM uses a population-based scaling factor of 2.65 (1/0.378). For this study, InTEM is initiated with a 1 k tonne repeating annual source for each CFC for all Australia, distributed on a population basis.
|
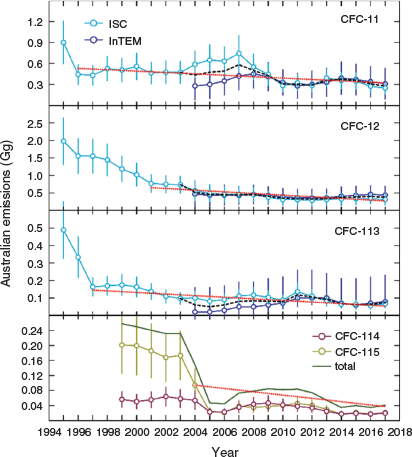
Australian CFC-11, CFC-12, CFC-113, ∑CFC-114 and CFC-115 emissions from ISC calculations and InTEM inversions of Cape Grim data (1995–2017) are shown in Fig. 16.
|
CFC-11 emissions declined significantly by 50 %, from 0.90 Gg to 0.45 Gg, between 1995 and 1996. A linear fit to the combined ISC (1997–2017) and ISC-InTEM (2004–2017) CFC-11 data show emissions declining by 10 ± 2 tonnes per year. From 2005 to 2017, ISC and InTEM emissions agree reasonably well for CFC-11, within 25 %, ISC higher with overlapping uncertainties at the 1σ level. After 2007, the ISC-InTEM CFC-11 agreement is within 1 %. There is no obvious reason why the ISC-InTEM differences change around 2007–2008. Since 2010, ISC-InTEM CFC-11 annual emissions have been approximately constant at 0.32 ± 0.04 Gg (320 ± 40 tonnes).
CFC-12 emissions declined significantly from 2.0 Gg in 1995 to 0.4 Gg in 2017. A linear fit to the CFC-12 data (2001–2017) shows emissions declining by 24 ± 4 tonnes per year. Since 2004, the ISC and InTEM emissions agree to within 20 %, ISC lower with overlapping uncertainties. After 2008, the ISC CFC-12 emissions are consistently lower by 30 % than InTEM CFC-12 emissions. Since 2010, ISC-InTEM CFC-12 annual emissions have been approximately constant at 0.36 ± 0.03 Gg (360 ± 30 tonnes).
CFC-113 emissions declined significantly by ~65 %, 0.49 ± 0.16 Gg to 0.16 ± 0.05 Gg, between 1995 and 1997. From 1997 to 2017, CFC-113 emissions declined approximately linearly at 4.5 ± 1.0 tonnes per year. Prior to 2010, the ISC CFC-113 emissions are consistently higher, by a factor of 2, than InTEM CFC-113 emissions; after 2009, the ISC-InTEM CFC-113 emissions agree to within 8 %, ISC higher. Since 2010, ISC-InTEM CFC-113 annual emissions have been approximately constant at 0.080 ± 0.020 Gg (80 ± 20 tonnes).
∑CFC-114+CFC-115 emissions averaged 240 ± 10 tonnes (1999–2003), falling rapidly by 65–70 % to 80 ± 5 tonnes for 2007–2012, falling another 45–50 % to 37 ± 3 tonnes for 2014–2017. ∑CFC-114+CFC-115 emissions declined by 4.3 ± 1.7 ppt per year over the period 2004–2017. Australian CFC-114 and CFC-115 emissions in 2017 were both ~20 ± 7 tonnes.
Australian CFC emissions 1960–2017
Australian CFC emissions have been derived from atmospheric observations at Cape Grim using ISC, 1994–2017, and InTEM, 2004–2017, methodologies. ISC emissions based on atmospheric data before 1994 are not available because reliable in situ Cape Grim CO measurements only commenced in 1994. Currently, InTEM-based emissions are not available before 2004 because the 3-D meteorology fields that drive the NAME model for the SE Australian domain are not available before 2004.
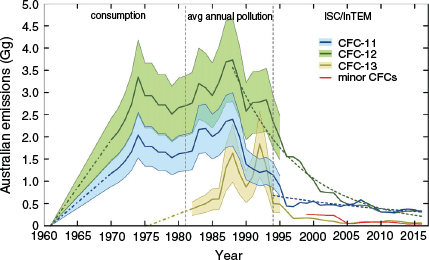
To estimate CFC emissions back to 1982, the earliest year reliable CFC pollution data are available from Cape Grim, it is assumed that annual CFC emissions are proportional to the annual average magnitude of CFC pollution events (Fig. 8). Prior to 1982, it is assumed that Australian CFC emissions are proportional to Australian CFC consumption (Fig. 2). This assumption is likely valid pre-1980 when 50–75 % of Australian CFC consumption was in aerosol products, for which annual consumption approximately equals annual emissions, but less valid by 1985 when less than 10 % of Australian CFC consumption was for aerosol products (AEC/NHMRC 1983). Unfortunately, CFC consumption data are all that are available to estimate Australian CFC emissions pre-1983. Correlations of annual average pollution data with ISC-InTEM estimates of emissions indicate uncertainties of ±25 % (1σ) for CFC-11 and CFC-12 and ±40 % (1σ) for CFC-113 emissions estimated from annual average pollution data. The uncertainties shown for CFC-11 and CFC-12 emissions estimated from consumption data are the estimated uncertainties in production data above (±25 %, 1σ). Australian CFC-11, CFC-12, CFC-113 and minor CFC (ΣCFC-114+CFC-115) emissions are shown in Fig. 14.
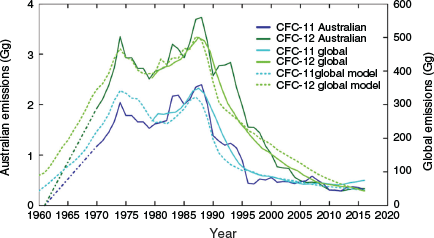
Peaks in Australian CFC-11 and CFC-12 emissions likely occurred in 1974 (2.0 ± 0.5 Gg, 3.3 ± 0.8 Gg, 1σ), based on consumption data, and 1988 (2.4 ± 0.6 Gg, 3.7 ± 0.9 Gg, 1σ), based on atmospheric observations. From 1988 to 2017, Australian CFC-11 emissions fell by 90 % (2.4 Gg to 0.27 Gg, 4 % per year since 1994) and CFC-12 emissions by 95 % (3.3 Gg to 0.20 Gg, 10 % per year since 1988).
These differences in the rates of decline of CFC-11 and CFC-12 emissions likely reflect their original applications. CFC-11 and CFC-12 were used in aerosol products; this use was phased-out early and rapidly with a typical emission rate of over 60 % per year. CFC-11 was also used in closed-cell foam plastics accounting for 20 % of CFC use, which was phased-out later than the aerosol use and has left a significant residual bank in foams leaking slowly (2–6 % per year, Ashford et al. 2006) to the atmosphere. CFC-12 was largely used in refrigeration and air conditioning, accounting for 30 % of CFC use, leaving a residual bank of CFC-12, larger than the CFC-11 bank, leaking to the atmosphere at a significantly faster rate than CFC-11, owing to refrigeration and air conditioning leak rates of 5–20 % per year and 7–8 % per year respectively. These leak rates are for hydrofluorocarbon (HFC)-based refrigeration and air conditioning and assumed to be similar to the earlier CFC emissions for the same applications (DoEE 2019). This represents an unknown uncertainty in estimating ‘bottom-up’ emissions of CFCs.
Current (2010–2017) Australian annual emissions based on ISC-InTEM calculations are 320 ± 40 tonnes for CFC-11 and 360 ± 30 tonnes for CFC-12. At current rates of decline (Fig. 16), CFC-11 and CFC-12 emissions will fall below 20 tonnes per year in ~20–30 years.
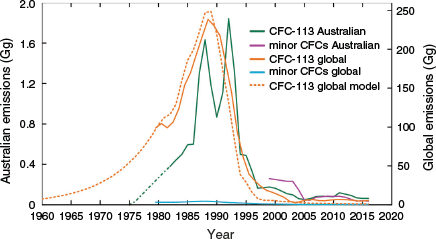
Australian CFC-113 emissions peaked in 1988 (1.6 ± 0.6 Gg) and again in 1992 (1.8 ± 0.7 Gg) declining to just below 100 tonnes in 2003. Since 2003, Australian CFC-113 emissions have remained approximately constant at ~80 ± 20 tonnes per year to 2017. To maintain these CFC-113 emissions, there must be a significant CFC-113 bank. The early (short lifetime, <1 year) emissions of CFC-113 are from use as a solvent and in aerosol products; the later (long lifetime emissions, up to 12 years) are from closed cell foams and refrigeration equipment (AFEAS 1997). Presumably, these residual CFC-113 emissions are from an ‘above ground’ bank of closed cell foams, refrigeration equipment, stockpiled solvents and solvent wastes, all potentially containing CFC-113. At current rates of decline, CFC-113 emissions are anticipated to fall below 20 tonnes per year in ~10 years and ΣCFC-114+CFC-115 emissions within 5 years.
Australian emissions of CFC-11 and CFC-12 show similar growth and decline trajectories compared with global emissions, except for the very recent increase in global emissions of CFC-11 (Fig. 17). Total Australian emissions of CFC-11 and CFC-12 since 1978 (106 Gg) are 0.7 % of global emissions (15.3 Tg) based on atmospheric observations. Total Australian CFC-11 emissions (1960–2017) are 57 Gg and 95 Gg for CFC-12, a total of 152 Gg for CFC-11+CFC-12, 0.6 % of global emissions (Lickley et al. 2020) based on a ‘bottom-up’ for CFC emissions from production and ‘bank’ data.
|
Global CFC-113 emissions (Fig. 18) peaked at just under 250 Gg in the late-1980s, declining rapidly to under 10 Gg by the early-2000s. Total Australian CFC-113 emissions since 1978 (16.2 Gg) are 0.6 % of global emissions (2.8 Tg) based on atmospheric observations over the same period.
|
Since 1999, total Australian minor CFC (ΣCFC-114+CFC-115) emissions have been 2.2 Gg, 1 % of global emissions (210 Gg) based on atmospheric observations over the same period. The residual minor CFC emissions (2017: ΣCFC-114, CFC-115, both 20 tonnes) are presumably from their uses with long-lifetime emissions – refrigerants, closed cell foams and dielectric fluids (AFEAS 1997).
Australian CFC-11 and CFC-12 ‘banks’
Observed trends in atmospheric abundances and past production estimates of CFCs have been used to gain ‘top down’ insights into CFC bank sizes and their roles as global emission sources for the CFCs. Estimates of global ‘banks’ of CFC-11 and CFC-12 have been made by comparing total production/consumption data and total emissions from atmospheric observations (Daniel et al. 2007; Lickley et al. 2020). Similarly, we compare estimates of total CFC consumption and emissions in Australia since the early 1960s to the present to gauge the potential magnitudes of Australian CFC ‘banks’. These ‘banks’ consist of operational or discarded refrigeration equipment, aerosol products and foams that have not been consigned to landfill, as well as CFCs from the breakdown of the CFC-containing products previously consigned to landfill.
CFC emissions from landfills have been measured at three landfill sites in Italy (Maione et al. 2005), seven landfill sites in the USA, nine landfill sites in the UK (Hodson et al. 2010), and from one site in Australia (Allison et al. 2009). The measured CFC emissions at the USA, UK and Australian sites have been used to estimate national CFC emissions from landfills. Landfill emissions were found to be less than 1 % of national CFC-11 and CFC-12 emissions in the USA, less than 1 % of UK emissions for CFC-11 and 6 % for CFC-12 and less than 2 % of Australian CFC emissions, the latter being quite uncertain as it is based on emissions measured at only one landfill site. The average CFC-11 and CFC-12 fluxes from the Italian landfill sites were very low at 0.15–0.45 and 0.9–1.4 kg per year respectively. Hodson et al. (2010) conclude that the majority of current CFC emissions in developed countries are likely coming from refrigeration equipment, foams and aerosols still in use or discarded, but not sent to landfill.
Emissions of CFCs from modern landfills are low because of robust containment technology and because CFCs in landfills are substantially biodegraded, in particular CFC-11. Landfill soil columns have shown significant capacity to destroy CFCs (CFC-11: 90 %, CFC-12: 30 %, Scheutz and Kjeldsen 2003). In anaerobic landfill environments, more than 99 % of CFC-11 is degraded within 15–20 days by reductive de-chlorination, producing HCFC-21 (CHCl2F) and HCFC-31 (CH2ClF). CFC-11 degradation rates in landfills are 15 times CFC-12 degradation rates, 30 times HCFC-22 (CHClF2) rates, and HFC-134a (CH2FCF3) shows no evidence of biodegradation. The degradation rate coefficient directly correlates with the number of chlorine atoms attached to a single carbon atom (CFC-11: 3, CFC-12: 2, HCFC-22: 1 and HFC-134a: 0; Scheutz et al. 2007). The small amount of CFC emissions from landfills occur when the landfill waste is buried under an interim cover, before the final, impervious cover is in place (1 Australian site, Allison et al. 2009; 1 USA and 3 European sites, Yesiller et al. 2018). The faster biodegradation of CFC-11 compared with CFC-12 is one of the reasons that, in general, landfill gases contain more CFC-12 than CFC-11 (CFC-12/CFC-11 = 2: USA, 6: UK and 50: Australia), whereas the initial fluxes (before final cover) from the Australian site, which presumably reflect the CFC composition of the initial landfill gas, were 5 times higher for CFC-11 compared with CFC-12. Allison et al. (2009) found that when landfill gas is used to fuel a modified diesel engine, to generate electricity at the landfill site, then 99 % of CFC-11 and 98 % of CFC-12 in the fuel (landfill gas) are destroyed in the internal combustion diesel engine.
In summary, the legacy CFC-11 and CFC-12 emissions in developed countries originate from CFC banks that are ‘above ground’ – landfills make a likely very minor contribution to the CFC-11 and CFC-12 emissions. The current Australian ‘banks’ (cumulative consumption minus cumulative emissions) of CFC-11 and CFC-12 are 95 ± 25 Gg and 80 ± 30 Gg respectively, distributed in an unspecified manner between above ground and landfill ‘banks’.
Assuming that landfills make a negligible contribution to CFC emissions and that ‘above ground’ CFC-11 is largely in foams and ‘above ground’ CFC-12 is largely in refrigeration and air conditioning equipment, then the CFC-11 leak rate and emissions from foams (2–6 % per year, 0.32 Gg per year) implies a current above ground CFC-11 bank of 5–16 Gg and the CFC-12 leak rate and emissions from refrigeration and air conditioning equipment (5–20 % per year, 0.36 Gg per year) implies an above ground CFC-12 bank of 2–7 Gg. For CFC-113 leaking from the above ground bank at 80 ± 20 tonnes per year and the above ground bank is largely foams, then the CFC-113 bank is 0.4 Gg, and, if largely in refrigeration equipment, the CFC-113 bank is ~0.5–2 Gg.
Conversely, determining how much of Australian CFC consumption ended up in landfills is the key to estimating Australian CFC emission factors for the legacy Australian CFC banks. This represents a significant challenge – perhaps international data on the distribution of CFC banks between above ground and landfills at the national level exist. If so, it could suggest the likely magnitudes of Australian legacy bank CFC emission factors.
Climate change impact of Australian CFC emissions
Although CFCs are very potent greenhouse gases (e.g. 1 tonne of CFC-11 emitted has a 100-year integrated climate change impact of 5000 tonnes of CO2 emissions), CFCs are not included in the suite of greenhouse gas emissions reported annually by signatory nations to the United Nations Framework Convention on Climate Change (UNFCCC), under the Kyoto Protocol (1997) and the Paris Agreement (2016). This is because CFC production and consumption (and therefore indirectly emissions) are regulated under an earlier agreement, the Montreal Protocol (1987), designed to protect the stratospheric ozone layer. Nevertheless, it is important to consider the climate change impacts of reducing CFC emissions, nationally and globally.
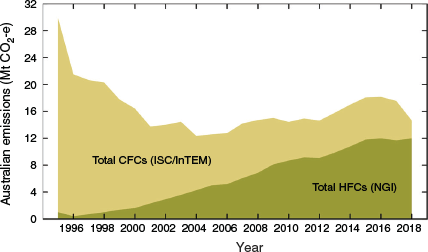
Since 1995, Australian CFC emissions (CFC-11, CFC-12, CFC-113) have fallen (Fig. 16) from 3.4 Gg (29 M tonnes CO2-e, 6–7 % of Australia’s GHG emissions) to 0.65 Gg (3.5 M tonnes CO2-e, 0.5 % of Australia’s emissions) in 2017 (80 % decline), a fall of 25 M tonnes of CO2-e. The CO2-e emissions resulting from Australian CFC emissions are calculated using GWPs from the IPCC Fourth Assessment Report (Myhre and Shindell 2014). This decline in CFC emissions is larger than any GHG decline in the Australian GHG Inventory over this period where Australia’s CO2 emissions have increased by 112 M tonnes (35 %), methane (CH4) emissions have fallen by 7 M tonnes CO2-e (6 %), nitrous oxide (N2O) emissions have risen by 6 M tonnes CO2-e (40 %) and HFC emissions have risen by 11 M tonnes CO2-e (factor of 12 increase).
Since 2000, the fall in Australian CFC emissions has approximately matched the rise in emissions of their replacement gases, the HFCs (Fig. 19). The goal of the Montreal Protocol was to significantly reduce the consumption (and therefore the emissions) of the CFCs and the spirit of the Montreal Protocol was to ensure that the climate impact of the CFC replacement chemicals (e.g. the HFCs or other replacement chemicals) were to be less than or no greater than the CFCs they replaced. This appears to be the situation in Australia, with the combined climate change impact of CFC and HFC emissions being approximately constant at 15 ± 2 M tonnes of CO2-e per year (2–3 % of Australia’s annual GHG emissions) from 2000 to the present. This combined climate change impact will likely decline in the future with further reductions in CFC emissions and a continuation of the already observed slowing of the growth in emissions of HFCs in the Australian GHG Inventory.
|
Conclusions
Australian production of CFC-11 and CFC-12 commenced in the early 1960s. Import data for CFC-11, CFC-12 and CFC-113 are available from 1990; imports ceased by 2000. CFC-11, CFC-12 and CFC-113 production plus imports totalled 345 Gg for the period from the early 1960s to 2000. CFC exports totalled 15 Gg, resulting in CFC consumption of 330 Gg over this period.
Significant Australian emissions of CFCs (CFC-11, CFC-12, CFC-113) commenced in the early 1960s, reaching a peak of 7800 tonnes per year in the late-1980s. Since the late-1980s, Australian CFC emissions have declined by more than 90 % to ~0.7–0.8 Gg per year (2016–2017) thanks to Australia’s early and effective control of production, imports and consumption of CFCs in accord with obligations under the Montreal Protocol. Current (2010–2017) Australian CFC emissions (tonnes per year) are 320 ± 40 (CFC-11), 360 ± 30 (CFC-12), 80 ± 20 (CFC-113) and 20 ± 7 (ΣCFC-114 and CFC-115). CFC-11, CFC-12 and CFC-113 emissions totalled 170 Gg from the early 1960s to 2017.
The temporal pattern of Australian CFC emissions is similar to that observed in global emissions, with Australian emissions being <1 % of global emissions over the entire emission history. Substantial reductions in Australian emissions of CFC-11 occurred before 1995, as they did globally. Since 1995, there has been only a slow decline in Australian CFC-11 emissions, whereas CFC-12 emissions continue to show a steady decline since the late-1980s and CFC-113 emissions have remained low but approximately constant for the last decade.
These differences in the rates of decline of CFC emissions likely reflect their original usage patterns: CFC-11 was used in aerosol products (phased-out early and rapidly) and in foam plastics (phased-out later), but with a residual bank in closed-cell foams leaking slowly (2–6 % per year) to the atmosphere. CFC-12 was largely used in refrigeration and air conditioning, creating a large bank of CFC-12, leaking to the atmosphere at 5–20 % per year. CFC-113 was used as a solvent and in foams and refrigeration, with foams uses likely the source of the current CFC-113 bank. The rates of release of CFC-11, CFC-12 and CFC-113 (% per year) from their respective banks and the current emission rates (tonnes per year) enables estimation of the current Australian CFC banks, CFC-11: 5–16 Gg, CFC-12: 2–7 Gg and CFC-113: 0.5–2 Gg.
Since 1995, Australian CFC emissions (CFC-11, CFC-12, CFC-113) have declined by 25 M tonnes of CO2-e. This CFC-driven decline in CO2-e emissions is larger than any GHG decline in the Australian GHG Inventory since 1995, but it is not a component of Australia’s GHG emissions reported to the UNFCCC.
Australia has achieved significant reductions in emissions of CFCs in line with its obligations under the Montreal Protocol, thus making a small contribution to the global efforts to reduce emissions of these potent ozone depleting and global warming trace gases. Unlike recent developments in east Asia, there is no evidence of renewed, illegal consumption of CFCs in Australia.
Conflicts of interest
The authors declare no conflicts of interest.
Acknowledgements
The authors acknowledge staff from the Bureau of Meteorology (Cape Grim, Tasmania), from CSIRO Oceans and Atmosphere (Aspendale, Victoria), from the Scripps Institution for Oceanography (La Jolla, California, USA) and from the University of Bristol (Bristol, UK) for instrument maintenance and operation, data calibration and quality assessment, within the AGAGE program. The authors acknowledge research funds and in-kind support for the Cape Grim and Aspendale laboratories since 1975 from CSIRO, Bureau of Meteorology, the Department of Agriculture, Water and the Environment (DAWE) and precursor Departments, Refrigerant Reclaim Australia (RRA), Professor J. E. Lovelock (Fellow of the Royal Society, UK), AGAGE and Professor R. G. Prinn, Massachusetts Institute of Technology, Cambridge, Massachusetts; inverse modelling was funded by the UK Met Office, Exeter, UK. The authors thank R. Gillett (CSIRO), A. Gabriel (DAWE) and the journal referees for substantial improvements to this paper.
References
AEC/NHMRC (1983). ‘Environment, Health and Economic Implications of the Use of Chlorofluorocarbons as Aerosol Propellants and Possible Substitutes’, Australian Environment Council/National Health and Medical Research Council, Canberra, ACT, Australia, 41 pp.AFEAS (1997). ‘Production, Sales and Atmospheric Release of Fluorocarbons Through 1995’, Alternative Fluorocarbons Environmental Acceptability Study, Washington DC, USA, January 1997.
Allison C, Coram S, Derek N, Fraser P (2009). ‘Greenhouse Gas Emissions from the Rye Landfill, Mornington Peninsula, Victoria’, Report prepared by CSIRO Marine and Atmospheric Research for the Australian Government Department of the Environment, Water, Heritage and the Arts, 44 pp.
Arnold T, Mühle J, Salameh PK, Harth CM, Ivy DJ, Weiss RF (2012). Automated measurement of nitrogen trifluoride in ambient air. Analytical Chemistry 84, 4798–4804.
| Automated measurement of nitrogen trifluoride in ambient airCrossref | GoogleScholarGoogle Scholar | 22607353PubMed |
Arnold T, Manning AJ, Kim J, Li S, Webster H, Thomson D, Mühle J, Weiss RF, Park S, O’Doherty S (2018). Inverse modelling of CF4 and NF3 emissions in East Asia. Atmospheric Chemistry and Physics 18, 13305–13320.
| Inverse modelling of CF4 and NF3 emissions in East AsiaCrossref | GoogleScholarGoogle Scholar |
Ashford P, Baker JA, Clodic D, Devotta S, Godwin D, Harnisch J, Irving W, Jeffs M, Kuijpers L, McCulloch A, De Aguiar Peixoto R, Uemura S, Verdonik DP (2006). 2006 IPCC Guidelines for National Greenhouse Gas Inventories, Chapter 7, Emissions of Fluorinated Substitutes for Ozone Depleting Substances, pp. 7.1–7.71.
Campbell N, Shende R (2005). HFCs and PFCs: Current and Future Supply, Demand and Emissions, plus Emissions of CFCs, HCFCs and Halons, Chapter 11, Safeguarding the Ozone Layer and the Global Climate System, 403–435 (IPCC TEAP, Cambridge University Press: Cambridge, NY)
Carpenter LJ, Daniel JS (2018). Scenarios and Information for Policymakers, Chapter 6, Scientific Assessment of Ozone Depletion: 2018, Global Ozone Research and Monitoring Project – Report No. 58, pp. 6.1–6.69 (World Meteorological Organization: Geneva, Switzerland)
Carpenter L, Reimann S (2014). Update on Ozone-Depleting Substances (ODSs) and Other Gases of Interest to the Montreal Protocol, Chapter 1, Scientific Assessment of Ozone Depletion: 2014, Global Ozone Research and Monitoring Project – Report No. 55, pp. 1.1–1.101 (World Meteorological Organization: Geneva, Switzerland)
Cunnold DM, Prinn RG, Rasmussen RA, Simmonds PG, Alyea FN, Cardelino CA, Crawford AJ, Fraser PJ, Rosen RD (1983). The Atmospheric Lifetime Experiment, 2: Lifetime methodology and application to three years of CFCl3 data. Journal of Geophysical Research 88, 8379–8400.
| The Atmospheric Lifetime Experiment, 2: Lifetime methodology and application to three years of CFCl3 dataCrossref | GoogleScholarGoogle Scholar |
Cunnold DM, Weiss RF, Prinn RG, Hartley DE, Simmonds PG, Fraser PJ, Miller BR, Alyea FN, Porter LW (1997). GAGE/AGAGE measurements indicating reductions in global emissions of CCl3F and CCl2F2 in 1992–1994. Journal of Geophysical Research 102, 1259–1269.
| GAGE/AGAGE measurements indicating reductions in global emissions of CCl3F and CCl2F2 in 1992–1994Crossref | GoogleScholarGoogle Scholar |
Cyranoski D (2019). China feels the heat over rogue CFC emissions. Nature 571, 309–310.
| China feels the heat over rogue CFC emissionsCrossref | GoogleScholarGoogle Scholar | 31312058PubMed |
Daniel JS, Velders GJM, Solomon S, McFarland M, Montzka SA (2007). Present and future sources and emissions of halocarbons: toward new constraints. Journal of Geophysical Research 112, D02301
| Present and future sources and emissions of halocarbons: toward new constraintsCrossref | GoogleScholarGoogle Scholar |
Delaney W, Marshall A (2011). Victorian air emissions inventory for 2006. In ‘Proceedings: 20th International Clean Air and Environment Conference’, 31 July – 2 August 2011, pp. 1–7 (Clean Air Society of Australia and New Zealand: Auckland, New Zealand)
Department of Environment and Energy (DoEE) (2018). Ozone Protection and Synthetic Greenhouse Gas Management Legislation. Available at http://www.environment.gov.au/protection/ozone/legislation [verified September 2018]
Department of Environment and Energy (DoEE) (2019). Australian Government Department of Environment and Energy. Available at https://www.industry.gov.au/data-and-publications/national-inventory-reports [verified September 2020]
Department of Environment, Housing and Community Development (DEHCD) (1976). Personal communication with CSIRO (G. E. Cook, 26 November 1976)
Draxler R, Hess D (1997). Description of the HYSPLIT_4 Modeling 389 System. NOAA Technical Memorandum ERL ARL-224, NOAA, 24 pp.
Dunse BL (2002). Investigation of urban emissions of trace gases by use of atmospheric measurements and a high-resolution atmospheric transport model. PhD thesis, University of Wollongong, Wollongong NSW, 303 pp.
Dunse BL, Steele LP, Fraser PJ, Wilson SR (2001). An analysis of Melbourne pollution episodes observed at Cape Grim from 1995–1998. In ‘Baseline Atmospheric Program Australia 1997–1998’. (Eds N Tindale et al.) pp. 34–42. (Bureau of Meteorology and CSIRO Atmospheric Research: Melbourne)
Dunse BL, Steele LP, Wilson SR, Fraser PJ, Krummel PB (2005). Trace gas emissions from Melbourne Australia, based on AGAGE observations at Cape Grim, Tasmania, 1995–2000. Atmospheric Environment 39, 6334–6344.
| Trace gas emissions from Melbourne Australia, based on AGAGE observations at Cape Grim, Tasmania, 1995–2000Crossref | GoogleScholarGoogle Scholar |
Dunse BL, Derek N, Fraser PJ, Krummel PB, Steele LP (2019). ‘Australian and Global Emissions of Ozone Depleting Substances’, Report prepared for the Australian Government Department of the Environment and Energy, CSIRO Oceans and Atmosphere, Climate Science Centre, Aspendale, Australia, iv, 37 pp. Available at https://www.environment.gov.au/protection/ozone/publications/csiro-report-australian-global-emissions-ods-2019 [verified 1 September 2020]
Engel A, Rigby M (2018). Update on Ozone-Depleting Substances (ODSs) and other Gases of Interest to the Montreal Protocol, Chapter 1, Scientific Assessment of Ozone Depletion: 2018, Global Ozone Research and Monitoring Project – Report No. 58, pp. 1.1–1.87. (World Meteorological Organization: Geneva, Switzerland)
Environment Australia (2001). ‘Australian Chlorofluorocarbon Management Strategy.’ (Department of the Environment and Heritage: Canberra)
Environment Protection Authority (EPA) (1998). ‘Air Emissions Inventory: Port Phillip Region’, EPA Publication 632 (EPA Victoria: Melbourne)
Fisher DA, Midgley PM (1994). Uncertainties in the calculation of atmospheric releases of chlorofluorocarbons. Journal of Geophysical Research 99, 16643–16650.
| Uncertainties in the calculation of atmospheric releases of chlorofluorocarbonsCrossref | GoogleScholarGoogle Scholar |
Francey RJ, Steele LP, Langenfelds RL, Lucarelli MP, Allison CE, Beardsmore DJ, Coram SA, Derek N, De Silva FR, Etheridge DM, Fraser PJ, Henry RJ, Turner B, Welch ED, Spencer DA, Cooper LN (1996). Global Atmospheric Sampling Laboratory (GASLAB): supporting and extending the Cape Grim trace gas programs. In ‘Baseline Atmospheric Program Australia 1993’. (Eds RJ Francey et al.) pp. 8–29. (Bureau of Meteorology and CSIRO Division of Atmospheric Research: Melbourne)
Fraser PJB, Pearman GI (1978). Atmospheric halocarbons in the southern hemisphere. Atmospheric Environment 12, 839–844.
| Atmospheric halocarbons in the southern hemisphereCrossref | GoogleScholarGoogle Scholar |
Fraser PJ, Sawford BL, Manins PC (1977). CCl3F (Freon-11) as an indicator of transport processes in an urban atmosphere: a case study in Melbourne. Atmospheric Environment 11, 1025–1028.
| CCl3F (Freon-11) as an indicator of transport processes in an urban atmosphere: a case study in MelbourneCrossref | GoogleScholarGoogle Scholar |
Fraser PJ, Cunnold DM, Alyea FN, Weiss RF, Prinn RG, Simmonds PG, Miller BR, Langenfelds RL (1996). Lifetime and emission estimates of 1,1,2-trichlorotrifluorethane (CFC-113) from daily global background observations June 1982-June 1994. Journal of Geophysical Research 101, 12585–12599.
| Lifetime and emission estimates of 1,1,2-trichlorotrifluorethane (CFC-113) from daily global background observations June 1982-June 1994Crossref | GoogleScholarGoogle Scholar |
Fraser PJ, Steele LP, Derek N, Porter LW, Krummel PB (2001). Halocarbons, nitrous oxide, methane, carbon monoxide and hydrogen – the AGAGE program, 1993–1998. In ‘Baseline Atmospheric Program Australia 1997–98’. (Eds NE Tindale et al.) pp. 90–97. (Bureau of Meteorology and CSIRO Division of Atmospheric Research: Melbourne)
Fraser P, Dunse B, Manning A, Wang R, Krummel P, Steele P, Porter L, Allison C, O’Doherty S, Simmonds P, Mühle J, Prinn R (2014). Australian carbon tetrachloride (CCl4) emissions in a global context. Environmental Chemistry 11, 77–88.
| Australian carbon tetrachloride (CCl4) emissions in a global contextCrossref | GoogleScholarGoogle Scholar |
Fraser PJ, Steele LP, Pearman GI, Coram S, Derek N, Langenfelds RL, Krummel PB (2016). Non-carbon dioxide greenhouse gases at Cape Grim: a 40-year odyssey. In ‘Baseline Atmospheric Program (Australia) History and Recollections, 40th Anniversary Special Edition’. (Eds N Derek et al.) pp. 45–76. (Bureau of Meteorology/CSIRO Oceans and Atmosphere: Melbourne)
Fraser PJ, Pearman GI, Derek N (2018). CSIRO non-carbon dioxide greenhouse gas research. Part 1: 1975–1990. Historical Records of Australian Science 29, 1–13.
| CSIRO non-carbon dioxide greenhouse gas research. Part 1: 1975–1990Crossref | GoogleScholarGoogle Scholar |
Harris NRP, Montzka SA, Newman PA (2019). Report on the International Symposium on the Unexpected Increase in emissions of ozone-depleting CFC-11. SPARC Newsletter No. 3, 9–18. (World Climate Research Programme)
Hodson EL, Martin D, Prinn RG (2010). The municipal solid waste landfill as a source of ozone-depleting substances in the United States and United Kingdom. Atmospheric Chemistry and Physics 10, 1899–1910.
| The municipal solid waste landfill as a source of ozone-depleting substances in the United States and United KingdomCrossref | GoogleScholarGoogle Scholar |
Jones AR, Thomson DJ, Hort M, Devenish B (2007). The UK Met Office’s next-generation atmospheric dispersion model, NAME III. In ‘Air Pollution Modelling and its Application XVII’. (Eds C Borrego, A-L Norman) pp. 580–589. (Springer: Boston, MA)
Krummel PB, Fraser PJ, Porter LW, Steele LP, Rickard C, Dunse BL, Derek N (2006). HCFCs, HFCs, PFCs, halons, CFCs, chlorocarbons, hydrocarbons and sulfur hexafluoride: the AGAGE in situ GC-MS-Medusa program at Cape Grim, 2004. In ‘Baseline Atmospheric Program Australia 2003–2004. (Eds JM Cainey et al.) pp. 73–77. (Bureau of Meteorology and CSIRO Marine and Atmospheric Research: Melbourne)
Langenfelds RL, Fraser PJ, Francey RJ, Steele LP, Porter LW, Allison CE (1996). The Cape Grim Air Archive: the first seventeen years, 1978–1995. In ‘Baseline Atmospheric Program Australia 1994–1995’. (Eds RJ Francey et al.) pp. 53–70. (Bureau of Meteorology and CSIRO Division of Atmospheric Research: Melbourne)
Laube J, Hanif N, Martinerie P, Gallacher E, Fraser PJ, Langenfelds RL, Brenninkmeijer C, Schwander J, Witrant E, Wang J-L, Ou-Yang C-F, Gooch L, Reeves C, Sturges W, Oram D (2016). Tropospheric observations of CFC-114 and CFC-114a with a focus on long-term trends and emissions. Atmospheric Chemistry and Physics 16, 15347–15358.
| Tropospheric observations of CFC-114 and CFC-114a with a focus on long-term trends and emissionsCrossref | GoogleScholarGoogle Scholar |
Lickley M, Solomon S, Fletcher S, Velders GJM, Daniel J, Rigby M, Montzka SA, Kuijpers LJM, Stone K (2020). Quantifying contributions of chlorofluorocarbon banks to emissions and impacts on the ozone layer and climate. Nature Communications 11, 1380
| Quantifying contributions of chlorofluorocarbon banks to emissions and impacts on the ozone layer and climateCrossref | GoogleScholarGoogle Scholar | 32184388PubMed |
Lin Y, Gong D, Lv S, Ding Y, Wu G, Wang H, Li Y, Wang Y, Zhou L, Wang B (2019). Observations of high levels of ozone-depleting CFC-11 at a remote mountain-top site in southern China. Environmental Science & Technology Letters 6, 114–118.
| Observations of high levels of ozone-depleting CFC-11 at a remote mountain-top site in southern ChinaCrossref | GoogleScholarGoogle Scholar |
Maione M, Arduini J, Rinaldi M, Mangani F, Capaccioni B (2005). Emission of non-CO2 greenhouse gases from landfills of different ages located in central Italy. Environmental Sciences 2, 167–176.
| Emission of non-CO2 greenhouse gases from landfills of different ages located in central ItalyCrossref | GoogleScholarGoogle Scholar |
Manning AJ, Ryall DB, Derwent RG, Simmonds PG, O’Doherty S (2003). Estimation European emissions of ozone depleting and greenhouse gases using observations and a modelling back attribution technique. Journal of Geophysical Research 108, 4405
| Estimation European emissions of ozone depleting and greenhouse gases using observations and a modelling back attribution techniqueCrossref | GoogleScholarGoogle Scholar |
Manning AJ, O’Doherty S, Jones AR, Simmonds PG, Derwent RG (2011). Estimating UK methane and nitrous oxide emissions from 1990 to 2007. Journal of Geophysical Research 116, D02305
| Estimating UK methane and nitrous oxide emissions from 1990 to 2007Crossref | GoogleScholarGoogle Scholar |
Manning AJ, Stanley K, Redington A, O’Doherty S, Young D (2018). Methodology Report – Verification of Emissions using Atmospheric Observations, prepared for the Department for Business, Energy and Industrial Strategy (UK) by the Met. Office and U. Bristol, 38 pp.
Miller BR, Weiss RF, Salameh PK, Tanhua T, Greally BR, Mühle J, Simmonds P (2008). Medusa: a sample preconcentration and GC-MSD system for in situ measurements of atmospheric trace halocarbons, hydrocarbons and sulfur compounds. Analytical Chemistry 80, 1536–1545.
| Medusa: a sample preconcentration and GC-MSD system for in situ measurements of atmospheric trace halocarbons, hydrocarbons and sulfur compoundsCrossref | GoogleScholarGoogle Scholar | 18232668PubMed |
Molina MJ, Rowland FS (1974). Stratospheric sink for chlorofluoromethanes: chlorine atom-catalysed destruction of ozone. Nature 249, 810–812.
| Stratospheric sink for chlorofluoromethanes: chlorine atom-catalysed destruction of ozoneCrossref | GoogleScholarGoogle Scholar |
Montzka SA, Dutton GS, Yu P, Ray E, Portmann RW, Daniel JS, Kuijpers L, Hall BD, Mondeel D, Siso C, Nance JD, Rigby M, Manning AJ, Moore F, Miller BR, Elkins JW (2018). An unexpected and persistent increase in global emissions of ozone-depletion CFC-11. Nature 557, 413–417.
| An unexpected and persistent increase in global emissions of ozone-depletion CFC-11Crossref | GoogleScholarGoogle Scholar | 29769666PubMed |
Myhre G, Shindell D (2014). Anthropogenic and natural radiative forcing. In ‘Climate Change 2013 – The Physical Science Basis: Working Group I Contribution to the Fifth Assessment Report of the Intergovernmental Panel on Climate Change’. (Eds TF Stocker et al.) Chapter 8, pp. 659–740. (Cambridge University Press: Cambridge)
Nature (2020). Countries must take action on ‘hidden’ CFC stocks. Editorial, 26 March 2020. Nature 579, 472.
Novelli PC, Elkins JW, Steele LP (1991). The development and evaluation of a gravimetric reference scale for measurements of atmospheric carbon monoxide. Journal of Geophysical Research 96, 13109–13121.
| The development and evaluation of a gravimetric reference scale for measurements of atmospheric carbon monoxideCrossref | GoogleScholarGoogle Scholar |
O’Doherty S, Simmonds PG, Cunnold DM, Wang HJ, Sturrock GA, Fraser PJ, Ryall D, Derwent RG, Weiss RF, Salameh P, Miller BR, Prinn RG (2001). In situ chloroform measurements at Advanced Global Atmospheric Gases Experiment atmospheric research stations from 1994 to 1998. Journal of Geophysical Research 106, 20429–20444.
| In situ chloroform measurements at Advanced Global Atmospheric Gases Experiment atmospheric research stations from 1994 to 1998Crossref | GoogleScholarGoogle Scholar |
Oram DE (1999). Trends in long‐lived anthropogenic halocarbons in the Southern Hemisphere and model calculations of global emissions. PhD thesis, University of East Anglia, Norwich, UK.
Prinn RG, Weiss RF, Fraser PJ, Simmonds PG, Cunnold DM, Alyea FN, O’Doherty S, Salameh P, Miller BR, Huang J, Wang RHJ, Hartley DE, Harth C, Steele LP, Sturrock GA, Midgley PM, McCulloch A (2000). A history of chemically and radiatively important gases in air deduced from ALE/GAGE/AGAGE. Journal of Geophysical Research 105, 17751–17792.
| A history of chemically and radiatively important gases in air deduced from ALE/GAGE/AGAGECrossref | GoogleScholarGoogle Scholar |
Prinn RG, Weiss RF, Arnold T, Arduini J, DeWitt L, Fraser PJ, Ganesan A, Harth C, Hermansen O, Kim J, Krummel PB, Loh ZM, Lunder CR, Maione M, Manning AJ, Miller BR, Mitrevski B, Mühle J, O’Doherty S, Park S, Reimann S, Rigby M, Saito T, Salameh PK, Schmidt R, Simmonds PG, Steele LP, Vollmer MK, Wang RH, Yao B, Yokouchi Y, Young D, Zhou L (2018). History of chemically and radiatively important atmospheric gases from the Advanced Global Atmospheric Gases Experiment (AGAGE). Earth System Science Data 10, 985–1018.
| History of chemically and radiatively important atmospheric gases from the Advanced Global Atmospheric Gases Experiment (AGAGE)Crossref | GoogleScholarGoogle Scholar |
Ramanathan V (1975). Greenhouse effect due to chlorofluorocarbons: climatic implications. Science 190, 50–52.
| Greenhouse effect due to chlorofluorocarbons: climatic implicationsCrossref | GoogleScholarGoogle Scholar |
Ray EA, Portmann RW, Yu P, Daniel J, Montzka SA, Dutton GS, Hall BD, Moore FL, Rosenlof KH (2020). The influence of the stratospheric Quasi-Biennial Oscillation on trace gas levels at the Earth’s surface. Nature Geoscience 13, 22–27.
| The influence of the stratospheric Quasi-Biennial Oscillation on trace gas levels at the Earth’s surfaceCrossref | GoogleScholarGoogle Scholar |
Refrigerant Reclaim Australia (RRA) (2018). Refrigerant Reclaim Australia. Available at https://refrigerantreclaim.com.au/ [verified September 2018]
Rigby M, Prinn R, O’Doherty S, Montzka S, McCulloch A, Harth C, Mühle J, Salameh P, Weiss R, Young D, Simmonds P, Hall B, Dutton G, Nance D, Mondeel D, Elkins J, Krummel PB, Steele LP, Fraser PJ (2013). Re-evaluation of the lifetimes of the major CFCs and CH3CCl3 using atmospheric trends. Atmospheric Chemistry and Physics 13, 2691–2702.
| Re-evaluation of the lifetimes of the major CFCs and CH3CCl3 using atmospheric trendsCrossref | GoogleScholarGoogle Scholar |
Rigby M, Prinn RG, O’Doherty S, Miller BR, Ivy D, Mühle J, Harth CM, Salameh PK, Arnold T, Weiss RF, Krummel PB, Steele LP, Fraser PJ, Young D, Simmonds PG (2014). Recent and future trends in synthetic greenhouse gas radiative forcing. Geophysical Research Letters 41, 2623–2630.
| Recent and future trends in synthetic greenhouse gas radiative forcingCrossref | GoogleScholarGoogle Scholar |
Rigby M, Park S, Saito T, Western LM, Redington AL, Fang X, Henne S, Manning AJ, Prinn RG, Dutton GS, Fraser PJ, Ganesan AL, Hall BD, Harth CM, Kim J, Kim K-R, Krummel PB, Lee T, Li S, Liang Q, Lunt MF, Montzka SA, Mühle J, O’Doherty S, Park M-K, Reimann S, Salameh PK, Simmonds P, Tunnicliffe RL, Weiss RF, Yokouchi Y, Young D (2019). Increase in CFC-11 emissions from eastern China based on atmospheric observations. Nature 569, 546–550.
| Increase in CFC-11 emissions from eastern China based on atmospheric observationsCrossref | GoogleScholarGoogle Scholar | 31118523PubMed |
Ryall DB, Maryon RH (1998). Validation of the UK Met Office’s NAME model against the ETEX dataset. Atmospheric Environment 32, 4265–4276.
| Validation of the UK Met Office’s NAME model against the ETEX datasetCrossref | GoogleScholarGoogle Scholar |
Scheutz C, Kjeldsen P (2003). Capacity for biodegradation of CFCs and HCFCs in a methane oxidative counter-gradient laboratory system simulating landfill covers. Environmental Science & Technology 37, 5143–5149.
| Capacity for biodegradation of CFCs and HCFCs in a methane oxidative counter-gradient laboratory system simulating landfill coversCrossref | GoogleScholarGoogle Scholar |
Scheutz C, Dote Y, Fredenslaund AM, Mosaek H, Kjeldsen P (2007). Attenuation of fluorocarbons released from foam insulation in landfills. Environmental Science & Technology 41, 7714–7722.
| Attenuation of fluorocarbons released from foam insulation in landfillsCrossref | GoogleScholarGoogle Scholar |
Simmonds PG, O’Doherty S, Nickless G, Sturrock GA, Swaby R, Knight R, Picketts J, Woffendin G, Smith R (1995). Automated gas chromatograph/mass spectrometer for routine atmospheric field measurements of the CFC replacement compounds, the hydrofluorocarbons and hydrochlorofluorocarbons. Analytical Chemistry 67, 717–723.
| Automated gas chromatograph/mass spectrometer for routine atmospheric field measurements of the CFC replacement compounds, the hydrofluorocarbons and hydrochlorofluorocarbonsCrossref | GoogleScholarGoogle Scholar |
Simmonds P, Rigby M, Manning A, Lunt M, O’Doherty S, Young D, McCulloch A, Fraser P, Henne S, Vollmer M, Reimann S, Wegner A, Mühle J, Harth C, Salameh P, Arnold T, Weiss R, Krummel P, Steele P, Dunse B, Miller B, Lunder C, Hermansen O, Schmidbauer N, Saito T, Yokouchi Y, Li S, Park S, Li S, Yao B, Zhou L, Arduini J, Maione M, Wang R, Prinn R (2016). Global and regional emissions estimates of 1,1-difluoroethane (HFC-152a, CH3CHF2) from in situ and air archive observations. Atmospheric Chemistry and Physics 16, 365–382.
| Global and regional emissions estimates of 1,1-difluoroethane (HFC-152a, CH3CHF2) from in situ and air archive observationsCrossref | GoogleScholarGoogle Scholar |
Sturrock GA, Porter LW, Fraser PJ (2001). In situ measurement of CFC replacement and other halocarbons at Cape Grim: the AGAGE GC-MS program. In ‘Baseline Atmospheric Program Australia 1997–98’. (Eds NW Tindale et al.) pp. 43–49. (Bureau of Meteorology and CSIRO Atmospheric Research: Melbourne)
Sturrock GA, Etheridge DM, Trudinger CM, Fraser PJ, Smith AM (2002). Atmospheric histories of halocarbons from analysis of Antarctic firn air: major Montreal Protocol species. Journal of Geophysical Research 107, 4765
| Atmospheric histories of halocarbons from analysis of Antarctic firn air: major Montreal Protocol speciesCrossref | GoogleScholarGoogle Scholar |
Technology and Economic Assessment Panel (TEAP) (2019). Volume 1: Decision XXX/3 TEAP Task Force Report on Unexpected Emissions of Trichlorofluoromethane (CFC-11). (Eds J Pons et al.) (UNEP: Nairobi)
United Nations Environment Programme (UNEP) (2012). ‘Handbook for the Montreal Protocol on substances that deplete the ozone layer, 9th edn.’ (Ozone Secretariat: Nairobi)
United Nations Framework Convention on Climate Change (UNFCCC) (2020). National Inventory Submissions 2020. Available at https://unfccc.int/process-and-meetings/transparency-and-reporting/reporting-and-review-under-the-convention/greenhouse-gas-inventories-annex-i-parties/national-inventory-submissions-2020 [verified May 2020]
Velders GJM, Anderson SO, Daniel JS, Fahey DW, McFarland M (2007). The importance of the Montreal Protocol in protecting climate. Proceedings of the National Academy of Sciences of the United States of America 104, 4814–4819.
| The importance of the Montreal Protocol in protecting climateCrossref | GoogleScholarGoogle Scholar |
Vollmer MK, Young D, Trudinger CM, Mühle J, Henne S, Rigby M, Park S, Li S, Guillevic M, Mitrevski B, Harth CM, Miller BR, Reimann S, Yao B, Steele LP, Wyss SA, Lunder CR, Arduini J, McCulloch A, Wu S, Rhee TS, Wang RHJ, Salameh PK, Hermansen O, Hill M, Langenfelds RL, Ivy D, O’Doherty S, Krummel PB, Maione M, Etheridge DM, Zhou L, Fraser PJ, Prinn RG, Weiss RF, Simmonds PG (2018). Atmospheric histories and emissions of chloroffuorocarbons CFC-13 (CClF3), ΣCFC-114 (C2Cl2F4), and CFC-115 (C2ClF5). Atmospheric Chemistry and Physics 18, 979–1002.
| Atmospheric histories and emissions of chloroffuorocarbons CFC-13 (CClF3), ΣCFC-114 (C2Cl2F4), and CFC-115 (C2ClF5)Crossref | GoogleScholarGoogle Scholar |
Yang H, Waugh DW, Orbe C, Patra PK, Jöckel P, Lamarque J-F, Tilmes S, Kinnison D, Elkins JW, Dluglokencky EJ (2019). Evaluating simulations of interhemispheric transport: interhemispheric exchange time versus SF6 age. Geophysical Research Letters 46, 1113–1120.
| Evaluating simulations of interhemispheric transport: interhemispheric exchange time versus SF6 ageCrossref | GoogleScholarGoogle Scholar |
Yesiller N, Hanson JL, Sohn AH, Bogner JE, Blake DR (2018). Spatial and temporal variability in emissions of fluorinated gases from a California landfill. Environmental Science & Technology 52, 6789–6797.
| Spatial and temporal variability in emissions of fluorinated gases from a California landfillCrossref | GoogleScholarGoogle Scholar |
Zellweger C, Steinbrecher R, Laurent O, Lee H, Kim S, Emmenegger L, Steinbacher M, Buchmann B (2019). Recent advances in measurement techniques for atmospheric carbon monoxide and nitrous oxide observations. Atmospheric Measurement Techniques 12, 5863–5878.
| Recent advances in measurement techniques for atmospheric carbon monoxide and nitrous oxide observationsCrossref | GoogleScholarGoogle Scholar |