

Future Directions in Astronomy Visualization
Christopher J. Fluke A B , Paul D. Bourke A and David O’Donovan AA Centre for Astrophysics & Supercomputing, Swinburne University of Technology, Hawthorn VIC 3122, Australia
B Corresponding authors: Email: cfluke@swin.edu.au
Publications of the Astronomical Society of Australia 23(1) 12-24 https://doi.org/10.1071/AS05034
Submitted: 4 October 2005 Accepted: 17 February 2006 Published: 29 March 2006
Abstract
Despite the large budgets spent annually on astronomical research equipment such as telescopes, instruments, and supercomputers, the general trend is to analyze and view the resulting datasets using small, two-dimensional displays. We report here on alternative advanced image displays, with an emphasis on displays that we have constructed, including stereoscopic projection, multiple projector tiled displays, and a digital dome. These displays can provide astronomers with new ways of exploring the terabyte and petabyte datasets that are now regularly being produced from all-sky surveys, high-resolution computer simulations, and Virtual Observatory projects. We also present a summary of the Advanced Image Displays for Astronomy (AIDA) survey which we conducted from 2005 March–May, in order to raise some issues pertinent to the current and future level of use of advanced image displays.
Keywords: methods: data analysis
Introduction
Astronomy is possibly the most visual of all the sciences, in both the way the data is collected and analyzed. Optical telescopes take images of the night sky so that the position, orientation, size, shape, brightness, and colour of celestial objects can be determined (Fomalont 1982). Radio telescopes record intensity, polarization, and velocity data that is converted into pseudo-colour images or three-dimensional (3D) spectral line cubes. Numerical simulations produce datasets that are often inspected visually before being compared statistically with surveys. Data reduction, a key step in the analysis of astronomy data, is best performed by eye — the human brain has incredible pattern-matching abilities that are yet to be reproduced with a computer algorithm (e.g. Norris 1994; Gooch 1995). Visual representations allow the user to see patterns and relationships that are not apparent in simple lists of numerical results (Domik & Mickus-Miceli 1992).
Each year, astronomers spend millions of dollars on research equipment — telescopes, satellites, instruments, and supercomputers. Yet the general trend is to analyze and explore the resulting observational and numerical datasets on small (e.g. 17′′ to 21′′ diagonal) two-dimensional (2D) computer monitors. Current and future facilities (e.g. Square Kilometre Array, Large Scale Synoptic Telescope), surveys (e.g. Two-Micron All Sky Survey, Sloan Digital Sky Survey, Gaia), and supercomputer simulations (e.g. where N > 108 particles) provide datasets measured in terabytes and petabytes. Virtual Observatory projects are bringing together disparate data archives for the research community to explore — with millions of objects, each having multiple parameters, it is an increasingly complex task to make sense of these volumes of data (Welling & Derthick 2001). Standard visualization techniques using small, 2D displays cannot hope to provide astronomers with a complete understanding of relationships, dependencies, and spatial features over a range of resolutions and length/size scales in complex n-dimensional datasets. Data mining techniques, whether machine-oriented or human-directed, are becoming ever more important (e.g. Teuben et al. 2001; Mann et al. 2002; Beeson, Barnes, & Bourke 2003).
With cost savings and graphics performance driven by the consumer markets for computer games 1 and home theatre, 2 it has become feasible to produce affordable advanced image displays such as high-resolution tiled displays, stereoscopic 3D projection, and digital domes, with commodity or ‘off-the-shelf’ components. We have witnessed on-going increases in computing and graphics power, and developments in ‘state of the art’ image displays which have affected both single-user systems (e.g. higher resolution monitors, flat-panel plasma displays, and autostereoscopic displays) and collaborative visualization environments.
Since the review of display techniques and image analysis by Rots (1986), there has been no systematic investigation into the usefulness of advanced display technologies for astronomical datasets (although for specific cases see Norris 1994, Hultquist et al. 2003, Joye & Mandel 2004). We have reached a stage where advanced image displays can start to be more useful to, and more widely used by, astronomers. Therefore, it is an appropriate time to take stock of the tools that are now available, assess their value to astronomers, and look ahead to future techniques for visualizing datasets of increasing complexity. Our emphasis is on non-standard image display devices. This allows us to explore possibilities beyond the conventional 2D techniques (paper, computer monitors, overhead projectors, and data projectors).
This paper is set out as follows. In the first two sections following, we provide descriptions of a number of advanced image displays, focussing on the specific systems that we have constructed as demonstrators — stereoscopic projection, the digital dome, multiple projector tiled displays, and the Virtual Room. In ‘The AIDA Survey’, we report on some of the issues raised by an informal survey on the level of awareness of advanced images displays that was targeted at members of the Astronomical Society of Australia (ASA). Finally, in ‘The Limits of Visualization’, we look at some of the limitations that advanced image displays and visualization systems must overcome before they can be more widespread among the astronomical community.
Two-Dimensional Displays
In this section we investigate two types of 2D display devices: large format tiled displays and digital domes. Both solutions can provide very high resolution display environments, that are ideal for collaborative investigations or group presentations.
Large Format Tiled Displays
Overview
CCD detectors are now well over the (10k×10k =) 108 pixel limit (e.g. CFHT-Megaprime, SDSS, MMT-Megacam, and the upcoming VISTA telescope). Typical cathode ray tube or liquid crystal display (CRT, LCD) monitors for desktop and notebook computers have resolutions ranging from 1024×768 (XGA) to 1600×1200 (UXGA), with XGA also proving popular (and affordable) for data projectors. 3 Therefore, there are many more pixels in the datasets than a single monitor or projector can handle — in order to see the full picture, low levels of detail must be omitted. To see the dataset at full resolution, only part of the image can be viewed at one time and the user must pan, roam, or rely on their memory to see the large-scale features (Welling & Derthick 2001).
While it might seem that increasing the pixel resolution of monitors is a solution, there is a physical limitation: The angular resolution of the eye is about 0.02°≈1/3000 rad (Fomalont 1982 and references therein). For a viewing distance of d metres, pixels smaller than about p ≈ d/3000 m will not be resolvable. Now p = x/N x where x is the horizontal screen diameter, and N x is the horizontal pixel resolution. For example, for a laptop with x = 0.25 m and d = 0.5 m, there is no real benefit in going beyond a horizontal pixel resolution of about 1500 pixels. To benefit from more pixels, the viewer would need to move closer to the screen, which is neither practical nor comfortable for a small screen. Alternatively, the display can be made much larger, by using one or more data projectors.
Our Solution
While it is possible to purchase data projectors with a tiling capability built-in, our approach was to use lower-cost, commodity projectors driven by different computers or different graphics pipes on the same computer. Since commodity projectors are not designed with tiling in mind, it is not always possible to reliably align multiple projectors in a pixel-perfect way. A gap between the images or a double bright seam is the usual visual result, both of which are not ideal for content where the virtual camera is panning or objects are moving across the seam. These problems can be overcome by overlapping the two images, and modifying the pixels in the overlap region to reduce the overlap’s visibility. Projector misalignments or lens aberrations will now only be seen as a slight blurring of the image, and not as a sharp seam or gap.
A simple blending approach is to fade the intensity of the images to black within the overlap region. This approach works equally well for any number of images and also for images that may not be aligned in a rectangular fashion. Using a pair of XGA digital light processing (DLP) projectors, we produced a 1792×768 pixel tiled display with a 256 pixel-wide overlap. The degree of overlap is dictated by the amount of gamma correction required (see below) and the dynamic range of the blend function. 4
We use a blending function f(x) of the form
although a range of blend functions are possible. For simplicity, we normalize the pixel coordinates of the blend region to be 0 ≤ x ≤ 1. The exact curvature of the blend function is controlled by the parameter p. Blending is linear for p = 1, although this tends to result in a visible step at the edge of the blending region. The transition around x = 0.5 becomes steeper as p increases, and we have found p = 2 to be a reasonable choice. For each pixel in the overlap region, the final pixel value is the sum of the right image pixel value multiplied by f(x) and the left image pixel value multiplied by 1 – f(x).
The blending function is implemented as a gradient mask applied to an OpenGL texture, however, the mask on its own does not produce the correct blending. Instead, a grey band appears within the overlap region. This is because we are adding pixel values when we should be adding brightnesses, which can be achieved by compensating for the display gamma. The output brightness (normalized in the range 0 to 1) is the pixel value raised to the power of G, usually in the range 1.8 ≤ G ≤ 2.2.
Fortunately, this is readily corrected by applying an inverse gamma power. The total transformation of the image pixels is f(x)1/G and f(1 – x)1/G for the two image streams. In general, the gamma correction needs to be applied to each R, G, B colour value separately.
A limiting factor in any approach is the degree to which the projector can create black. While CRT projectors produce the best black, they are undesirable for other reasons (bulk, calibration, low light levels). LCD projectors typically have very poor black levels, and DLP projectors are somewhere in between.
Digital Domes
Overview
To the ancient astronomers, the night sky was an enormous sphere rotating around the Earth. Although our world-view has changed dramatically, this spherical model is still very convenient to use. It is somewhat surprising that astronomers display maps of the night sky (e.g. all-sky surveys of pulsars, galaxy maps, or clouds of neutral hydrogen) on small, flat, low angular-coverage monitors using mapping techniques that distort areas and spatial relationships. 5
The exception is the astronomy education world, where planetarium domes provide an idealized representation of the sky. Planetarium projection technology has come a long way since the world’s first opto-electric projector was constructed by Zeiss Optical Works for the Deutsches Museum in Munich. In part, these advances have been driven by consumer desires with viewers exposed to more sophisticated animations on television than planetariums could present (Murtagh 1989). During the last decade, a mini-revolution has occurred with the emergence of full-dome video systems, available from a growing number of vendors. 6 Typically five to seven projectors display computer-generated, edge-blended content that is projected onto the entire dome at resolutions up to 4000 × 4000 pixels. 7
With the notable exceptions of the Hayden Planetarium at the American Museum of Natural History, New York, which has been used to visualize astronomical surveys in the Digital Universe project (Abbott et al. 2004) and large-scale numerical simulations (Teuben et al. 2001), and the Cosmic Atlas project of the Gates Planetarium in Denver, planetarium domes have been under-utilized as data exploration environments. Reasons for this include:
-
Availability and accessibility: Fixed installations require a great deal of physical space, leading to their placement in museums and science centres away from researchers.
-
Limited dataset size: Traditional opto-electrical star projectors could not show generic datasets, and the first generation of digital star projectors that appeared during the 1990s were limited to datasets of a few thousand particles.
-
Low resolution/low definition: Early digital solutions suffered from noticeable image distortions (e.g. non-uniform pixel sizes, so that digital stars near the horizon are stretched) and projected in monochrome.
-
Lack of software tools: Designed to integrate with other planetarium show playback components, these systems do not use formats that astronomers are more experienced with.
-
Cost: A full-dome projection system plus large (≥10 m) dome can cost well over $1 million. Unless the system was to be in nearly constant use for scientific visualization, the expenditure is extremely hard to justify.
The next step in digital dome projection is just occurring: A range of single projector solutions are entering the market, many of which use the angular fish-eye lenses designed by Elumenati. 8 Coupled with this is the growing availability of portable, inflatable domes that are light, and easy to set-up and pack away.
Unlike a normal fish-eye lens, the Elumenati lens produces a constant pixel size across the dome. These lenses are still quite expensive, and are only suitable for a limited range of projectors. This means that if an upgraded projector becomes available (e.g. with increased pixel numbers, or a larger dynamic range from black to white), a new lens must also be purchased — assuming that a fish-eye designed for that projector exists. Another limitation is that the lens is usually placed in the centre of the dome, however for a small dome this is often the ideal viewing position.
Our Solution
We have developed an alternative single projector solution that does not require a fish-eye lens. Our approach uses a spherical mirror to reflect images from the projector onto the dome surface. The mirror is placed at the edge of the dome, freeing up the centre for the viewer.
A polar grid projected with a spherical mirror onto a dome with a standard DLP projector (image aspect ratio of 4:3) will appear distorted: Equally spaced lines of latitude will not be parallel with the dome horizon line, and will tend to ‘bunch-up’ close to the mirror location. To create an undistorted image the projected image needs to be pre-distorted, a process we refer to as ‘warping’, as shown in Figure 1. Displayed on the dome, the image now has the pole at the dome’s zenith and latitude lines are parallel with the horizon.

|
There are three ways of deriving the warping transformations:
-
The mapping can be derived analytically. While this may be possible for idealized arrangements, for other more real world situations it can be cumbersome.
-
Develop an application that allows the mappings to be created interactively, by moving vertices and (u, v) coordinates of a mapping mesh until the correct mapping is achieved.
-
Simulate the projection environment by tracing rays from the projector through each pixel in the image, reflect the ray off a virtual mirror and onto the dome. Once the position on the dome is known the mapping for the pixel in question can be calculated. We have found this method to be the most useful for an arbitrary dome, mirror, and projector configuration.
Once the warp map is obtained, the distorted geometry can be produced by several methods, including:
-
Creating a cubic environment using a perspective projective onto four sides of a cube, which is then resampled onto an angular fish-eye image prior to warping. This approach is best for movie-style content, where high image quality is required.
-
Mapping directly to the warp map from the cubic environment by modifying the texture coordinates, without the need for the intermediate fish-eye step. This is ideal for interactive or real-time data exploration, and we have implemented this approach with OpenGL applications.
There is a variation in the light path to different parts of the dome, that causes an uneven brightness across the dome. This is corrected by applying a nonuniform gradient across the image. The one form of distortion that cannot be corrected for is the need for variable focus across the mirror. This is not a major problem if a projector–lens combination is chosen with a good depth of focus and the front/centre of the image is projected with the region of sharpest focus.
With our mirror solution, the full dome surface is not illuminated. This is intentional and is similar to most fish-eye projection solutions which project onto three-quarters of the dome’s surface. A dual projector arrangement with a single edge blend across the centre is the simplest way to get complete dome coverage.
With a very basic set-up consisting of a laptop (running Macintosh OS-X), an XGA projector, and one-quarter spherical mirror, we have successfully tested our mirror system in a range of dome sizes, from a 3-m diameter rigid, upright dome, a 5-m diameter inflatable dome, to an 15-m diameter fixed dome. In a side-by-side comparison with a commercial fish-eye solution, there was no significant difference in the projected images. The image quality depends on the type of content that is being viewed, and as with all single-projector solutions using XGA projectors, it is hard to obtain good point sources. Our early testing showed that there was substantial ghosting from using a back-silvered plexiglass mirror. This effect was removed by using a front-surface mirror — a chrome coating was applied to the plexiglass. However, this surface is much more delicate and must be treated with care.
Three-Dimensional Displays
Although a useful intermediary tool, displaying 3D data on a 2D monitor cannot always provide a full understanding of a dataset.
In a spectral line cube, structures may extend beyond one slice, yet a 2D display often requires the user to remember what other slices looked like in order to build a mental picture of the 3D distribution. An improvement is to use volume rendering (for descriptions of the technique and astronomical applications, see Drebin, Carpenter, & Hanrahan 1988; Gooch 1995; Oosterloo 1995; Beeson et al. 2003; Rixon et al. 2004) or isosur-faces, creating a 3D object out of the data that can be interactively rotated and examined. Combined with lighting, textures, and shading this produces a very realistic image, but with an assumption that we can understand the type of abstract 3D structure that is viewed (Rots 1986).
Stereoscopic Projection
A stereoscopic image is produced by presenting different views to the left and right eye — changes in the horizontal parallax of foreground and background objects result in a perception of depth. Various techniques exist for presenting stereoscopic images, however we restrict our discussion below to techniques that can be used for large-scale projection of digital content, suitable for collaborative visualization or public presentation, with real-time interaction.
Perhaps the most well-known solution are red/blue or red/green anaglyph glasses, which are cheap and easy to produce. ‘Chroma-Depth’ glasses were developed by Steenblik (1996) and use a pair of prisms to disperse and then recombine light such that colour provides parallax information — red objects appear closer to the viewer than blue objects. Thin lines and low line or point densities are required for the best effects, and this approach is less effective for isosurfaces (e.g. Verwichte & Galsgaard 1998, who used chromo-stereoscopy to present simulations of prominence formation, however for an application using isosurfaces effectively to study the large-scale structure of the Universe, see Hultquist et al. 2003). As with anaglyphs, chroma-stereoscopic images can be presented on monitors or printed as hardcopies. The main limitation of these two approaches is the lack of colour for anything other than depth information.
A full-colour approach is to use a single projector operating at a higher-than-normal refresh rate (e.g. 120 Hz) that alternately displays left and right images. The images are viewed using electronic glasses that switch between transparent and opaque for each eye, synchronized to the projector. While it may appear that this method would have no cross-talk between the two images, this is not case. The combined effects of switching time, phosphor decay (for CRT projectors), and the scan-line pattern mean that significant ghosting can occur. We have found that this approach results in the most eye-strain over extended periods of usage, most likely due to the flickering of the shutter glasses. In addition, the glasses themselves are heavy to wear (compared to plastic or even cardboard-framed glasses that other methods utilize) and can be quite expensive and fragile.
In our experience, crossed polarizing filters provide one of the most effective passive stereoscopic methods. Two data projectors, producing one image for each eye, are equipped with linear or circular filters. The viewer wears polarizing glasses with filters that match those of the projector. The advantage is that full-colour images can be displayed, providing a much more vivid and realistic stereo environment. An additional hardware requirement is a polarization preserving screen, as a normal screen such as a painted wall 9 will depolarize the incident light. Both left and right eye images are projected simultaneously, using two outputs from the graphics pipe of a single machine. The main disadvantage for linear filters is that the audience members cannot tilt their heads by more than a few degrees. Apart from this, the amount of cross-talk or ghosting for linear filters is minimal, becoming more noticeable for high contrast images. This situation can be partly improved by using circular filters, but typically at higher cost for both filters and glasses, and we have found that there is more overall ghosting.
There are two additional variations on the techniques outlined above — front versus rear projection. In the former case, the projector is on the same side of the screen as the audience. This often requires that the projectors are mounted high, which can lead to additional expense and lack of portability. For rear projection, the projector(s) are behind the screen, on the opposite side to the audience, which means that the projection system requires additional physical space. For polarizing solutions, a rear projection surface that maintains polarization with minimal loss due to absorption is required — in general, the screen material is very different for front and rear projection.
The simplest stereoscopic projection environment is a single, flat wall. A multiple wall environment comprises two or more screens, with a range of angles between the walls. In all multiple wall environments, it is often necessary to nominate a ‘sweet spot’ where the viewer should be located. When creating stereoscopic content, whether computer-generated or through photography, knowledge of the viewer position is required. For a single wall system, moving away from the preferred position (either towards or away from the screen, or off-axis parallel to the screen) results in a distortion of the stereoscopic projection. The situation is much more complex for multiple walls, so these environments are often best suited to a single viewer.
A side-by-side multiple-wall environment is an extension of the tiled projector situation, discussed above in ‘Large Format Tiled Displays’, with a requirement for edge-blending (now making sure there is consistency between both left and right pairs of images). Angling the walls provides a more immersive environment, and when combined with head-tracking, enables the viewer a greater range in the directions they can look and move. A further extension is the Cave Automatic Virtual Environment (CAVE; Cruz-Neira et al. 1993), where there are usually five rear-projected walls: front, two sides, roof, and floor. In some cases, a sixth screen is added at the back, totally enclosing the viewer. Another option for multiple-walls are curved screens, such as in the SGI Reality Center, 10 which typically uses three edge-blended projectors, or the Advanced Visualization and Interaction Environment (AVIE) developed at iCinema (University of New South Wales). AVIE is an immersive environment, 10 m in diameter and 4 m high, that surrounds the audience with a 360° stereoscopic panorama.
The Virtual Room
The Virtual Room is an eight-wall, rear-projected stereoscopic system, as shown in Figure 2. 11 Unlike other multiple-wall stereo systems, where the viewer is placed inside a virtual space, the Virtual Room can be thought of as a virtual container — the viewer stands on the outside and is able to walk around the Virtual Room in order to obtain different perspectives.

|
The Virtual Room is a collaborative environment, suitable for about 60 people to experience at one time. As the most expensive advanced display that we have constructed, we would not propose that every astronomy research group needs to purchase one. However, we can envision its use during a workshop, perhaps for a collaborative investigation of multi-wavelength data. Each stereoscopic screen could show a specific wavelength or simulation, and researchers could move from screen to screen, exploring and discussing their results.
Head-Mounted Displays
Head-mounted displays (HMDs) provide a near-complete immersive experience — the wearer receives a view of their data without distractions from the environment, although the HMD itself can be quite distracting. The major drawbacks of this approach are:
-
Low resolution: While some of the more expensive models have resolutions of 1280 × 1024 per eye, most devices are much lower resolution, 640 × 480 and 800 × 600 being quite common.
-
Awkward to wear: Newer devices are much lighter, but they are still intrusive to wear. Although we have not used HMDs, our experience of lightweight plastic polarizing glasses versus heavier electronic shutter glasses has convinced us that lighter is better when choosing hardware that is worn for extended periods.
-
Eye fatigue: Studies have indicated some critical side-effects of using HMDs, including nausea, severe vision problems and motion sickness (e.g. Geelhoed, Falahee, & Latham 2000 and references therein).
Autostereoscopic Displays
An autostereoscopic display allows the user to see a stereoscopic view without the need for glasses. One approach is to use a lenticular screen placed in front of (or integrated into) an LCD monitor. Reducing the overall resolution of the monitor, the lenticular gratings direct alternating vertical lines to the left and right eye. Alternatives include using layers of LCD panels, or swept volume displays where images are projected onto a rotating blade and the persistence of vision of the viewer’s eye causes a ‘solid’ object to appear that can be viewed from a wide range of angles.
While advanced image displays continue to require specific processing environments, specialized rooms, or intrusive stereo glasses, they run the risk of being underused. The autostereoscopic display shows a great deal of promise in the years ahead, as models that also operate like a conventional 2D monitor can easily be integrated onto the astronomer’s desk. Taking the advanced display to the astronomer is preferable to taking the astronomer to the advanced display.
The AIDA Survey
From 2005 March 7 to May 2, we conducted the Advanced Image Displays in Astronomy (AIDA) survey. Advertised to members of the Astronomical Society of Australia, this web-based survey was designed to provide a snapshot of the level of awareness of advanced image displays amongst the society’s membership. 12
The AIDA survey received 41 responses, or about 10% of the ASA membership. Due to the low response rate, the results should not be taken as indicative of the wider astronomy research community either within Australia or internationally. However, the survey has raised several issues that are worthy of comment, and these are guiding our on-going work in this field.
The AIDA survey comprised fourteen questions requiring simple box-ticking responses, the fifteenth question was an opportunity to provide general comments on advanced displays. Further details of the questions and responses may be found in the Appendix.
The first set of questions (Q1–Q3) were used to look at the demographics of the sample. We received responses from 17 Masters/PhD students, ten postdoctoral fellows, eight tenured/permanent academics, and four researchers in contract positions. There was also one response from an undergraduate student and one retired academic.
The next set of questions (Q4–Q9) looked at the astronomical interests and current visualization approaches. Twelve respondents identified themselves as radio astronomers, twelve as optical astronomers, and eight as computational astronomers (most of these were students, perhaps indicating the growth in this field within Australia in recent years).
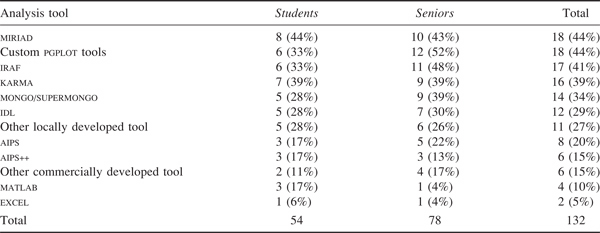
Presented with a list of standard visualization tools (including additional tools that were suggested by the respondents) we found that the astronomers in our sample were using an average of 3.2 visualization and analysis tools each. The trend in using packages such as iraf and miriad was consistent with the number of optical and radio astronomers in the sample. For advanced image displays to be useful and usable, they must be compatible with a wide range of packages and data formats.
Custom pgplot 13 tools were also widely used (44% of respondents). This demonstrates the willingness of astronomers to write their own code when existing tools are not capable of producing all of their analysis and visualization needs. Awareness of advanced displays needs to be supported with awareness of programming techniques, such as a set of basic pgplot routines that are compatible with stereoscopic projection, digital domes, or other display types. We are now developing such a set of programming tools.
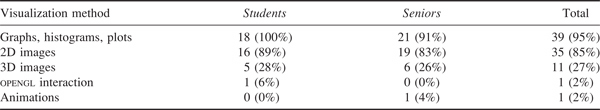
All of our respondents indicated that they visualize their data in some form, whether it be simple graphs, histograms and plots, or 2D images. While eleven respondents had used 3D images, only six had actually used a three-dimensional display technique such as stereoscopic projection.
We were somewhat surprised by the response to Q7 ‘How would you describe the dimensionality of the majority of your data?’ Given the choice of either one-, two-, three-, or n-dimensional, only half of the respondents indicated that they used data with dimensionality n ≥ 3. It would seem that the respondents were only considering Cartesian coordinates, rather than also counting other parameters as contributing to the dimensionality of the dataset, and this outcome may have been affected by the way the question was posed. Consider a computational example: A typical N-body simulation contains three-dimensional particle positions, but also calculates parameters including velocity, density, or gravitational potential in a time-varying fashion. Such a dataset has a dimensionality n > 3, and any subset of these parameters could be visualized and explored in order to gain a better understanding of their relationships, particularly with one of the three-dimensional displays we discussed above. If astronomers are not thinking of their datasets in this way, we would encourage them to start.
The third set of questions (Q10–Q14) was aimed at testing the level of awareness of specific advanced image displays, including whether respondents had used these devices, whether they saw a benefit from them, and what aspects might be preventing their uptake. Only six respondents had ever used an advanced image display in their astronomy research. While only 16 people indicated that they saw a definite benefit from using advanced displays, none responded ‘definitely no’ (the remainder of the sample selected ‘perhaps’). We should not draw too many conclusions from this — we cannot test whether those astronomers that took part in the AIDA survey are the only ones from the ASA membership that see some benefit from using advanced image displays. We remain hopeful that with growing awareness of the available tools and techniques more astronomers will see some benefit to their work.
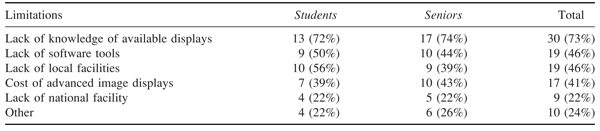
The most informative result to come out of the AIDA survey were the reasons why our respondents were not currently making use of advanced image displays. The most common limiting factor (selected by 73% of the sample) was lack of knowledge of advanced displays, followed by lack of software tools and access to local facilities (46% each). Along with the choices we proposed, individuals indicated other factors such as lack of time to investigate advanced displays or develop software for them, lack of knowledge of available software, and medical/physiological conditions. 14
The final question was an opportunity for the participants to share any other thoughts they had about the usefulness or otherwise of advanced image displays, types of advanced displays they would be interested in learning more about, etc. We present a selection of the responses below:
I doubt [the] usefulness if it is not readily available every time I need to visualize data.
Needs to be accessible to me personally and easily programmed/operated.
We agree that easy access to advanced image displays is important if they are to be widely used. This can be achieved most successfully through local facilities, but these require local expertise to go with them.
The need for these systems to be easily programmed perhaps goes back to the wide use of custom code (e.g. pgplot) written by astronomers, and may be seen more as a requirement for the development of a set of standard visualization tools. However, any generic tool is unlikely to meet the needs of every astronomer.
These displays definitely help in the visualization of many different phenomenon and I have seen [them] used successfully in a number of different instances... [however] I’d be more interested in knowing more about the tools or methods required to make use of these displays.
...training would be essential to get people over the threshold to start using these facilities.
For my own research the 2D display showing the 3D data has been sufficient; there has never really been the need to walk down the hall to the Virtual Reality room.
Awareness of advanced displays and the tools that go with them seems to be one of the big contributors to the current lack of uptake. As facilitators of advanced displays, we need to work harder to help astronomers through the first few steps in using these devices so that researchers can judge for themselves whether there are benefits from looking at their data in new ways.
I don’t really see any benefit to using these tools in my research — but they would be very valuable in teaching. I have not, however, used them for this due to the amount of my time needed to figure out how to do it.
Swinburne University of Technology has had great success in using stereoscopic displays for public education activities, using the approach that the same tools we use to view astronomical datasets for research are equally applicable for educational purposes. We would suggest that any institution or research group that installs an advanced display for research automatically has a valuable teaching tool at their disposal.
The Limits of Visualization
Norris (1994) identified four important features of a visualization system. They should:
-
Allow the user to gain an intuitive understanding of the dataset.
-
Let the user see features in the data that would not be obvious using other approaches.
-
Help the user to get quantitative results.
-
Enable results (both qualitative and quantitative) to be communicated to others.
The advanced display is only one part of a complete visualization system, and the usefulness of the displays will always be limited by the availability of software tools and the capability of the hardware that drives the display. For large datasets, the response speed/latency can limit the effectiveness of interactivity (e.g. Welling & Derthick 2001). There is a need for software tools that work consistently on range of displays (Rots 1986; Mann et al. 2002), so that users do not have constantly switch between data formats and user interfaces (Brugel et al. 1993). An example of where this software scalability has been successful is partiview, 15 a cross-platform application that works on laptops, desktops, and the 21-m Hayden Planetarium dome (Levy 2003).
One of the major challenges facing advanced image displays is the lack of hardcopies — if a researcher cannot print out the results of an investigation and publish it in a journal or send it to another researcher for comment, is it worth the effort? We note that similar problems still exist with regards to publishing videos or animations, and even high-resolution images in colour in some scientific journals. The growing move towards electronic publication means that datasets can be shared more easily over the Internet. Combine this with a standard data format and greater availability of local facilities, and the lack of hardcopies might not be such a limitation in the future.
To date, our own software effort has focussed on qualitative data exploration, as these can be implemented without sophisticated user interaction devices (e.g. a mouse or keyboard commands can be used to perform simple tasks like rotating datasets or zooming in and out). Quantitative tools can require a higher level of sophistication as part of the user interaction — is it intuitive to identify and highlight a three-dimensional region with a series of key-presses? While interaction devices exist (e.g. 3D ‘mice’ that can measure multiple degrees of freedom and the electronic ‘wand’ used in CAVEs), they often take some practice to use effectively. A more natural approach might be to let the user simply point with their hands at a particular region or object. Multi-sensory data exploration, where the astronomer is provided information via the senses of sight, hearing and touch, offers some tantalizing ideas for the way future astronomers might interact with, and immerse themselves within, their data.
Final Thoughts
Along with our goal of obtaining a snapshot of the level of awareness and uptake of advanced imaged displays amongst members of the ASA, the AIDA survey was intended to help astronomers start to think about the ways that advanced displays could help them with their research work.
Traditional 2D displays (paper, monitors, overhead projectors) will always remain incredibly valuable, and we are not attempting to suggest that they should be replaced. Many visualization tasks can be accomplished with contour plots, graphs, and histograms. What we wish to emphasize is that with the aid of advanced display technology, visualization can go well beyond this. To paraphrase Rots (1986) ‘One should not imagine that display tools come for free’, however, advanced image displays are an affordable reality, and today’s advanced display may well be tomorrow’s commonplace system.
We leave the close-to-final word on the AIDA survey to one of our participants, as it summarizes many of our own views on this subject:
We have now reached a point, with large-scale surveys and multi-wavelength databases, that we really need to be able to visualize multi-dimensional datasets to advance our understanding, but in general institutions often lack either appropriate software or display equipment and so individuals revert to traditional methods of display. There is also a time pressure that acts to prevent overworked researchers from learning new technologies as they simply [cannot] commit the hours required to learn them which hinders the desire to investigate possible advanced display options even when available.
With our on-going work, and supporters out there amongst the astronomical community, we hope to see advanced displays in more regular use in the years that follow. In the short term, the authors look forward to helping researchers explore their data with alternative approaches, as we have knowledge and experience we would like to share. It is time for astronomers to think outside the square frames of their monitors, and truly immerse themselves in the data.
Appendix. The AIDA Questions
We present in this appendix the questions and answers from the AIDA survey. Note that when percentages are summed, they may differ from 100% due to rounding. Each question had an option to provide ‘no answer’, and these responses have not been removed from the sample.
Q1. What is your current position? Our sample consisted of 17 Masters/PhD students, four postdoctoral fellows on their first placement, six postdoctoral fellows on their second or later placement, eight tenured/permanent academics, four researchers in contract positions, one retired academic and one undergraduate student. To simplify reporting, we introduce two broad categories of ASA members: students (44% of the sample) and a group that might loosely be defined as senior researchers (56%).
Q2. Where did you complete your most recent degree? 23 respondents had completed their most recent degree in Australia, seven in the UK, six in other European countries, two in the USA, and one each in Canada and New Zealand.
Q3. How recently did you complete your PhD studies? With 18 student respondents yet to complete, eight respondents had completed their PhD within the last five years, seven had completed more than five but fewer than ten years ago, and seven had completed more than ten years ago.
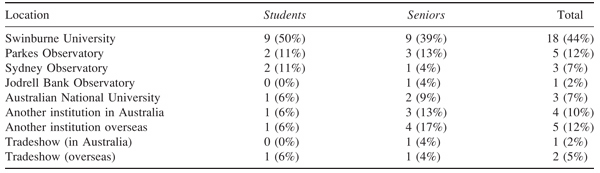
Q4. What are your main astronomical interests? Participants were able to select up to three research areas from a list, or provide their own choice. Table 1 shows the results, with responses separated into student and senior groups.
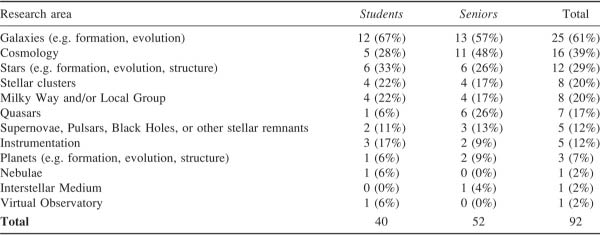
|
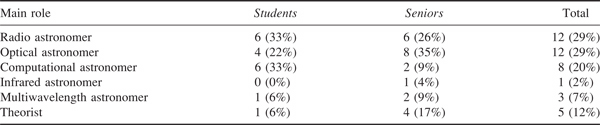
Q5. What is your main role? For this question, respondents were asked to nominate their main role from a list of options, or to propose an alternative. A summary of the responses for the student and senior groups is given in Table 2.
|
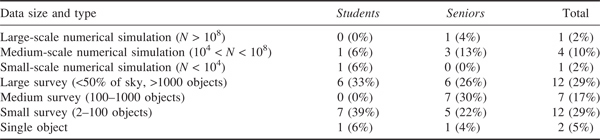
Q6. How would you describe the majority of the data that you use? This question gave respondents a choice of nine different data sample sizes, including small to large numerical simulations, small to all-sky surveys, single object, or instrument design, with results in Table 3.
|
Q7. How would you describe the dimensionality of the majority of your data? Due to the possible confusion over the wording in this question based on the results received, we do not present a detailed breakdown. See ‘The AIDA Survey’ for a discussion.
Q8. Which tools do you regularly use to analyze your data? Participants were presented with a range of standard data reduction, analysis, and visualization packages. Individuals reported using between zero and eight different packages. A summary of results is shown in Table 4.
|
Q9. What are the main ways you visualize your data? Participants were presented with a range of visualization methods. On average, astronomers used about two different methods each to visualize their data. Results are in Table 5.
|
Q10. Have you ever used an advanced image display for astronomy research? Only six respondents (15%) reported having used an advanced image display in their astronomy research — one student and five seniors
Q11. Do you see a benefit from using advanced image displays for astronomy research? Participants were given a choice of three answers. 16 respondents (39%) selected ‘yes’ and 25 selected ‘perhaps’. No respondent selected ‘definitely no’.
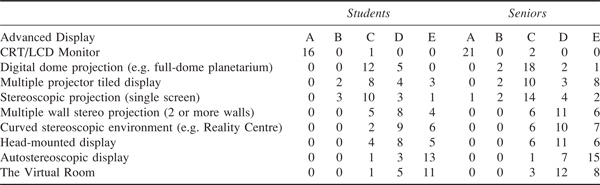
Q12. What is your experience of selected advanced image displays? In this question, we identified one common class of 2D image display (CRT or LCD monitors) and eight advanced image displays. Participants were asked to rate their knowledge using the following scheme:
-
A: Use the device >50% of the time.
-
B: Use the device <50% of the time.
-
C: Have seen the device in operation (not just in astronomy), but have not used it.
-
D: Have not seen the device in operation, although know what it is.
-
E: Not familiar with the device.
Table 6 gives the number of responses in each category for the nine different image displays. We can make a distinction between A + B and C + D to identify those advanced image displays that the respondents have used, and those they were aware of without having actually used them.
|
Q13. Which factors (if any) are currently preventing you from using advanced image displays in your research? Five options were presented to participants, with an option to suggest a limiting factor of their own. Results are presented in Table 7.
|
Q14. If you have seen a stereoscopic projection system in action, where was it? This question was designed to identify whether there was a ‘Swinburne Factor’. As we have been operating a stereoscopic 3D system since 1999, our staff, students, and visitors may have received a much higher level of exposure to the ideas of advanced image displays than the broader Australian astronomy community. 56% of respondents had not seen the Swinburne 3D theatre in operation, so it seems that the AIDA survey has reached further than just our local staff and students. However, as a fraction of the ASA membership, we may have received an over-supply of local responses. Results in Table 8.
|
Acknowledgments
This research has been funded by a Swinburne Researcher Development Grant. We would like to thank David Barnes and Evan Hallein for their valuable contributions, Glen Moore from the Wollongong Science Centre and Charles Treleaven from Cosmodome Australasia for access to their domes (fixed and portable), and Roberto Calati for his assistance with implementing edge-blending. We are appreciative to all of the respondents to the AIDA survey. We thank the anonymous referee for very useful comments that modified the direction of this paper.
Beeson,
B., Barnes,
D. G., & Bourke,
P. D. 2003, PASA, 20, 300
An error has occurred in (ref id="R2").
Variable LPAGE is undefined. [empty string]
array
1
struct
COLUMN
0
ID
??
LINE
241
RAW_TRACE
at cfincludeJournalRef_B2ecfm1510229986._factor10(G:\www\publishha\app\views\journal\includeJournalRef_B.cfm:241)
TEMPLATE
G:\www\publishha\app\views\journal\includeJournalRef_B.cfm
TYPE
CFML
2
struct
COLUMN
0
ID
CF_INCLUDEJOURNALREF_B
LINE
180
RAW_TRACE
at cfincludeJournalRef_B2ecfm1510229986._factor12(G:\www\publishha\app\views\journal\includeJournalRef_B.cfm:180)
TEMPLATE
G:\www\publishha\app\views\journal\includeJournalRef_B.cfm
TYPE
CFML
3
struct
COLUMN
0
ID
CF_INCLUDEJOURNALREF_B
LINE
177
RAW_TRACE
at cfincludeJournalRef_B2ecfm1510229986._factor13(G:\www\publishha\app\views\journal\includeJournalRef_B.cfm:177)
TEMPLATE
G:\www\publishha\app\views\journal\includeJournalRef_B.cfm
TYPE
CFML
4
struct
COLUMN
0
ID
CF_INCLUDEJOURNALREF_B
LINE
176
RAW_TRACE
at cfincludeJournalRef_B2ecfm1510229986._factor14(G:\www\publishha\app\views\journal\includeJournalRef_B.cfm:176)
TEMPLATE
G:\www\publishha\app\views\journal\includeJournalRef_B.cfm
TYPE
CFML
5
struct
COLUMN
0
ID
CF_INCLUDEJOURNALREF_B
LINE
170
RAW_TRACE
at cfincludeJournalRef_B2ecfm1510229986._factor40(G:\www\publishha\app\views\journal\includeJournalRef_B.cfm:170)
TEMPLATE
G:\www\publishha\app\views\journal\includeJournalRef_B.cfm
TYPE
CFML
6
struct
COLUMN
0
ID
CF_INCLUDEJOURNALREF_B
LINE
15
RAW_TRACE
at cfincludeJournalRef_B2ecfm1510229986._factor41(G:\www\publishha\app\views\journal\includeJournalRef_B.cfm:15)
TEMPLATE
G:\www\publishha\app\views\journal\includeJournalRef_B.cfm
TYPE
CFML
7
struct
COLUMN
0
ID
CF_INCLUDEJOURNALREF_B
LINE
12
RAW_TRACE
at cfincludeJournalRef_B2ecfm1510229986._factor42(G:\www\publishha\app\views\journal\includeJournalRef_B.cfm:12)
TEMPLATE
G:\www\publishha\app\views\journal\includeJournalRef_B.cfm
TYPE
CFML
8
struct
COLUMN
0
ID
CF_INCLUDEJOURNALREF_B
LINE
11
RAW_TRACE
at cfincludeJournalRef_B2ecfm1510229986._factor43(G:\www\publishha\app\views\journal\includeJournalRef_B.cfm:11)
TEMPLATE
G:\www\publishha\app\views\journal\includeJournalRef_B.cfm
TYPE
CFML
9
struct
COLUMN
0
ID
CF_INCLUDEJOURNALREF_B
LINE
1
RAW_TRACE
at cfincludeJournalRef_B2ecfm1510229986.runPage(G:\www\publishha\app\views\journal\includeJournalRef_B.cfm:1)
TEMPLATE
G:\www\publishha\app\views\journal\includeJournalRef_B.cfm
TYPE
CFML
10
struct
COLUMN
0
ID
CFINCLUDE
LINE
3230
RAW_TRACE
at cfArticle2ecfc1291681887$funcREFERENCESDTD1._factor150(G:\www\publishha\app\modules\journal\Article.cfc:3230)
TEMPLATE
G:\www\publishha\app\modules\journal\Article.cfc
TYPE
CFML
11
struct
COLUMN
0
ID
CF_ARTICLE
LINE
3217
RAW_TRACE
at cfArticle2ecfc1291681887$funcREFERENCESDTD1._factor151(G:\www\publishha\app\modules\journal\Article.cfc:3217)
TEMPLATE
G:\www\publishha\app\modules\journal\Article.cfc
TYPE
CFML
12
struct
COLUMN
0
ID
CF_ARTICLE
LINE
3216
RAW_TRACE
at cfArticle2ecfc1291681887$funcREFERENCESDTD1.runFunction(G:\www\publishha\app\modules\journal\Article.cfc:3216)
TEMPLATE
G:\www\publishha\app\modules\journal\Article.cfc
TYPE
CFML
13
struct
COLUMN
0
ID
CF_TEMPLATEPROXY
LINE
2938
RAW_TRACE
at cfArticle2ecfc1291681887$funcBACKSECTIONSDTD1.runFunction(G:\www\publishha\app\modules\journal\Article.cfc:2938)
TEMPLATE
G:\www\publishha\app\modules\journal\Article.cfc
TYPE
CFML
14
struct
COLUMN
0
ID
CF_TEMPLATEPROXY
LINE
146
RAW_TRACE
at cfgenArticleContent2ecfm782833447._factor5(G:\www\publishha\app\views\journal\generator\genArticleContent.cfm:146)
TEMPLATE
G:\www\publishha\app\views\journal\generator\genArticleContent.cfm
TYPE
CFML
15
struct
COLUMN
0
ID
CF_GENARTICLECONTENT
LINE
1
RAW_TRACE
at cfgenArticleContent2ecfm782833447._factor6(G:\www\publishha\app\views\journal\generator\genArticleContent.cfm:1)
TEMPLATE
G:\www\publishha\app\views\journal\generator\genArticleContent.cfm
TYPE
CFML
16
struct
COLUMN
0
ID
CF_GENARTICLECONTENT
LINE
1
RAW_TRACE
at cfgenArticleContent2ecfm782833447.runPage(G:\www\publishha\app\views\journal\generator\genArticleContent.cfm:1)
TEMPLATE
G:\www\publishha\app\views\journal\generator\genArticleContent.cfm
TYPE
CFML
17
struct
COLUMN
0
ID
CFINCLUDE
LINE
10
RAW_TRACE
at cfStaticPageLayout2ecfm1426351739.runPage(G:\www\publishha\app\views\layout\StaticPageLayout.cfm:10)
TEMPLATE
G:\www\publishha\app\views\layout\StaticPageLayout.cfm
TYPE
CFML
18
struct
COLUMN
0
ID
CFINCLUDE
LINE
30
RAW_TRACE
at cfCacheController2ecfc639388092$funcRENDERLAYOUT.runFunction(G:\www\publishha\app\controller\CacheController.cfc:30)
TEMPLATE
G:\www\publishha\app\controller\CacheController.cfc
TYPE
CFML
19
struct
COLUMN
0
ID
CF_UDFMETHOD
LINE
241
RAW_TRACE
at cfCacheController2ecfc639388092$funcGENARTICLECONTENT.runFunction(G:\www\publishha\app\controller\CacheController.cfc:241)
TEMPLATE
G:\www\publishha\app\controller\CacheController.cfc
TYPE
CFML
20
struct
COLUMN
0
ID
CF_UDFMETHOD
LINE
327
RAW_TRACE
at cfCacheController2ecfc639388092$funcGENARTICLE.runFunction(G:\www\publishha\app\controller\CacheController.cfc:327)
TEMPLATE
G:\www\publishha\app\controller\CacheController.cfc
TYPE
CFML
21
struct
COLUMN
0
ID
CF_UDFMETHOD
LINE
39
RAW_TRACE
at cfCacheController2ecfc639388092$funcGENCACHE.runFunction(G:\www\publishha\app\controller\CacheController.cfc:39)
TEMPLATE
G:\www\publishha\app\controller\CacheController.cfc
TYPE
CFML
22
struct
COLUMN
0
ID
CF_CFPAGE
LINE
634
RAW_TRACE
at cfPublishingApp2ecfc536529069$funcPROCESSREQUEST.runFunction(G:\www\publishha\app\PublishingApp.cfc:634)
TEMPLATE
G:\www\publishha\app\PublishingApp.cfc
TYPE
CFML
23
struct
COLUMN
0
ID
CF_TEMPLATEPROXY
LINE
16
RAW_TRACE
at cfBootstrap2ecfc660975501$funcHANDLEREQUEST.runFunction(G:\www\publishha\app\Bootstrap.cfc:16)
TEMPLATE
G:\www\publishha\app\Bootstrap.cfc
TYPE
CFML
24
struct
COLUMN
0
ID
CF_TEMPLATEPROXY
LINE
18
RAW_TRACE
at cfApplication2ecfc757760907$funcONREQUESTSTART.runFunction(G:\www\publishha\webroot\Application.cfc:18)
TEMPLATE
G:\www\publishha\webroot\Application.cfc
TYPE
CFML
Murtagh,
T. 1989, IrAJ, 19, 17
An error has occurred in (ref id="R14").
Variable LPAGE is undefined. [empty string]
array
1
struct
COLUMN
0
ID
??
LINE
243
RAW_TRACE
at cfincludeJournalRef_B2ecfm1510229986._factor10(G:\www\publishha\app\views\journal\includeJournalRef_B.cfm:243)
TEMPLATE
G:\www\publishha\app\views\journal\includeJournalRef_B.cfm
TYPE
CFML
2
struct
COLUMN
0
ID
CF_INCLUDEJOURNALREF_B
LINE
180
RAW_TRACE
at cfincludeJournalRef_B2ecfm1510229986._factor12(G:\www\publishha\app\views\journal\includeJournalRef_B.cfm:180)
TEMPLATE
G:\www\publishha\app\views\journal\includeJournalRef_B.cfm
TYPE
CFML
3
struct
COLUMN
0
ID
CF_INCLUDEJOURNALREF_B
LINE
177
RAW_TRACE
at cfincludeJournalRef_B2ecfm1510229986._factor13(G:\www\publishha\app\views\journal\includeJournalRef_B.cfm:177)
TEMPLATE
G:\www\publishha\app\views\journal\includeJournalRef_B.cfm
TYPE
CFML
4
struct
COLUMN
0
ID
CF_INCLUDEJOURNALREF_B
LINE
176
RAW_TRACE
at cfincludeJournalRef_B2ecfm1510229986._factor14(G:\www\publishha\app\views\journal\includeJournalRef_B.cfm:176)
TEMPLATE
G:\www\publishha\app\views\journal\includeJournalRef_B.cfm
TYPE
CFML
5
struct
COLUMN
0
ID
CF_INCLUDEJOURNALREF_B
LINE
170
RAW_TRACE
at cfincludeJournalRef_B2ecfm1510229986._factor40(G:\www\publishha\app\views\journal\includeJournalRef_B.cfm:170)
TEMPLATE
G:\www\publishha\app\views\journal\includeJournalRef_B.cfm
TYPE
CFML
6
struct
COLUMN
0
ID
CF_INCLUDEJOURNALREF_B
LINE
15
RAW_TRACE
at cfincludeJournalRef_B2ecfm1510229986._factor41(G:\www\publishha\app\views\journal\includeJournalRef_B.cfm:15)
TEMPLATE
G:\www\publishha\app\views\journal\includeJournalRef_B.cfm
TYPE
CFML
7
struct
COLUMN
0
ID
CF_INCLUDEJOURNALREF_B
LINE
12
RAW_TRACE
at cfincludeJournalRef_B2ecfm1510229986._factor42(G:\www\publishha\app\views\journal\includeJournalRef_B.cfm:12)
TEMPLATE
G:\www\publishha\app\views\journal\includeJournalRef_B.cfm
TYPE
CFML
8
struct
COLUMN
0
ID
CF_INCLUDEJOURNALREF_B
LINE
11
RAW_TRACE
at cfincludeJournalRef_B2ecfm1510229986._factor43(G:\www\publishha\app\views\journal\includeJournalRef_B.cfm:11)
TEMPLATE
G:\www\publishha\app\views\journal\includeJournalRef_B.cfm
TYPE
CFML
9
struct
COLUMN
0
ID
CF_INCLUDEJOURNALREF_B
LINE
1
RAW_TRACE
at cfincludeJournalRef_B2ecfm1510229986.runPage(G:\www\publishha\app\views\journal\includeJournalRef_B.cfm:1)
TEMPLATE
G:\www\publishha\app\views\journal\includeJournalRef_B.cfm
TYPE
CFML
10
struct
COLUMN
0
ID
CFINCLUDE
LINE
3230
RAW_TRACE
at cfArticle2ecfc1291681887$funcREFERENCESDTD1._factor150(G:\www\publishha\app\modules\journal\Article.cfc:3230)
TEMPLATE
G:\www\publishha\app\modules\journal\Article.cfc
TYPE
CFML
11
struct
COLUMN
0
ID
CF_ARTICLE
LINE
3217
RAW_TRACE
at cfArticle2ecfc1291681887$funcREFERENCESDTD1._factor151(G:\www\publishha\app\modules\journal\Article.cfc:3217)
TEMPLATE
G:\www\publishha\app\modules\journal\Article.cfc
TYPE
CFML
12
struct
COLUMN
0
ID
CF_ARTICLE
LINE
3216
RAW_TRACE
at cfArticle2ecfc1291681887$funcREFERENCESDTD1.runFunction(G:\www\publishha\app\modules\journal\Article.cfc:3216)
TEMPLATE
G:\www\publishha\app\modules\journal\Article.cfc
TYPE
CFML
13
struct
COLUMN
0
ID
CF_TEMPLATEPROXY
LINE
2938
RAW_TRACE
at cfArticle2ecfc1291681887$funcBACKSECTIONSDTD1.runFunction(G:\www\publishha\app\modules\journal\Article.cfc:2938)
TEMPLATE
G:\www\publishha\app\modules\journal\Article.cfc
TYPE
CFML
14
struct
COLUMN
0
ID
CF_TEMPLATEPROXY
LINE
146
RAW_TRACE
at cfgenArticleContent2ecfm782833447._factor5(G:\www\publishha\app\views\journal\generator\genArticleContent.cfm:146)
TEMPLATE
G:\www\publishha\app\views\journal\generator\genArticleContent.cfm
TYPE
CFML
15
struct
COLUMN
0
ID
CF_GENARTICLECONTENT
LINE
1
RAW_TRACE
at cfgenArticleContent2ecfm782833447._factor6(G:\www\publishha\app\views\journal\generator\genArticleContent.cfm:1)
TEMPLATE
G:\www\publishha\app\views\journal\generator\genArticleContent.cfm
TYPE
CFML
16
struct
COLUMN
0
ID
CF_GENARTICLECONTENT
LINE
1
RAW_TRACE
at cfgenArticleContent2ecfm782833447.runPage(G:\www\publishha\app\views\journal\generator\genArticleContent.cfm:1)
TEMPLATE
G:\www\publishha\app\views\journal\generator\genArticleContent.cfm
TYPE
CFML
17
struct
COLUMN
0
ID
CFINCLUDE
LINE
10
RAW_TRACE
at cfStaticPageLayout2ecfm1426351739.runPage(G:\www\publishha\app\views\layout\StaticPageLayout.cfm:10)
TEMPLATE
G:\www\publishha\app\views\layout\StaticPageLayout.cfm
TYPE
CFML
18
struct
COLUMN
0
ID
CFINCLUDE
LINE
30
RAW_TRACE
at cfCacheController2ecfc639388092$funcRENDERLAYOUT.runFunction(G:\www\publishha\app\controller\CacheController.cfc:30)
TEMPLATE
G:\www\publishha\app\controller\CacheController.cfc
TYPE
CFML
19
struct
COLUMN
0
ID
CF_UDFMETHOD
LINE
241
RAW_TRACE
at cfCacheController2ecfc639388092$funcGENARTICLECONTENT.runFunction(G:\www\publishha\app\controller\CacheController.cfc:241)
TEMPLATE
G:\www\publishha\app\controller\CacheController.cfc
TYPE
CFML
20
struct
COLUMN
0
ID
CF_UDFMETHOD
LINE
327
RAW_TRACE
at cfCacheController2ecfc639388092$funcGENARTICLE.runFunction(G:\www\publishha\app\controller\CacheController.cfc:327)
TEMPLATE
G:\www\publishha\app\controller\CacheController.cfc
TYPE
CFML
21
struct
COLUMN
0
ID
CF_UDFMETHOD
LINE
39
RAW_TRACE
at cfCacheController2ecfc639388092$funcGENCACHE.runFunction(G:\www\publishha\app\controller\CacheController.cfc:39)
TEMPLATE
G:\www\publishha\app\controller\CacheController.cfc
TYPE
CFML
22
struct
COLUMN
0
ID
CF_CFPAGE
LINE
634
RAW_TRACE
at cfPublishingApp2ecfc536529069$funcPROCESSREQUEST.runFunction(G:\www\publishha\app\PublishingApp.cfc:634)
TEMPLATE
G:\www\publishha\app\PublishingApp.cfc
TYPE
CFML
23
struct
COLUMN
0
ID
CF_TEMPLATEPROXY
LINE
16
RAW_TRACE
at cfBootstrap2ecfc660975501$funcHANDLEREQUEST.runFunction(G:\www\publishha\app\Bootstrap.cfc:16)
TEMPLATE
G:\www\publishha\app\Bootstrap.cfc
TYPE
CFML
24
struct
COLUMN
0
ID
CF_TEMPLATEPROXY
LINE
18
RAW_TRACE
at cfApplication2ecfc757760907$funcONREQUESTSTART.runFunction(G:\www\publishha\webroot\Application.cfc:18)
TEMPLATE
G:\www\publishha\webroot\Application.cfc
TYPE
CFML
Oosterloo,
T. 1995, PASA, 12, 215
An error has occurred in (ref id="R16").
Variable LPAGE is undefined. [empty string]
array
1
struct
COLUMN
0
ID
??
LINE
243
RAW_TRACE
at cfincludeJournalRef_B2ecfm1510229986._factor10(G:\www\publishha\app\views\journal\includeJournalRef_B.cfm:243)
TEMPLATE
G:\www\publishha\app\views\journal\includeJournalRef_B.cfm
TYPE
CFML
2
struct
COLUMN
0
ID
CF_INCLUDEJOURNALREF_B
LINE
180
RAW_TRACE
at cfincludeJournalRef_B2ecfm1510229986._factor12(G:\www\publishha\app\views\journal\includeJournalRef_B.cfm:180)
TEMPLATE
G:\www\publishha\app\views\journal\includeJournalRef_B.cfm
TYPE
CFML
3
struct
COLUMN
0
ID
CF_INCLUDEJOURNALREF_B
LINE
177
RAW_TRACE
at cfincludeJournalRef_B2ecfm1510229986._factor13(G:\www\publishha\app\views\journal\includeJournalRef_B.cfm:177)
TEMPLATE
G:\www\publishha\app\views\journal\includeJournalRef_B.cfm
TYPE
CFML
4
struct
COLUMN
0
ID
CF_INCLUDEJOURNALREF_B
LINE
176
RAW_TRACE
at cfincludeJournalRef_B2ecfm1510229986._factor14(G:\www\publishha\app\views\journal\includeJournalRef_B.cfm:176)
TEMPLATE
G:\www\publishha\app\views\journal\includeJournalRef_B.cfm
TYPE
CFML
5
struct
COLUMN
0
ID
CF_INCLUDEJOURNALREF_B
LINE
170
RAW_TRACE
at cfincludeJournalRef_B2ecfm1510229986._factor40(G:\www\publishha\app\views\journal\includeJournalRef_B.cfm:170)
TEMPLATE
G:\www\publishha\app\views\journal\includeJournalRef_B.cfm
TYPE
CFML
6
struct
COLUMN
0
ID
CF_INCLUDEJOURNALREF_B
LINE
15
RAW_TRACE
at cfincludeJournalRef_B2ecfm1510229986._factor41(G:\www\publishha\app\views\journal\includeJournalRef_B.cfm:15)
TEMPLATE
G:\www\publishha\app\views\journal\includeJournalRef_B.cfm
TYPE
CFML
7
struct
COLUMN
0
ID
CF_INCLUDEJOURNALREF_B
LINE
12
RAW_TRACE
at cfincludeJournalRef_B2ecfm1510229986._factor42(G:\www\publishha\app\views\journal\includeJournalRef_B.cfm:12)
TEMPLATE
G:\www\publishha\app\views\journal\includeJournalRef_B.cfm
TYPE
CFML
8
struct
COLUMN
0
ID
CF_INCLUDEJOURNALREF_B
LINE
11
RAW_TRACE
at cfincludeJournalRef_B2ecfm1510229986._factor43(G:\www\publishha\app\views\journal\includeJournalRef_B.cfm:11)
TEMPLATE
G:\www\publishha\app\views\journal\includeJournalRef_B.cfm
TYPE
CFML
9
struct
COLUMN
0
ID
CF_INCLUDEJOURNALREF_B
LINE
1
RAW_TRACE
at cfincludeJournalRef_B2ecfm1510229986.runPage(G:\www\publishha\app\views\journal\includeJournalRef_B.cfm:1)
TEMPLATE
G:\www\publishha\app\views\journal\includeJournalRef_B.cfm
TYPE
CFML
10
struct
COLUMN
0
ID
CFINCLUDE
LINE
3230
RAW_TRACE
at cfArticle2ecfc1291681887$funcREFERENCESDTD1._factor150(G:\www\publishha\app\modules\journal\Article.cfc:3230)
TEMPLATE
G:\www\publishha\app\modules\journal\Article.cfc
TYPE
CFML
11
struct
COLUMN
0
ID
CF_ARTICLE
LINE
3217
RAW_TRACE
at cfArticle2ecfc1291681887$funcREFERENCESDTD1._factor151(G:\www\publishha\app\modules\journal\Article.cfc:3217)
TEMPLATE
G:\www\publishha\app\modules\journal\Article.cfc
TYPE
CFML
12
struct
COLUMN
0
ID
CF_ARTICLE
LINE
3216
RAW_TRACE
at cfArticle2ecfc1291681887$funcREFERENCESDTD1.runFunction(G:\www\publishha\app\modules\journal\Article.cfc:3216)
TEMPLATE
G:\www\publishha\app\modules\journal\Article.cfc
TYPE
CFML
13
struct
COLUMN
0
ID
CF_TEMPLATEPROXY
LINE
2938
RAW_TRACE
at cfArticle2ecfc1291681887$funcBACKSECTIONSDTD1.runFunction(G:\www\publishha\app\modules\journal\Article.cfc:2938)
TEMPLATE
G:\www\publishha\app\modules\journal\Article.cfc
TYPE
CFML
14
struct
COLUMN
0
ID
CF_TEMPLATEPROXY
LINE
146
RAW_TRACE
at cfgenArticleContent2ecfm782833447._factor5(G:\www\publishha\app\views\journal\generator\genArticleContent.cfm:146)
TEMPLATE
G:\www\publishha\app\views\journal\generator\genArticleContent.cfm
TYPE
CFML
15
struct
COLUMN
0
ID
CF_GENARTICLECONTENT
LINE
1
RAW_TRACE
at cfgenArticleContent2ecfm782833447._factor6(G:\www\publishha\app\views\journal\generator\genArticleContent.cfm:1)
TEMPLATE
G:\www\publishha\app\views\journal\generator\genArticleContent.cfm
TYPE
CFML
16
struct
COLUMN
0
ID
CF_GENARTICLECONTENT
LINE
1
RAW_TRACE
at cfgenArticleContent2ecfm782833447.runPage(G:\www\publishha\app\views\journal\generator\genArticleContent.cfm:1)
TEMPLATE
G:\www\publishha\app\views\journal\generator\genArticleContent.cfm
TYPE
CFML
17
struct
COLUMN
0
ID
CFINCLUDE
LINE
10
RAW_TRACE
at cfStaticPageLayout2ecfm1426351739.runPage(G:\www\publishha\app\views\layout\StaticPageLayout.cfm:10)
TEMPLATE
G:\www\publishha\app\views\layout\StaticPageLayout.cfm
TYPE
CFML
18
struct
COLUMN
0
ID
CFINCLUDE
LINE
30
RAW_TRACE
at cfCacheController2ecfc639388092$funcRENDERLAYOUT.runFunction(G:\www\publishha\app\controller\CacheController.cfc:30)
TEMPLATE
G:\www\publishha\app\controller\CacheController.cfc
TYPE
CFML
19
struct
COLUMN
0
ID
CF_UDFMETHOD
LINE
241
RAW_TRACE
at cfCacheController2ecfc639388092$funcGENARTICLECONTENT.runFunction(G:\www\publishha\app\controller\CacheController.cfc:241)
TEMPLATE
G:\www\publishha\app\controller\CacheController.cfc
TYPE
CFML
20
struct
COLUMN
0
ID
CF_UDFMETHOD
LINE
327
RAW_TRACE
at cfCacheController2ecfc639388092$funcGENARTICLE.runFunction(G:\www\publishha\app\controller\CacheController.cfc:327)
TEMPLATE
G:\www\publishha\app\controller\CacheController.cfc
TYPE
CFML
21
struct
COLUMN
0
ID
CF_UDFMETHOD
LINE
39
RAW_TRACE
at cfCacheController2ecfc639388092$funcGENCACHE.runFunction(G:\www\publishha\app\controller\CacheController.cfc:39)
TEMPLATE
G:\www\publishha\app\controller\CacheController.cfc
TYPE
CFML
22
struct
COLUMN
0
ID
CF_CFPAGE
LINE
634
RAW_TRACE
at cfPublishingApp2ecfc536529069$funcPROCESSREQUEST.runFunction(G:\www\publishha\app\PublishingApp.cfc:634)
TEMPLATE
G:\www\publishha\app\PublishingApp.cfc
TYPE
CFML
23
struct
COLUMN
0
ID
CF_TEMPLATEPROXY
LINE
16
RAW_TRACE
at cfBootstrap2ecfc660975501$funcHANDLEREQUEST.runFunction(G:\www\publishha\app\Bootstrap.cfc:16)
TEMPLATE
G:\www\publishha\app\Bootstrap.cfc
TYPE
CFML
24
struct
COLUMN
0
ID
CF_TEMPLATEPROXY
LINE
18
RAW_TRACE
at cfApplication2ecfc757760907$funcONREQUESTSTART.runFunction(G:\www\publishha\webroot\Application.cfc:18)
TEMPLATE
G:\www\publishha\webroot\Application.cfc
TYPE
CFML
Verwichte,
E., & Galsgaard,
K. 1998, SoPh, 183, 445
An error has occurred in (ref id="R22").
Variable LPAGE is undefined. [empty string]
array
1
struct
COLUMN
0
ID
??
LINE
243
RAW_TRACE
at cfincludeJournalRef_B2ecfm1510229986._factor10(G:\www\publishha\app\views\journal\includeJournalRef_B.cfm:243)
TEMPLATE
G:\www\publishha\app\views\journal\includeJournalRef_B.cfm
TYPE
CFML
2
struct
COLUMN
0
ID
CF_INCLUDEJOURNALREF_B
LINE
180
RAW_TRACE
at cfincludeJournalRef_B2ecfm1510229986._factor12(G:\www\publishha\app\views\journal\includeJournalRef_B.cfm:180)
TEMPLATE
G:\www\publishha\app\views\journal\includeJournalRef_B.cfm
TYPE
CFML
3
struct
COLUMN
0
ID
CF_INCLUDEJOURNALREF_B
LINE
177
RAW_TRACE
at cfincludeJournalRef_B2ecfm1510229986._factor13(G:\www\publishha\app\views\journal\includeJournalRef_B.cfm:177)
TEMPLATE
G:\www\publishha\app\views\journal\includeJournalRef_B.cfm
TYPE
CFML
4
struct
COLUMN
0
ID
CF_INCLUDEJOURNALREF_B
LINE
176
RAW_TRACE
at cfincludeJournalRef_B2ecfm1510229986._factor14(G:\www\publishha\app\views\journal\includeJournalRef_B.cfm:176)
TEMPLATE
G:\www\publishha\app\views\journal\includeJournalRef_B.cfm
TYPE
CFML
5
struct
COLUMN
0
ID
CF_INCLUDEJOURNALREF_B
LINE
170
RAW_TRACE
at cfincludeJournalRef_B2ecfm1510229986._factor40(G:\www\publishha\app\views\journal\includeJournalRef_B.cfm:170)
TEMPLATE
G:\www\publishha\app\views\journal\includeJournalRef_B.cfm
TYPE
CFML
6
struct
COLUMN
0
ID
CF_INCLUDEJOURNALREF_B
LINE
15
RAW_TRACE
at cfincludeJournalRef_B2ecfm1510229986._factor41(G:\www\publishha\app\views\journal\includeJournalRef_B.cfm:15)
TEMPLATE
G:\www\publishha\app\views\journal\includeJournalRef_B.cfm
TYPE
CFML
7
struct
COLUMN
0
ID
CF_INCLUDEJOURNALREF_B
LINE
12
RAW_TRACE
at cfincludeJournalRef_B2ecfm1510229986._factor42(G:\www\publishha\app\views\journal\includeJournalRef_B.cfm:12)
TEMPLATE
G:\www\publishha\app\views\journal\includeJournalRef_B.cfm
TYPE
CFML
8
struct
COLUMN
0
ID
CF_INCLUDEJOURNALREF_B
LINE
11
RAW_TRACE
at cfincludeJournalRef_B2ecfm1510229986._factor43(G:\www\publishha\app\views\journal\includeJournalRef_B.cfm:11)
TEMPLATE
G:\www\publishha\app\views\journal\includeJournalRef_B.cfm
TYPE
CFML
9
struct
COLUMN
0
ID
CF_INCLUDEJOURNALREF_B
LINE
1
RAW_TRACE
at cfincludeJournalRef_B2ecfm1510229986.runPage(G:\www\publishha\app\views\journal\includeJournalRef_B.cfm:1)
TEMPLATE
G:\www\publishha\app\views\journal\includeJournalRef_B.cfm
TYPE
CFML
10
struct
COLUMN
0
ID
CFINCLUDE
LINE
3230
RAW_TRACE
at cfArticle2ecfc1291681887$funcREFERENCESDTD1._factor150(G:\www\publishha\app\modules\journal\Article.cfc:3230)
TEMPLATE
G:\www\publishha\app\modules\journal\Article.cfc
TYPE
CFML
11
struct
COLUMN
0
ID
CF_ARTICLE
LINE
3217
RAW_TRACE
at cfArticle2ecfc1291681887$funcREFERENCESDTD1._factor151(G:\www\publishha\app\modules\journal\Article.cfc:3217)
TEMPLATE
G:\www\publishha\app\modules\journal\Article.cfc
TYPE
CFML
12
struct
COLUMN
0
ID
CF_ARTICLE
LINE
3216
RAW_TRACE
at cfArticle2ecfc1291681887$funcREFERENCESDTD1.runFunction(G:\www\publishha\app\modules\journal\Article.cfc:3216)
TEMPLATE
G:\www\publishha\app\modules\journal\Article.cfc
TYPE
CFML
13
struct
COLUMN
0
ID
CF_TEMPLATEPROXY
LINE
2938
RAW_TRACE
at cfArticle2ecfc1291681887$funcBACKSECTIONSDTD1.runFunction(G:\www\publishha\app\modules\journal\Article.cfc:2938)
TEMPLATE
G:\www\publishha\app\modules\journal\Article.cfc
TYPE
CFML
14
struct
COLUMN
0
ID
CF_TEMPLATEPROXY
LINE
146
RAW_TRACE
at cfgenArticleContent2ecfm782833447._factor5(G:\www\publishha\app\views\journal\generator\genArticleContent.cfm:146)
TEMPLATE
G:\www\publishha\app\views\journal\generator\genArticleContent.cfm
TYPE
CFML
15
struct
COLUMN
0
ID
CF_GENARTICLECONTENT
LINE
1
RAW_TRACE
at cfgenArticleContent2ecfm782833447._factor6(G:\www\publishha\app\views\journal\generator\genArticleContent.cfm:1)
TEMPLATE
G:\www\publishha\app\views\journal\generator\genArticleContent.cfm
TYPE
CFML
16
struct
COLUMN
0
ID
CF_GENARTICLECONTENT
LINE
1
RAW_TRACE
at cfgenArticleContent2ecfm782833447.runPage(G:\www\publishha\app\views\journal\generator\genArticleContent.cfm:1)
TEMPLATE
G:\www\publishha\app\views\journal\generator\genArticleContent.cfm
TYPE
CFML
17
struct
COLUMN
0
ID
CFINCLUDE
LINE
10
RAW_TRACE
at cfStaticPageLayout2ecfm1426351739.runPage(G:\www\publishha\app\views\layout\StaticPageLayout.cfm:10)
TEMPLATE
G:\www\publishha\app\views\layout\StaticPageLayout.cfm
TYPE
CFML
18
struct
COLUMN
0
ID
CFINCLUDE
LINE
30
RAW_TRACE
at cfCacheController2ecfc639388092$funcRENDERLAYOUT.runFunction(G:\www\publishha\app\controller\CacheController.cfc:30)
TEMPLATE
G:\www\publishha\app\controller\CacheController.cfc
TYPE
CFML
19
struct
COLUMN
0
ID
CF_UDFMETHOD
LINE
241
RAW_TRACE
at cfCacheController2ecfc639388092$funcGENARTICLECONTENT.runFunction(G:\www\publishha\app\controller\CacheController.cfc:241)
TEMPLATE
G:\www\publishha\app\controller\CacheController.cfc
TYPE
CFML
20
struct
COLUMN
0
ID
CF_UDFMETHOD
LINE
327
RAW_TRACE
at cfCacheController2ecfc639388092$funcGENARTICLE.runFunction(G:\www\publishha\app\controller\CacheController.cfc:327)
TEMPLATE
G:\www\publishha\app\controller\CacheController.cfc
TYPE
CFML
21
struct
COLUMN
0
ID
CF_UDFMETHOD
LINE
39
RAW_TRACE
at cfCacheController2ecfc639388092$funcGENCACHE.runFunction(G:\www\publishha\app\controller\CacheController.cfc:39)
TEMPLATE
G:\www\publishha\app\controller\CacheController.cfc
TYPE
CFML
22
struct
COLUMN
0
ID
CF_CFPAGE
LINE
634
RAW_TRACE
at cfPublishingApp2ecfc536529069$funcPROCESSREQUEST.runFunction(G:\www\publishha\app\PublishingApp.cfc:634)
TEMPLATE
G:\www\publishha\app\PublishingApp.cfc
TYPE
CFML
23
struct
COLUMN
0
ID
CF_TEMPLATEPROXY
LINE
16
RAW_TRACE
at cfBootstrap2ecfc660975501$funcHANDLEREQUEST.runFunction(G:\www\publishha\app\Bootstrap.cfc:16)
TEMPLATE
G:\www\publishha\app\Bootstrap.cfc
TYPE
CFML
24
struct
COLUMN
0
ID
CF_TEMPLATEPROXY
LINE
18
RAW_TRACE
at cfApplication2ecfc757760907$funcONREQUESTSTART.runFunction(G:\www\publishha\webroot\Application.cfc:18)
TEMPLATE
G:\www\publishha\webroot\Application.cfc
TYPE
CFML
1 For example improved polygon drawing rates and onboard memory on graphics cards.
2 For example significant reductions in cost, increasing brightness, resolution and dynamic range, and broad product availability.
3 The favoured XGA resolution is partly controlled by the growing home theatre market, as this is most compatible with the PAL, NTSC, and High Definition television standards. At the time of writing, advances in digital cinema are leading to projectors with resolutions of 4096 × 2160 pixels, but at very high cost.
4 In our initial testing, we found that the preferred 128-pixel overlap was not sufficient. Powers of two in overlap size are not critical, but they simplify the programming model using OpenGL textures.
5 Consider the Mercator projection common for maps of the Earth. This mapping of the spherical Earth to a 2D surface does not preserve area, so that polar countries like Greenland appear highly distorted.
6 For example, Evans & Sutherland, Konica Minolta, Silicon Graphics, Sky-Skan, and Spitz.
7 Note that this is the size of square dome frames — the actual projected area is a maximally inscribed circle, so that ≈21.5% of pixels are unused.
8 www.elumenati.com
9 We have performed some initial experiments with various metallic paints to create a low-cost polarization-preserving surface. Although the image gain is lower, and cross-talk is higher than for commercial screens, a 3D image is visible.
10 www.sgi.com/products/visualization/realitycenter
11 The construction of the Virtual Room at the Melbourne Museum was funded by a Victorian State Government through the Science & Technology Initiative (STI) grant scheme. It represents a collaboration between Swinburne University of Technology, Royal Melbourne Institute of Technology, Monash University, Museum Victoria, Adacel Technologies, and the University of Melbourne. See www.vroom.org.au
12 At the time of writing, there were about 440 ASA members. See asa.astronomy.org.au/asa.html
13 www.astro.caltech.edu/∼tjp/pgplot/
14 Some advanced displays are not appropriate for all users. For example, stereoscopic 3D displays are not very useful for the 10% of the population who do not have binocular vision. Headaches can arise from overuse of particular techniques, especially when the eyes are forced to focus in an unnatural manner for extended periods of time. For further comments on this issue, see Rots (1986).
15 niri.ncsa.uiuc.edu/partiview/