

Near-Infrared Properties of Type Ia Supernovae
M. M. PhillipsLas Campanas Observatory, Carnegie Observatories, Casilla 601, La Serena, Chile. Email: mmp@lco.cl
Publications of the Astronomical Society of Australia 29(4) 434-446 https://doi.org/10.1071/AS11056
Submitted: 30 September 2011 Accepted: 15 November 2012 Published: 28 February 2012
Journal Compilation © Astronomical Society of Australia 2012
Abstract
The photometric properties of Type Ia supernovae (SNe Ia) in the near-infrared as garnered from observations made over the last 30 years are reviewed. During this period, light curves for more than 120 nearby SNe Ia have been published, revealing considerable homogeneity but also some fascinating differences. These data have confirmed that, for all but the fastest declining objects, SNe Ia are essentially perfect standard candles in the near-infrared, displaying only a slight dependence of peak luminosity on decline rate and color.
Keywords: supernovae: general — cosmology: observations
1 Introduction
Supernovae (SNe) were first grouped into two separate classes by Minkowski (1941) on the basis of the presence or absence of hydrogen lines in the spectrum. The majority of the SNe which lack hydrogen belong to a fascinating subclass of exploding stars now called ‘SNe Ia’. More than 50 years ago, it was understood that the high degree of homogeneity displayed by SNe Ia is due to the fact that they are the end result of the total thermonuclear disruption of a white dwarf in a close binary system (Hoyle & Fowler 1960). Nevertheless, our understanding of the nature of the progenitors and the details of the explosion mechanism(s) remains frustratingly sketchy. In spite of this, SNe Ia have played a fundamental role in the revolution in observational cosmology that has taken place since the early-1990s. Not only have observations of SNe Ia played a fundamental role in the determination of the Hubble constant to a precision of better than 5% (Riess et al. 2011), but they also led to the serendipitous discovery of dark energy (Riess et al. 1998; Perlmutter et al. 1999).
Investigations carried out since the late-1980s have demonstrated that SNe Ia are not perfectly homogenous. Rather, their successful utility as cosmological distance indicators at optical wavelengths rests on the discovery of an empirical correlation between the absolute magnitude at maximum light and the decline rate (or width) of the light curve (Phillips 1993). The sense of this correlation is that slower-evolving SNe Ia are intrinsically more luminous than faster-evolving ones, with the effect being largest in the blue where the total observed range in peak luminosity is ~2 mag (Hamuy et al. 1996a). The absolute magnitudes of SNe Ia are also correlated with color as would be expected if their light were extinguished by dust. However, the ratio of the total-to-selective extinction, RV, derived from the most-highly reddened SNe Ia is often found to be unusually low (RV ~ 1.5–2.1, see Krisciunas et al. 2007, and references therein), suggesting that the situation is more complex than simple dust reddening alone.
Until the first half of the 1980s, the near-infrared (NIR) properties of SNe Ia were largely unexplored. In a landmark paper, Elias et al. (1981) presented JHK photometry of the three nearby SNe Ia: 1980N and 1981D, both of which appeared in the Fornax cluster member NGC 1316 (Fornax A); and 1981B, which was hosted by NGC 4536 in the Virgo cluster. The light curves of all three SNe were remarkably similar and characterised by a distinctive double maximum.1 Attention was also called to the complexity of the J – H color evolution, which was interpreted as being due to the formation of a broad, transient absorption feature at ~1.2 μm during the phase of the light curve leading up to the second maximum. The dispersion in the absolute magnitudes of the three SNe was less than the uncertainties in the relative distances, prompting the authors to suggest that NIR light curves of SNe Ia might be useful for measuring distances within the local universe. This important paper was followed a few years later by a larger study (Elias et al. 1985) which included the first NIR Hubble diagram for SNe Ia.2 A dispersion of only 0.1–0.2 mag was found for a sample of six unambiguously-identified SNe Ia, reemphasising the potential utility of these objects as cosmological distance indicators.
In this paper, I review what has been learned about the NIR photometric properties of SNe Ia since the pivotal work of Elias and collaborators. Much of the paper concentrates on the NIR light curves of normal SNe Ia, what they tell us about the dust extinction in the line of sight when combined with optical photometry, and their use for determining precise distances. This is followed by a discussion of the nature of the fast-declining SN 1986G-like and SN 1991bg-like events as considered from the NIR perspective, and brief mention of the NIR properties of a few peculiar subgroups of SNe Ia. I have taken advantage of this review to highlight recent results from the Carnegie Supernova Project (CSP; Hamuy et al. 2006), some of which are as yet unpublished. For this I beg the reader's indulgence.
2 Near-Infrared Light Curves
During the 17 years following the publication of Elias et al. (1981), NIR photometry was obtained for only a few more SNe Ia. The contrast in luminosity of a SN Ia with respect to its host galaxy is typically less in the NIR than at optical wavelengths, and measuring the brightness of a SN immersed in the light of its host using the instrumentation available during these years, which generally employed single-element detectors, was a significant challenge. With one obvious exception, the data for the few SNe Ia observed were consistent with the light curves of the six SNe Ia presented by Elias et al. (1981, 1985), adding to the impression of a high level of homogeneity. The exception was SN 1986G, for which excellent photometry in JHK was obtained by Frogel et al. (1987) beginning five days before the epoch of B maximum. SN 1986G appeared in the dust lane of NGC 5128 (Centauras A) and was observed extensively at optical wavelengths, both photometrically and spectroscopically (Phillips et al. 1987; Cristiani et al. 1992). The B light curve declined from maximum much more rapidly than normal, and the spectroscopic evolution, while similar to that of slower-declining SNe Ia, displayed subtle differences at maximum light. Frogel et al. (1987) showed that the NIR light curves of SN 1986G were also significantly different from those of normal SNe Ia. In particular, the secondary maximum occurred ~15 days earlier than it does for normal SNe Ia, and appeared more as a shoulder rather than a distinct peak. In Section 3, I will return to discuss these fast-declining events in more detail.
The first pre-maximum JHK photometry of a normal SNe Ia was obtained for SN 1998bu by Jha et al. (1999) and Hernandez et al. (2000). These observations showed that maximum light in the NIR occurs approximately 5 days before the epoch of B maximum. Thus, in order to catch a SN Ia still on the rise in JHK, observations must begin typically 6–8 days before B maximum. This, along with the above-mentioned contrast issue between the brightness of the SN and its host, are the main drawbacks of observing SNe Ia in the NIR.
Between 2000 and 2004, the number of SNe Ia with NIR light curves tripled, owing in large part to a collaborative program of observations carried out at the Cerro Tololo Inter-American and Las Campanas Observatories in Chile (Krisciunas et al. 2001, 2003, 2004b, c) that was made possible by the development and accessibility of panoramic NIR detectors. With this larger sample and the improving quality and coverage of the observations, differences in light-curve morphology and colors now became evident even among normal SNe Ia. While most of these differences correlate with the B-band decline rate, evidence was clearly seen of variations in light-curve shape — particularly the strength of the secondary maximum — for SNe with the same decline rates (Krisciunas et al. 2001).
In recent years, NIR photometry of SNe Ia has become relatively commonplace. Two surveys in particular deserve special mention. The first of these is being carried out using the 1.3-m PARITEL at the F. L. Whipple Observatory at Mt. Hopkins, Arizona, and has resulted in the publication of JHKs light curves for 21 SNe Ia to date (Wood-Vasey et al. 2008). The second is the CSP, which employed the 1.0-m and 2.5-m telescopes at Las Campanas Observatory (LCO) between 2004–2009 to obtain YJH light curves (plus a small amount of Ks photometry) for ~100 SNe Ia. The NIR data for 70 of these have been published by Contreras et al. (2010) and Stritzinger et al. (2011). Extensive optical photometry was also obtained for both the PARITEL and CSP SNe, adding considerable extra value to these data sets.
2.1 General Properties
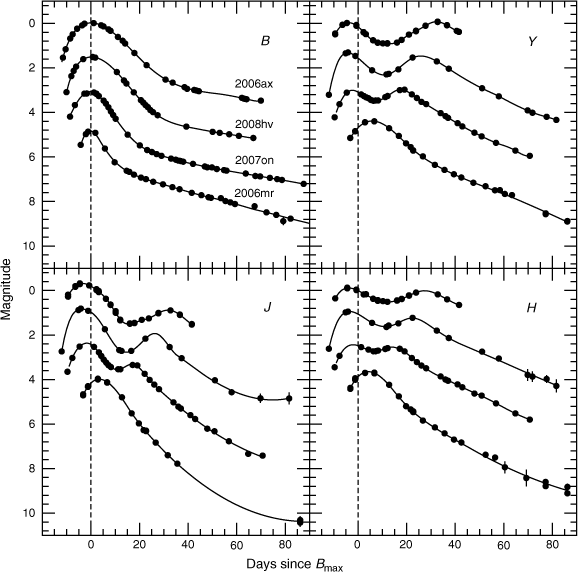
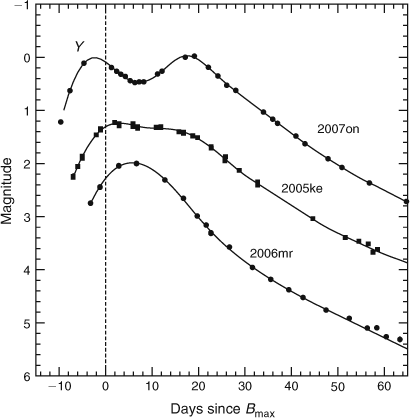
Figure 1 shows the BYJH light curves of four SNe Ia observed by the CSP that cover a range of decline rates. A commonly-used parameter for quantifying the decline rate is Δm15(B), which was defined by Phillips (1993) as the amount in magnitudes that the B light curve declines during the first 15 days after maximum light. In this paper, I will also use the closely-related parameter Δm15 employed by the SNooPy (SuperNovae in Object-Oriented Python) light-curve fitting package (Burns et al. 2011), which is derived from a fit to all the available photometry (uBgVriYJH in the case of the CSP observations) and not just the B light curve. The four SNe plotted in Figure 1 have Δm15 = 0.97 to 1.71, which covers most of the range of observed decline rates of SNe Ia.
As is apparent in Figure 1, the differences in decline rate reflect differences in the overall width of the rise and fall from B-band maximum. Indeed, this is the basis of the stretch method (Perlmutter 1997), which is a commonly-used alternative method of quantifying the luminosity-decline rate relationship. Also obvious in Figure 1 is the prominent secondary maximum observed in the NIR. Although visible from the I band through the K band, and seen as a shoulder in V and R, the secondary maximum reaches its maximum expression in Y and J. Interestingly, in both Y and H, the secondary maximum is typically as bright as (and sometimes even brighter than) the primary maximum. Figure 1 also illustrates that the time interval between the primary and secondary maxima decreases as a function of decline rate (or luminosity). Note that for most SNe Ia, primary maximum in the NIR occurs several days before the epoch of B maximum, but for some very fast-declining events (e.g. SN 2006mr in Figure 1), it can occur after B maximum (see also Section 3).
|
The origin of the secondary maximum in SNe Ia has been treated by several authors. Höflich, Khokhlov & Wheeler (1995) argued that the secondary maximum was a temperature–radius effect produced in models where the photospheric radius continues to increase well after maximum. Pinto & Eastman (2000) explained it as the release of trapped radiation due to a sudden decrease in the flux mean opacity when singly-ionised Fe becomes the dominant ion in the inner ejecta. From detailed radiative transfer models, Kasen (2006) confirmed that the secondary maximum is a direct consequence of the ionization evolution of the Fe-group elements and explored the dependence of its morphology on the physical properties of the ejecta.
Studies of I-band light curves (Hamuy et al. 1996b; Krisciunas et al. 2001; Folatelli et al. 2010) have shown that the strength of the secondary maximum in SNe Ia decreases as a function of decline rate (or luminosity), fading to invisibility in the very fastest-declining objects (see SN 2006mr in Figure 1). The models indicate that both the strength and timing of the secondary maximum are governed principally by the amount of radioactive 56Ni produced in the explosion (Höflich et al. 1995; Kasen 2006). Nevertheless, at a given decline rate, real differences are observed in the strength and morphology of the secondary maximum (Krisciunas et al. 2001; Folatelli et al. 2010) which may be attributable to secondary parameters such as the mixing into the ejecta of the 56Ni (Kasen 2006). These differences in the strength of the secondary maximum can provide valuable insight into the physics of the explosion mechanism, but at the same time represent a significant problem for template fitting in the IJHK bands by light-curve fitters such as SNooPy, where the strength of the secondary maximum is assumed to be a smoothly varying function of decline rate (Burns et al. 2011).
The nature of the striking depression at ~1.2 μm that develops during the phase of the light curve leading up to the second maximum sparked considerable discussion after attention was drawn to it by Elias et al. (1981).3 Although the rapidity with which the feature appeared and disappeared suggested to Elias et al. (1981) that it was produced by a single species, the correct explanation did not come until more than 10 years later when Spyromilio, Pinto & Eastman (1994) suggested that the broad ‘absorption’ was actually due to a lack of significant opacity at these wavelengths. Pinto & Eastman (2000) went on to show that, due to a shift to more neutral species after maximum light, the photosphere recedes rapidly to the center of the SN in the NIR. In effect, the NIR spectrum transforms into a broad-line emission nebula which happens to have no strong lines at 1.2 μm. This explanation was observationally confirmed by Hamuy et al. (2002), who obtained the first continuous sequence of NIR spectra of a SN Ia (1999ee).
Due to the observational difficulties, relatively little NIR photometry has been obtained of SNe Ia at epochs beyond three months past maximum. Elias & Frogel (1983) managed to obtain JHK measurements of SN 1981B at ~4.5 months after maximum, H observations of SN 1980N at ~7.5 months past maximum, and detected SN 1981D in J and H ~9 months after maximum. The H band data appeared to be consistent with a steady linear decline of ~0.013 mag day–1 from day +100 onwards. The Elias & Frogel (1983) observations were heroically obtained using a single-channel photometer, with substantial background corrections obtained by averaging measurements of the background host galaxy light near the SNe.
Fortunately, the advent of NIR arrays made late-epoch photometry considerably more feasible, and Spyromilio et al. (2004) were able to obtain solid detections of SN 1998bu in H at epochs of +250 and +344. These observations revealed that the SN flux had faded only slightly between the two epochs, and was considerably brighter than a decline rate of ~0.013 mag day–1 would have predicted. Around the same time, Sollerman et al. (2004) published J and H photometry of the spectroscopically-peculiar SN 2000cx at five epochs between +369 and +483 days, and a few years later Stritzinger & Sollerman (2007) presented JHK measurements of the normal SN 2001el obtained from +316 to +445 days. In both cases, the late-time NIR emission remained essentially constant. Such a flattening of the light curve at late epochs was argued by Sollerman et al. (2004) to be consistent with theoretical predictions of the gradual transition of the emission from the optical to the NIR as the ejecta expand and the temperature decreases. However, no evidence was seen of the ‘infrared catastrophe’ (IRC) predicted by Axelrod (1980), where most of the emission shifts from optical/NIR wavelengths to the mid- and far-IR fine-structure lines when the ejecta temperature falls below a certain threshold.
To date, the only fast-declining SN Ia observed at very late epochs is SN 2003hv (Δm15(B) ~ 1.6), for which ground- and space-based NIR photometry was acquired at phases from +344 to +786 days (Leloudas et al. 2009). At these epochs, the evolution of the NIR flux was again nearly flat. As was also observed for SNe 2000cx and 2001el, the relative contribution of the NIR bands to the total U-to-K luminosity increased steadily from a low of <5% at day +150 to nearly 40% by day +700. Interestingly, the derived 56Ni mass at late epochs was found to be significantly-less than the value at maximum light given by Arnett's law (Arnett 1982), implying that >40% of the total luminosity of the SN was being emitted in the mid- and far-infrared by day +500, suggesting that the IRC may actually have occurred in the densest portions of the ejecta by day +350. The recent discovery of SN 2011fe in M101 (Nugent et al. 2011), which reached V ~ 10 at maximum light, will provide the first ever opportunity to follow a normal SN Ia in the NIR, both photometrically and spectroscopically, to epochs of +3 years and beyond.
2.2 Dust Reddening
One of the most vexing problems in dealing with the light curves of SNe Ia is determining the extinction of the SN light due to dust in the interstellar medium of its host galaxy and/or the circumstellar environment of the progenitor system itself. Krisciunas et al. (2000) were the first to emphasise the advantage of combining optical and NIR photometry to estimate the visual extinction, AV, to a SN Ia. Since the extinction in the H band is 5.5-times less than in V, the color excess E(V – H) = AV – AH ≈ AV for all but the most highly reddened objects. The measurement of color excesses as a function of wavelength also provides invaluable information on the shape of the reddening curve.
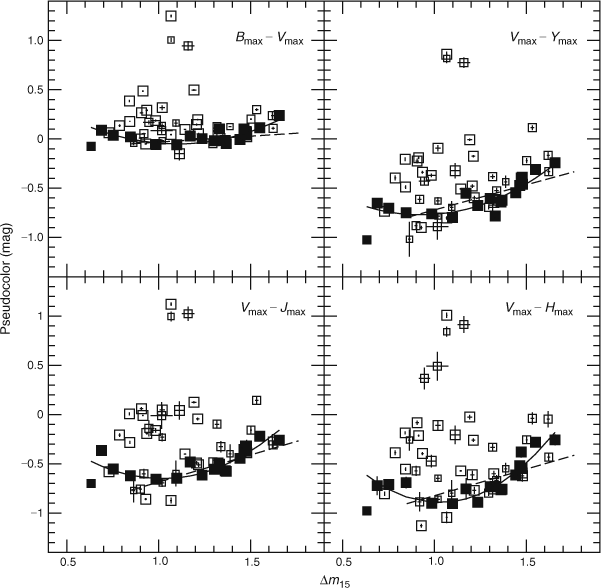
Figure 2 displays pseudocolors plotted versus decline rate for 59 SNe Ia observed by the CSP. The term `pseudocolor' is employed to stress the fact that these quantities do not represent the actual color of the SNe at any time but are just the difference between the magnitudes at maximum light of two bands, which occur at slightly different times. A blue edge to the distribution of pseudocolors is clearly visible in each of the panels of Figure 2. Indicated as solid symbols in the figure is a subsample of SNe which appear to have suffered little dust extinction as determined using the Lira relationship (for details, see Folatelli et al. 2010). As expected, this low-reddening subsample lies along the blue edge. Figure 2 displays the linear fits to the low-reddening SNe derived by Folatelli et al. (2010) from a smaller sample of CSP SNe Ia. The larger sample in Figure 2 suggests that the blue edge may actually be curved, and so second-order polynomial fits to the low-reddening subsample are also shown.
|
Figure 2 implies that the majority of SNe Ia do not suffer large amounts of dust extinction. This is consistent with previous studies which, under the assumption that the distribution of host extinction4 is well-described by an exponential, P(AV) ∝ exp(–AV/τV), where τV ~ 0.3–0.5 mag (Jha, Riess & Kirshner 2007; Kessler et al. 2009).
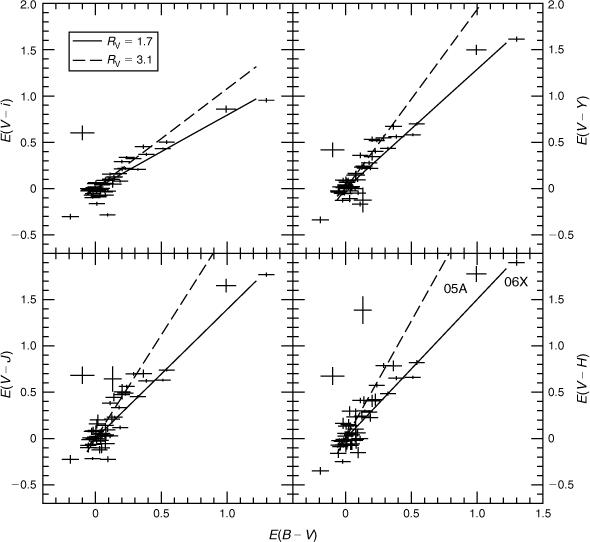
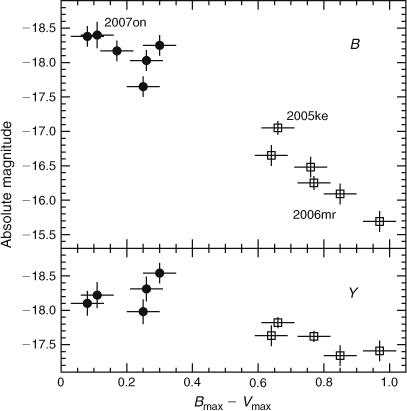
Assuming the distribution of SN colors seen in Figure 2 is due to dust extinction, then the vertical offset of each SN from the blue edge provides a measurement of its color excess. Figure 3 shows the resulting (V – NIR) color excesses, E(V – i), E(V – Y), E(V – J), and E(V – H), plotted versus E(B – V). The second-order polynomial fits shown in Figure 2 were used to define the blue edges. The diagonal lines in each panel of Figure 3 indicate the expected correlations of the color excesses for two different values of RV assuming the standard Galactic reddening law of Cardelli, Clayton, & Mathis (1989). The dashed line represents the canonical Galactic value of RV = 3.1, and the solid line corresponds to RV = 1.7.
|
While there are a few SNe which lie a considerable distance from either reddening line, the vast majority fall close to the cone defined by the two values of RV. Interestingly, six of the eight most highly reddened SNe fall close to the RV = 1.7 relation. A detailed analysis by Folatelli et al. (2010) of all of the CSP photometry (including the important u band) of two of these SNe, 2005A and 2006X, showed that their color excesses were well matched by the model of Goobar (2008) where multiple scattering of photons by circumstellar dust steepens the effective extinction law. Independent evidence for the existence of circumstellar material associated with SN 2006X was found by Patat et al. (2007), who observed short-term variations in the interstellar Na I D absorption lines during its early-time spectral evolution. Nevertheless, Figure 3 indicates that the color excesses of the majority of the SNe with E(B – V) < 0.3 are consistent with the standard Galactic value of RV ~ 3. A similar result was found recently by Folatelli et al. (2010), Mandel, Narayan & Kirshner (2011), and Chotard et al. (2011).
Figure 3 suggests that the reddening of SNe Ia arises from at least two different sources: most suffer only a small around of reddening consistent with the properties of interstellar dust in the Milky Way, while for the more highly-extinguished objects the reddening often appears to be produced by dust characterised by an unusually low value of RV. This may help to explain the rather puzzling result found by many groups that, when RV is treated as a free parameter in fitting the SNe Ia Hubble diagram, the preferred value is typically ~1.5–2.2 (e.g. see Guy et al. 2010; Burns et al. 2011; Sullivan et al. 2011) since the more-reddened objects will dominate any such calculation. Moreover, as emphasised by Freedman et al. (2009) and Guy et al. (2010), when minimizing χ2 in the Hubble diagram, the best-fit value of RV depends strongly on the errors in the measured colors. Hence, the fit of RV not only requires an unbiased estimate of the color, but also of the uncertainties of this estimate. Underestimated color uncertainties will bias RV to lower values.
Before leaving this subject, it is worth mentioning a potential complication. In examining the colors and absolute magnitudes of a nearby sample of SNe Ia, Wang et al. (2009) found evidence for two separate subgroups. The ‘Normal’ SNe display a relatively narrow range of expansion velocities of the Si II λ6355 absorption near B maximum of 10 600 ± 400 km s–1, whereas the ‘HV’ (high velocity) group have Si II λ6355 velocities > 11 800 km s–1. Wang et al. (2009) found that the HV SNe Ia had (B – V) colors that were redder on average by ~0.1 mag than the Normal events, and were characterised by RV ~ 1.6 versus a value of 2.4 for the Normal ones. However, in a reinterpretation of essentially the same data, Foley & Kasen (2011) found that when the most highly-reddened events (E(B – V) > 0.35) were eliminated, both the HV and Normal subsamples were consistent with the same value of RV = 2.5. Foley & Kasen (2011) interpreted the redder colors of the HV SNe Ia as being produced by increased line blanketing at blue wavelengths due to the higher expansion velocities. Fortunately, the HV SNe comprise a relatively small percentage (10–20%) of the sample observed by the CSP, and the luminosity-color dependence in the NIR is virtually non-existent (see Figure 14 of Burns et al. 2011), but these results serve as a caution to assumptions of uniform intrinsic colors for all SNe Ia.
2.3 Absolute Magnitudes
The absolute magnitudes of SNe Ia are strongly correlated with decline rate at optical wavelengths (Phillips 1993; Hamuy et al. 1996a; Phillips et al. 1999). Although this relationship has allowed SNe Ia to be used as precision distance indicators out to redshifts z > 1, the fact that the slope of this relationship becomes progressively shallower at redder wavelengths, led Phillips (1993) to speculate that ‘it might be more fruitful to concentrate observations in the I band, or in the near-infrared, where the intrinsic dispersion in peak brightness appears to be smaller’. In their pioneering study, Elias et al. (1985) had already found evidence from a small number of SNe Ia that the intrinsic dispersion in absolute magnitudes in the NIR was as little as ~0.1–0.2 mag. This was confirmed by Meikle (2000), but again from a small sample of only eight SNe, four of which were in the Elias et al. (1985) sample. A few years later the subject was revisited by Krisciunas, Phillips & Suntzeff (2004a) who, from a larger sample of 16 SNe Ia, found dispersions in absolute magnitude of 0.12–0.18 mag in JHK, with no evidence for a significant decline rate dependence. Although it is possible to obtain a similar scatter from the best data sets in B and V, it is only achievable after applying significant corrections for both decline rate and color. As there is no guarantee that such corrections are the same for all SNe Ia and at all look-back times — indeed, there is already evidence that they may be dependent on the properties of the host galaxy (Hicken et al. 2009; Kelly et al. 2010; Sullivan et al. 2010; Lampeitl et al. 2010; Sullivan et al. 2011) — there would seem to be clear advantages to working in the NIR.
In fact, as higher-precision NIR light curves of more and more SNe Ia become available, some evidence for absolute magnitude differences in the NIR are being found. From a study of 30 SNe Ia, including nine fast decliners (Δm15(B) > 1.6), Krisciunas et al. (2009) found evidence for a bimodal distribution in the NIR absolute magnitudes at maximum light. In particular, the fast-declining SNe that peaked in the NIR after the epoch of B maximum were found to be sub-luminous in JHK, whereas those that peaked in the NIR before B maximum, were found to have absolute magnitudes indistinguishable from those of normal slower-declining SNe Ia. Recently, Kattner et al. (2011) used a sample of 27 uniformly-observed SNe Ia from the CSP to study the luminosity-decline rate relationship in the NIR. All 27 SNe had pre-maximum photometry in the optical, and 13 were caught before the NIR maxima. Kattner et al. (2011) confirmed the apparent bimodal distribution of absolute magnitudes for fast-declining SNe Ia. Moreover, the quality of the data allowed the detection of a weak dependence of luminosity on decline rate for normal SNe Ia at the 2–3σ level in the J and H bands. The dependence in Y was weaker and only detectable at ~1σ. This study suggests that applying a correction for decline-rate to SNe Ia luminosities is likely to be beneficial for distance determinations in the J and H bands employing well-sampled, high S/N observations, although the gains are relatively small. The Y band appears to hold significant promise for future cosmological studies as it offers an optimal combination of signal-to-noise, low sensitivity to dust extinction, and an essentially negligible dependence of absolute magnitude on decline rate.
2.4 Hubble Diagram
Although SNe Ia are fascinating astrophysical objects on their own, much of the intense interest focussed on them during the last two decades has been motivated by their use as cosmological distance indicators. The discovery and empirical calibration of the luminosity-decline rate and luminosity-color relationships have made these objects powerful standardizable candles at optical wavelengths. Yet there is a growing consensus that their ultimate advantage is in the NIR where, for most intents and purposes, they are truly standard candles.
To illustrate this, CSP observations in BViYJH for 52 well-observed SNe Ia are plotted as Hubble diagrams in Figure 4. The maximum light magnitudes in all filters were derived from template fits performed with SNooPy. These were corrected for Milky Way dust extinction using the reddening maps of Schlegel, Finkbeiner & Davis (1998) and also K-corrected, but no luminosity corrections for either decline rate or color were applied. Note that the dispersion in the optical filters starts off quite high — 0.69 mag in B — but drops rapidly to 0.30 mag in the i band, reflecting the fact that the corrections for both empirical relationships are greatest in the blue, but diminish dramatically at redder wavelengths. The dispersions of 0.19 and 0.20 mag observed in the Y and J bands are truly impressive considering that the data have only been corrected for Galactic reddening. The slightly larger dispersion of 0.23 mag found in H, while still very good, is a bit higher due to the somewhat lower S/N of the photometry, nearly all of which was obtained with the LCO 1 m Swope telescope.

|
Since the dependence of peak luminosity on decline rate and color is small in the NIR, correcting for these effects produces a relatively small effect on the dispersions, which decreases to 0.17, 0.16, and 0.20 mag in YJH, respectively. However, the median redshift of the CSP SNe Ia is z ~ 0.02. At this distance, the rms error due to peculiar velocities is 5% in distance (±0.11 mag in distance modulus) and therefore is a significant contribution to the observed Hubble diagram dispersion (Neill, Hudson, & Conley 2007; Folatelli et al. 2010). The CSP is now engaged in a new five-year photometric study of an additional ~100 SNe Ia to push the NIR Hubble diagram out to z ~ 0.08 in order to determine their true precision as distance indicators.
3 Fast-Declining SNe Ia
Although evidence had been presented in 1987 that SNe Ia were not all identical (Branch 1987; Phillips et al. 1987), the discovery and follow-up of two SNe in 1991 — SN 1991T and SN 1991bg — definitively demonstrated that SNe Ia show a significant range of properties. SN 1991T was a slow-declining, luminous SN whose spectrum was dominated by strong Fe III absorption leading up to maximum, developing the signature Si II λ6355 absorption of SNe Ia only after maximum (Filippenko et al. 1992a; Phillips et al. 1992). On the other hand, SN 1991bg was a fast-declining, sub-luminous event that was intrinsically red at maximum and showed a deep trough at ~4200 Å due mostly to Ti II (Filippenko et al. 1992b; Leibundgut et al. 1993). As shown a few years later by Nugent et al. (1995), these two SNe represent the extremes in a spectral (or effective temperature) sequence of SNe Ia that is strongly correlated with decline rate and has its origin in the amount of 56Ni produced in the explosion.
The SN 1991T-like objects constitute only 9% of all SNe Ia in the local Universe (Li et al. 2011), and fall on the high-luminosity extension of the luminosity-decline rate relationship where they mix with SNe Ia with more normal spectral characteristics. On the other hand, the SN 1991bg-like events, which account for 15–20% of all local SNe Ia, form more of a separate subgroup and display a strong preference to occur in elliptical and lenticular host galaxies (Hamuy et al. 1996a, 2000; Li et al. 2011; González-Gaitán 2011). An interesting question is whether the 1991bg-like objects are a physically separate subtype of SNe Ia with different progenitors and/or explosion mechanisms (e.g. see Pakmor et al. 2010), or whether they are the smooth extension of ‘normal’ SNe Ia to the smallest 56Ni masses. In the latter case, it might be expected that there would be SNe Ia with intermediate properties, the SN 1986G-like events being the most likely candidates (Garnavich et al. 2004).
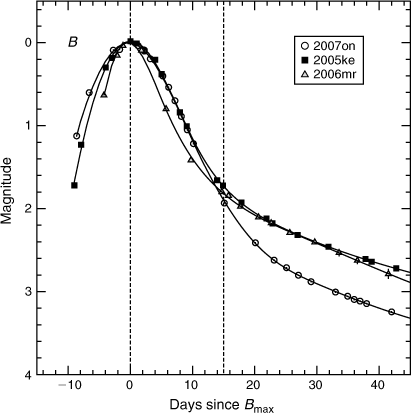
Figure 5 displays the B light curves of three fast-declining SNe Ia. As is seen, the value of Δm15(B) for all three SNe is ~1.9, yet the overall shapes of the light curves are distinct. SN 2006mr, which was a 1991bg-like event that appeared in NGC 1316 in the outskirts of the Fornax cluster (Stritzinger et al. 2010), displays the narrowest of the three light curves. The shape of the light curve of SN 2005ke in NGC 1371, a member of the Eridanus Group, is very similar to that of SN 2006mr after maximum, but displays a slower pre-maximum rise. Finally, SN 2007on, a 1986G-like event that appeared in the Fornax cluster member NGC 1404, showed the slowest pre-maximum rise, and also faded the most from maximum before reaching the exponential decline phase. Clearly at these very fast decline rates, the Δm15(B) parameter loses its power to discriminate between different light-curve morphologies.
|
The NIR light curves of these three fast-declining SNe Ia are also quite distinct. This is illustrated in Figure 6, which compares the Y band photometry. The differences between the 1991bg-like SN 2006mr and the 1986G-like SN 2007on are striking. The primary maximum of the latter peaked a few days before the epoch of B maximum, whereas the light curve of SN 2006mr peaked nearly a week after maximum. Also, SN 2007on displayed a clear secondary maximum which is missing in the light curve of SN 2006mr. These are the distinguishing features of the NIR light curves of 1986G-like and 1991bg-like events as documented by Krisciunas et al. (2009). Interestingly, the Y light curve of SN 2005ke appears to be intermediate between those of the other two SNe; while primary maximum is reached just after the time of B maximum, there is clear evidence of a weak secondary maximum.
|
Color appears to be a better discriminator than decline rate for the fast-declining SNe Ia (González-Gaitán 2011). This is shown in Figure 7 where the (Bmax – Vmax) pseudocolor versus the B- and Y-band absolute magnitudes for 12 fast-declining SNe Ia observed by the CSP are plotted. This sample is divided into 1986G-like and 1991bg-like SNe based on the timing of the primary maximum in iYJH and/or the presence of a secondary maximum (Krisciunas et al. 2009). Note that the range of absolute magnitudes is much larger in B than in Y. This is almost certainly due to the strong, temperature-sensitive line blanketing in B. The positions of SNe 2006mr, 2007on, and 2005ke are indicated in Figure 7. Again, SN 2005ke is seen to be intermediate in its properties, although closer to those of SN 2006mr. Interestingly, Krisciunas et al. (2009) found an apparent correlation between the absolute J magnitude of fast-declining events and the timing of J maximum with respect to the epoch of B maximum, suggesting a smoothly-varying sequence encompassing the 1986G-like and 1991bg-like events.
|
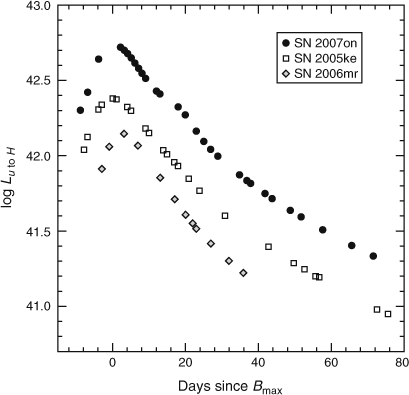
The evolution of the integrated u to H luminosities of SNe 2006mr, 2007on, and 2005ke is plotted in Figure 8. Clear differences in these pseudo-bolometric light curves are observed for all three SNe, not only in the peak luminosity but also in the overall shape of the light curve and the timing of maximum. Assuming that the peak luminosity is directly proportional to the 56Ni mass (Arnett 1982), Figure 8 implies a factor of ~4 difference in 56Ni mass between SNe 2007on and 2006mr.
|
More observations are required before it is possible to give a definitive answer to the question of whether the 1991bg-like and 1986G-like SNe share similar origins, although the existence of objects such as SN 2005ke that seem to bridge the gap between the two subgroups is certainly suggestive that such a link may exist.
4 Peculiar SNe Ia
To this point, this review has dealt only with what are commonly deemed ‘typical’ SNe Ia which, in this case, include the luminous, slow-declining 1991T-like events as well as the sub-luminous, fast-declining 1991bg-like objects. Although the vast majority of SNe Ia meet this definition, there are a few members of the class that stick out as truly peculiar. In this section, what is known of the NIR photometric properties of these objects is briefly reviewed.
4.1 SN 2002cx-Like
Although the overwhelming majority of SNe Ia obey the luminosity-decline rate relationship and display a remarkably uniform spectral evolution, a few do not. Such was the case of SN 2002cx, which Li et al. (2003) called ‘the most peculiar known Type Ia supernova’. Despite being characterised by a normal initial decline rate of Δm15(B) = 1.3, SN 2002cx displayed a number of peculiar properties including a high-ionization 1991T-like spectrum at maximum light dominated by Fe-group elements, and expansion velocities approximately half those of ordinary SNe Ia. The peak absolute magnitudes in B and V were nearly 2 mag fainter than a normal SN Ia of the same decline rate, and the I band light curve displayed a broad primary maximum completely lacking a secondary maximum.
Since the discovery of SN 2002cx, a number of similar SNe have been observed. Although it has been suggested that the peak luminosities of these objects are highly correlated with both light-curve decline rate and expansion velocities (McClelland et al. 2010), a counter example to the trend was recently identified (Narayan et al. 2011).
According to Li et al. (2011), 2002cx-like events account for ~5% of all SNe Ia in the local universe. The first to be observed photometrically in the NIR was SN 2005hk (Phillips et al. 2007). Remarkably, the iYJH curves all showed a single broad maximum which, in Y and H, did not peak until 15 days after the epoch of B maximum. Kasen (2006) has emphasised that the strength of the secondary maximum in the NIR is an excellent diagnostic of the degree of 56Ni mixing in the ejecta of SNe Ia. The double-peaked structure observed in the NIR light curves of typical SNe Ia is a direct sign of the concentration of Fe-peak elements in the central regions, whereas the lack of a secondary maximum is indicative of strong mixing. This and a number of the other properties of 2002cx-like SNe are most readily explained by the pure deflagration of a white dwarf, although late-time spectroscopy of SN 2002cx showed an unexpectedly high mass and density at low velocity which is not predicted by such a model (Jha et al. 2006). Hence, the nature of these objects is still an open question, as is their relationship to normal SNe Ia.
4.2 Super-Chandra SNe Ia
During the course of the CFHT SN Legacy Survey, a high-redshift (z = 0.244) SN Ia was discovered with a normal looking spectrum, but with an exceptionally high luminosity (MV ~ –20.0) for its decline rate and unusually low Si II λ6355 expansion velocities (Howell et al. 2006). The implication was that this object, SN 2003fg (a.k.a. SNLS-03D3bb), had a 56Ni mass of 1.3 M⊙. Such a large 56Ni mass would seem to be inconsistent with the progenitor having been a Chandrasekhar mass (1.4 M⊙) white dwarf. The low expansion velocities were also suggestive of a massive progenitor. In the following years, a few more such SNe have been identified, two of which, SNe 2007if (Scalzo et al. 2010) and 2009dc (see Taubenberger et al. 2011 and references therein), were also exceptionally luminous and showed unusually strong absorption features of C II leading up to maximum light. These objects, which seem to occur preferentially in a low-metallicity environment (Childress et al. 2011; Khan et al. 2011), have become collectively known as ‘super-Chandra SNe Ia’ — although it must be said that Chandrasekhar-mass progenitor models have not yet been entirely ruled out.
NIR photometry was obtained of both SNe 2007if and 2009dc by several different groups (Scalzo et al. 2010; Yamanaka et al. 2009; Taubenberger et al. 2011; Stritzinger et al. 2011). Both objects had slow decline rates of Δm15(B) ~ 0.7, and in both the secondary maximum in the NIR was unusually bright, giving rise to a broad plateau or shoulder. For SN 2009dc, this phase continued for at least 50 days past maximum in the J band. Although the merger of two fairly massive white dwarfs to form a super-Chandrasekhar-mass white dwarf has been the most favored model to date, it has been argued that the off-center explosion of a Chandrasekhar-mass white dwarf could also explain the large bolometric luminosity (Hillebrandt, Sim & Röpke 2007). However, spectropolarimetry of SN 2009dc indicated that the explosion was quite spherically symmetric (Tanaka et al. 2010), which appears inconsistent with this idea. In any case, no model (super-Chandrasekhar or otherwise) has yet successfully explained the observed properties of this apparently rare class of SNe Ia.
4.3 SN 2006bt-Like
For those interested in using SNe Ia as cosmological distance indicators, perhaps the most troubling of the peculiar objects are the 2006bt-like SNe. The prototype of this subclass was observed in detail by Foley et al. (2010). While its decline rate of Δm15(B) = 1.1 was similar to that of a normal SN Ia, SN 2006bt displayed intrinsically-red colors and optical spectroscopic properties that were more like those of fast-declining, low-luminosity events. In addition, the i-band light curve showed only a weak secondary maximum. Although the peak absolute magnitude in V of SN 2006bt was within the dispersion of normal values for SNe Ia with a decline rate of Δm15(B) = 1.1, the intrinsically-red color evolution of the SN caused standard light curve fitting programs to significantly overestimate the dust reddening. From Monte Carlo simulations, Foley et al. (2010) found that these reddening overestimates would get larger as a function of redshift, potentially increasing the Hubble diagram scatter as well as introducing a systematic bias.
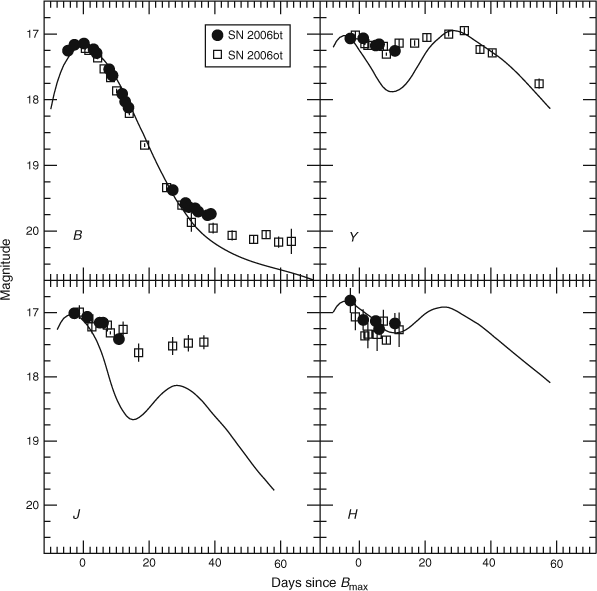
Optical and NIR light curves of SN 2006bt were obtained by the CSP (Stritzinger et al. 2011), with the BYJH observations reproduced in Figure 9. For reference, the SNooPY templates of a normal SN Ia with a Δm15(B) of 1.0 are included as solid lines. In the three NIR filters, broad, slow-declining light curves are observed with the primary and secondary maxima merged to form a plateau-like feature. This morphology is not unlike that observed for super-Chandra SNe Ia in the same filters, although the peak luminosities are significantly lower for SN 2006bt. Interestingly, a second object observed by the CSP, SN 2006ot, appears to be closely related to SN 2006bt (Stritzinger et al. 2011). The photometry for this object is included in Figure 9, and shows that the two SNe were quite similar. This similarity also extended to the peak absolute magnitudes, which were the same to within ~0.1 mag. Spectroscopically, however, SN 2006ot showed clear differences with respect to SN 2006bt, most strikingly in the greater strength and width of the Si II λ6355 line, and its higher expansion velocity. Interestingly, the hosts of SN 2006bt and SN 2006ot were an S0/a galaxy and an Sa, respectively, implying a relatively old progenitor (Foley et al. 2010).
|
With only two 2006bt-like objects in a sample of 85 SNe Ia observed by the CSP, it appears that these peculiar events are not particularly common. However, they will be difficult to recognise unless good quality photometry is obtained in the i, Y or J bands. Clearly it is desirable to identify more of these peculiar SNe Ia in order to better document their properties and begin to deduce their relationship to typical SNe Ia.
5 Conclusions
Thirty years after the pioneering work of Elias et al. (1981), NIR coverage of nearby SNe Ia has become relatively commonplace. Certainly this change has been helped along by the availability of modern NIR arrays, which have immensely improved both the sensitivity and areal coverage on the sky (important for accurate background subtraction). These technological improvements have allowed important NIR surveys of SNe Ia such as PARITEL and CSP to be carried out with small (1.0–1.3 m) telescopes. These observations have revealed the full variety of properties of the NIR light curves of SNe Ia, from the slowest, most-luminous events to the fastest declining, sub-luminous objects. In general, an orderly progression of light-curve shapes is observed over this range, although variations exist in the strength of the secondary maximum at any particular decline rate.
NIR photometry has more than fulfilled the promise of improving the precision of SNe Ia as cosmological distance indicators that was originally foreseen in the modest Hubble diagram plotted by Elias et al. (1985). The NIR light curves published for more than 120 nearby SNe Ia during the last ten years have unequivocally demonstrated that these objects are essentially perfect standard candles at these wavelengths, with only a very slight dependence of luminosity on decline rate and color. In order to build a definitive nearby reference sample, the challenge is not only to observe more SNe, but also to push to higher redshifts since peculiar velocities are the dominant source of the dispersion in the NIR SNe Ia Hubble diagrams published to date.
In order for SNe Ia to be effective in constraining the dark energy equation of state in next-generation experiments such as WFIRST, the evolution of the empirically-corrected luminosity must be less than 1–2% out to z < 1.5 (Albrecht et al. 2006). NIR observations appear to be the best (perhaps the only) way to meet such a requirement. At an effective wavelength of 1.03 μm, the Y band seems extremely well suited for pushing to high redshift since it offers the best combination of shortest wavelength, achievable signal-to-noise, and insensitivity to luminosity corrections for decline rate and color. The NIR also provides an effective way to identify certain peculiar SNe Ia whose optical light curves are otherwise normal in appearance.
This review has emphasised the advances made in our understanding of the photometric properties of SNe Ia, but the NIR spectroscopic properties of these objects are still relatively poorly documented. While important progress in this area was made recently with the publication of 41 spectra of 29 SNe Ia by Marion et al. (2009), aside from the normal SNe 1999ee (Hamuy et al. 2002) and 2003du (Stanishev et al. 2007), and the fast-decliner SN 1999by (Höflich et al. 2002), there are only a few events for which multi-epoch spectra have been obtained. Such data offer considerable promise for constraining the radial distribution of the elements synthesised in the explosion, particularly since the optical depth in the NIR drops rapidly after maximum, exposing a greater amount of the SN ejecta. The possible existence of metallicity and luminosity spectroscopic indicators in the NIR is an area that is also relatively unexplored. Finally, a better understanding of the NIR spectral evolution of SNe Ia is vital for determining precise K corrections for future cosmology studies. With the growing availability of fast NIR spectrographs on telescopes of 4–8 m, this is an area where we can expect much progress in coming years.
Acknowledgments
The author wishes to acknowledge the Oskar Klein Centre for Cosmoparticle Physics at the University of Stockholm and, in particular, Ariel Goobar and Maximilian Stritzinger, for their hospitality and support during a 3-week visit in May 2011, when work on this review paper began. Special thanks are also in order to Chris Burns, Eric Hsiao, and Maximilian Stritzinger for their valuable comments on an early draft of this paper. Many of the NIR observations discussed in this review were obtained by the CSP, which has been generously supported by the National Science Foundation under grants AST0306969, AST0607438, and AST1008343. The CSP began in 2004, and the fruits that it is now bearing have resulted from the dedication and effort of a large number of people with whom it has been my pleasure to work.
References
Albrecht, A., et al., 2006, Report of the Dark Energy Task Force (astroph/0609591)Arnett, W. D., 1982, ApJ, 253, 785
| Crossref | GoogleScholarGoogle Scholar | 1:CAS:528:DyaL38XhslWkt70%3D&md5=7883898a6a69d06c759562262a02012fCAS |
Axelrod, T. S., 1980, PhD Thesis, University of California, Santa Cruz
Branch, D., 1987, ApJL, 316, L81
| Crossref | GoogleScholarGoogle Scholar | 1:CAS:528:DyaL2sXit1ektLg%3D&md5=eb57320f1cc68f83cd2a7faf82a6f816CAS |
Burns, C. et al., 2011, AJ, 141, 19
Cantiello, M., Blakeslee, J., Raimondo, G., Brocato, E. and Capaccioli, M., 2007, ApJ, 668, 130
| Crossref | GoogleScholarGoogle Scholar | 1:CAS:528:DC%2BD2sXhtlWks7nE&md5=5570cb55bb8fc5338efd445042016abaCAS |
Cardelli, J. A., Clayton, G. C. and Mathis, J.S., 1989, ApJ, 345, 245
| Crossref | GoogleScholarGoogle Scholar | 1:CAS:528:DyaL1MXmtVCksbo%3D&md5=90af0f07668b0eaf9561d0d96b50288cCAS |
Childress, M. et al., 2011, ApJ, 733, 3
| Crossref | GoogleScholarGoogle Scholar |
Chotard, N. et al., 2011, A&A, 529, L4
Contreras, C. et al., 2010, AJ, 139, 519
Cristiani, S. et al., 1992, A&A, 259, 63
Elias, J. H. and Frogel, J. A., 1983, ApJ, 268, 718
| Crossref | GoogleScholarGoogle Scholar | 1:CAS:528:DyaL3sXktFems74%3D&md5=e3cf105ffbbf4c4fc48474c4bc579c74CAS |
Elias, J. H., Frogel, J. A., Hackwell, J. A. and Persson, S. E., 1981, ApJL, 251, L13
| Crossref | GoogleScholarGoogle Scholar |
Elias, J. H., Matthews, K., Neugebauer, G. and Persson, S. E., 1985, ApJ, 296, 379
| 1:CAS:528:DyaL2MXlvVKnsL4%3D&md5=1e27cc2e6974dd401cf59fda2d771a24CAS |
Filippenko, A. V. et al., 1992a, ApJL, 384, L15
| Crossref | GoogleScholarGoogle Scholar | 1:CAS:528:DyaK38XpsVOhtQ%3D%3D&md5=aa18def9a2cefb5c38e7b172fa2d0457CAS |
Filippenko, A. V. et al., 1992b, AJ, 104, 1543
Folatelli, G. et al., 2010, AJ, 139, 120
| 1:CAS:528:DC%2BC3cXhtF2qsLg%3D&md5=7d5e075aad1dafa7ab2569e8dddc5a66CAS |
Foley, R. J. and Kasen, D., 2011, ApJ, 729, 55
| Crossref | GoogleScholarGoogle Scholar |
Foley, R. J. et al., 2010, ApJ, 708, 1748
| Crossref | GoogleScholarGoogle Scholar | 1:CAS:528:DC%2BC3cXhvFSltLo%3D&md5=581b5678e208e4defeab17f3479ba1e5CAS |
Freedman, W. L. et al., 2009, ApJ, 704, 1036
| Crossref | GoogleScholarGoogle Scholar |
Frogel, J. A., Gregory, B., Kawara, K., Laney, D., Phillips, M. M., Terndrup, D., Vrba, F. and Whitford, A. E., 1987, ApJL, 315, L129
| Crossref | GoogleScholarGoogle Scholar | 1:CAS:528:DyaL2sXhs1GgtLc%3D&md5=31bb34bd9f0a5051b04536d61ca26d2cCAS |
Garnavich, P. M., 2004, ApJ, 613, 1120
| Crossref | GoogleScholarGoogle Scholar | 1:CAS:528:DC%2BD2cXpsl2mtbo%3D&md5=8d8482ce68eefe168ae9c88f4a190fa9CAS |
González-Gaitán, S., 2011, ApJ, 727, 107
| Crossref | GoogleScholarGoogle Scholar |
Goobar, A., 2008, ApJL, 686, L103
| Crossref | GoogleScholarGoogle Scholar |
Guy, J. et al., 2010, A&A, 523, 7
Hamuy, M. et al., 1996a, AJ, 112, 2391
Hamuy, M. et al., 1996b, AJ, 112, 2438
Hamuy, M., Trager, S. C., Pinto, P. A., Phillips, M. M., Schommer, R. A., Ivanov, V. and Suntzeff, N. B., 2000, AJ, 120, 1479
Hamuy, M. et al., 2002, AJ, 124, 417
| 1:CAS:528:DC%2BD38XntF2itL0%3D&md5=78b5a35bd96ee27817d5d7b75b0d7876CAS |
Hamuy, M. et al., 2006, PASP, 118, 2
| Crossref | GoogleScholarGoogle Scholar |
Hernandez, M. et al., 2000, MNRAS, 319, 223
| Crossref | GoogleScholarGoogle Scholar |
Hicken, M., Wood-Vasey, W. M., Blondin, S., Challis, P., Jha, S., Kelly, P. L., Rest, A. and Kirshner, R. P., 2009, ApJ, 700, 1097
| Crossref | GoogleScholarGoogle Scholar |
Hillebrandt, W., Sim, S. A. and Röpke, F. K., 2007, A&A, 465, L17
| 1:CAS:528:DC%2BD2sXlslCjur8%3D&md5=5d9b21581178e3fe13814bae0615b3fdCAS |
Höflich, P., Khokhlov, A. M. and Wheeler, J. C., 1995, ApJ, 444, 831
| Crossref | GoogleScholarGoogle Scholar |
Höflich, P., Gerardy, C., Fesen, R. and Sakai, S., 2002, ApJ, 568, 791
| Crossref | GoogleScholarGoogle Scholar |
Howell, D. A. et al., 2006, Natur, 443, 308
| Crossref | GoogleScholarGoogle Scholar |
Hoyle, F. and Fowler, W. A., 1960, ApJ, 132, 565
| Crossref | GoogleScholarGoogle Scholar | 1:CAS:528:DyaF3MXktFCntQ%3D%3D&md5=bc9d9ec7e51819bf1b2cfde7158a6bb9CAS |
Jensen, J. B., Tonry, J. L., Barris, B. J., Thompson, R. I., Liu, M. C., Rieke, M. J., Ajhar, E. A. and Blakeslee, J. P., 2003, ApJ, 583, 712
| Crossref | GoogleScholarGoogle Scholar | 1:CAS:528:DC%2BD3sXhs1WksLc%3D&md5=70614f0374fa7dab5134b6862b00f84cCAS |
Jha, S. et al., 1999, ApJS, 125, 73
| Crossref | GoogleScholarGoogle Scholar |
Jha, S., Branch, D., Chornock, R., Foley, R. J., Li, W., Swift, B. J., Casebeer, D. and Filippenko, A. V., 2006, AJ, 132, 189
| 1:CAS:528:DC%2BD28XnslKgtr4%3D&md5=a5429189f56cc8618278354e4d6e6e92CAS |
Jha, S., Riess, A. G. and Kirshner, R. P., 2007, ApJ, 659, 122
| Crossref | GoogleScholarGoogle Scholar |
Kasen, D., 2006, ApJ, 649, 939
| Crossref | GoogleScholarGoogle Scholar | 1:CAS:528:DC%2BD28XhtFyiu7fP&md5=d9abf00980004bf3f2f0b538391b5914CAS |
Kattner, S., et al., 2011, PASP, submitted
Kelly, P. L., Hicken, M., Burke, D. L., Mandel, K. S. and Kirshner, R. P., 2010, ApJ, 715, 743
| Crossref | GoogleScholarGoogle Scholar |
Kessler, R. et al., 2009, ApJS, 185, 32
| Crossref | GoogleScholarGoogle Scholar | 1:CAS:528:DC%2BD1MXhsFGmu7vL&md5=465c1a4a4c48506a3400a8e28fcc8755CAS |
Khan, R., Stanek, K. Z., Stoll, R. and Prieto, J. L., 2011, ApJL, 737, L24
| Crossref | GoogleScholarGoogle Scholar |
Kirshner, R. P., Willner, S. P., Becklin, E. E., Neugebauer, G. and Oke, J. B., 1973, ApJL, 180, L97
| Crossref | GoogleScholarGoogle Scholar |
Krisciunas, K., Hastings, N. C., Loomis, K., McMillan, R., Rest, A., Riess, A. G. and Stubbs, C., 2000, ApJ, 539, 658
| Crossref | GoogleScholarGoogle Scholar | 1:CAS:528:DC%2BD3cXntVyms70%3D&md5=477cb5f5fa01ba9b79f198fa2e2c0709CAS |
Krisciunas, K. et al., 2001, AJ, 122, 1616
Krisciunas, K. et al., 2003, AJ, 125, 166
Krisciunas, K., Phillips, M. M. and Suntzeff, N. B., 2004a, ApJL, 602, L81
| Crossref | GoogleScholarGoogle Scholar |
Krisciunas, K. et al., 2004b, AJ, 127, 1664
Krisciunas, K. et al., 2004c, AJ, 128, 3034
| 1:CAS:528:DC%2BD2MXhvV2lsg%3D%3D&md5=97062fa8b9eb3e022072de5bb316f99aCAS |
Krisciunas, K. et al., 2007, AJ, 133, 58
| 1:CAS:528:DC%2BD2sXhsFaiu7g%3D&md5=710745717cd2733d836b9f91c5737327CAS |
Krisciunas, K. et al., 2009, AJ, 138, 1584
| 1:CAS:528:DC%2BC3cXjsV2hsw%3D%3D&md5=68c32b60072caf75e44ceb552ac62dfdCAS |
Lampeitl, H. et al., 2010, ApJ, 722, 566
| Crossref | GoogleScholarGoogle Scholar |
Leibundgut, B. et al., 1992, AJ, 105, 301
Leloudas, G. et al., 2009, A&A, 505, 265
| 1:CAS:528:DC%2BD1MXhsVWgur3I&md5=6d16553a7042804f46a18f848cd760e9CAS |
Li, W. et al., 2003, PASP, 115, 453
| Crossref | GoogleScholarGoogle Scholar |
Li, W., Chornock, R., Leaman, J., Filippenko, A. V., Poznanski, D., Wang, X., Ganeshalingam, M. and Mannucci, F., 2011, MNRAS, 412, 1473
| Crossref | GoogleScholarGoogle Scholar |
Mandel, K. S., Narayan, G. and Kirshner, R. P., 2011, ApJ, 731, 120
| Crossref | GoogleScholarGoogle Scholar |
Marion, G. H. et al., 2009, AJ, 138, 727
| 1:CAS:528:DC%2BD1MXhtFGmtL7I&md5=316f8f01dd37724bfa991aecc8edca91CAS |
McClelland, C. M., 2010, ApJ, 720, 704
| Crossref | GoogleScholarGoogle Scholar |
Meikle, W. P. S., 2000, MNRAS, 314, 782
| Crossref | GoogleScholarGoogle Scholar |
Minkowski, R., 1941, PASP, 53, 224
| Crossref | GoogleScholarGoogle Scholar |
Narayan, G. et al., 2011, ApJ, 731, L11
| Crossref | GoogleScholarGoogle Scholar |
Neill, J. D., Hudson, M. J. and Conley, A., 2007, ApJL, 661,
| 1:CAS:528:DC%2BD2sXnsVKntrk%3D&md5=b672db533e1ad396d760bd8db4720f26CAS |
Nugent, P., Phillips, M., Baron, E., Branch, D. and Hauschildt, P., 1995, ApJL, 455, 147
| Crossref | GoogleScholarGoogle Scholar |
Nugent, P. E., Sullivan, M., Bersier, D., Howell, D. A., Thomas, R. & James, P., 2011, CBET, Electronic Telegram No. 2792
Pakmor, R., Kromer, M., Röpke, F. K., Sim, S. A., Ruiter, A. J. and Hillebrandt, W., 2010, Natur, 463, 61
| Crossref | GoogleScholarGoogle Scholar | 1:CAS:528:DC%2BC3cXhvFCitA%3D%3D&md5=d9dc53f487f704330f22bfa6ba8db19eCAS |
Patat, F. et al., 2007, Sci, 317, 924
| Crossref | GoogleScholarGoogle Scholar | 1:CAS:528:DC%2BD2sXptVajurk%3D&md5=d9bb3920f60a56674a26e967bc007216CAS |
Perlmutter, S., 1997, in Thermonuclear Supernovae, ed. P. Ruiz-Lapuente, R. Canal & J. Isern (Dordrecht: Kluwer), 749
Perlmutter, S. et al., 1999, ApJ, 517, 565
| Crossref | GoogleScholarGoogle Scholar |
Phillips, M. M., 1993, ApJL, 413, L105
| Crossref | GoogleScholarGoogle Scholar |
Phillips, M. M., 2007, PASP, 119, 360
Phillips, M. M. et al., 1987, PASP, 99, 592
| Crossref | GoogleScholarGoogle Scholar | 1:CAS:528:DyaL2sXlt1ertr0%3D&md5=1ce81cb7e9cfd00ef6b3fdda9be6cf43CAS |
Phillips, M. M. et al., 1992, AJ, 103, 1632
| 1:CAS:528:DyaK38Xis1CqsLg%3D&md5=c50074a40d2636a29d3df591b0c32033CAS |
Phillips, M. M., Lira, P., Suntzeff, N. B., Schommer, R. A., Hamuy, M. and Maza, J., 1999, AJ, 118, 1766
Pinto, P. A. and Eastman, R. G., 2000, ApJ, 530, 757
| Crossref | GoogleScholarGoogle Scholar | 1:CAS:528:DC%2BD3cXisVKjtrs%3D&md5=08dbeb096ff137724ac9b46f97309f09CAS |
Riess, A. G. et al., 1998, AJ, 116, 1009
Riess, A. G. et al., 2011, ApJ, 730, 119
| Crossref | GoogleScholarGoogle Scholar |
Scalzo, R. A. et al., 2010, ApJ, 713, 1073
| Crossref | GoogleScholarGoogle Scholar | 1:CAS:528:DC%2BC3cXmtlSlsr8%3D&md5=f92295a772ece2ee40bf72ddd0b04e36CAS |
Schlegel, D. J., Finkbeiner, D. P. and Davis, M., 1998, ApJ, 500, 525
| Crossref | GoogleScholarGoogle Scholar |
Sollerman, J. et al., 2004, A&A, 428, 555
Spyromilio, J., Pinto, P. A. and Eastman, R. G., 1994, MNRAS, 266, L17
| 1:CAS:528:DyaK2cXitlSktrY%3D&md5=2da829a82d2b31a16527cbd2b35800c2CAS |
Spyromilio, J., Gilmozzi, R., Sollerman, J., Leibundgut, B., Fransson, C. and Cuby, J.-G., 2004, A&A, 426, 547
| 1:CAS:528:DC%2BD2cXhtVKisrfN&md5=648cc02b815014f5b7ed2330687d78f2CAS |
Stanishev, V. et al., 2007, A&A, 469, 645
| 1:CAS:528:DC%2BD2sXpt1enu7g%3D&md5=a756e55dd19d5d8cf7f9894d55d3e0ffCAS |
Stritzinger, M. D., 2010, AJ, 140, 2036
| 1:CAS:528:DC%2BC3MXksVSl&md5=1b18b23b282ef44accc4f7cccb7f5fc3CAS |
Stritzinger, M. D., 2011, AJ, in press
Stritzinger, M. and Sollerman, J., 2007, A&A, 470, L1
| 1:CAS:528:DC%2BD2sXhtVSrurbE&md5=df4b403445d2def4cfb299ccf05c03c9CAS |
Sullivan, M. et al., 2010, MNRAS, 406, 782
Sullivan, M. et al., 2011, ApJ, 737, 102
| Crossref | GoogleScholarGoogle Scholar |
Tanaka, M. et al., 2010, ApJ, 714, 1209
| Crossref | GoogleScholarGoogle Scholar | 1:CAS:528:DC%2BC3cXntFGgt7o%3D&md5=c62de12e7d45d6d612c80917eb751aa3CAS |
Taubenberger, S. et al., 2011, MNRAS, 412, 2735
| Crossref | GoogleScholarGoogle Scholar | 1:CAS:528:DC%2BC3MXnt1aru7Y%3D&md5=d3cd18778557c1746713149829719e08CAS |
Tonry, J. L., Dressler, A., Blakeslee, J. P., Ajhar, E. A., Fletcher, A. B., Luppino, G. A., Metzger, M. R. and Moore, C. B., 2001, ApJ, 546, 681
| Crossref | GoogleScholarGoogle Scholar |
Wang, X. et al., 2009, ApJL, 699, L139
| Crossref | GoogleScholarGoogle Scholar | 1:CAS:528:DC%2BD1MXpvFOku7k%3D&md5=bea9afe2a198ea33720fe37c1ac133a3CAS |
Wood-Vasey, W. M. et al., 2008, ApJ, 689, 377
| Crossref | GoogleScholarGoogle Scholar | 1:CAS:528:DC%2BD1MXmsVWhtA%3D%3D&md5=05a013cfaaf071e360ccdfc727dfdf71CAS |
Yamanaka, M. et al., 2009, ApJL, 707, L118
| Crossref | GoogleScholarGoogle Scholar |
1 Elias et al. (1981) pointed out that published and unpublished I-band photometry of SN 1972E had shown a similar behavior.
2 Elias et al. (1985) were also the first to use the nomenclature ‘Ia’ and ‘Ib’ to differentiate between Type I SNe that we now understand to be of thermonuclear as opposed to stripped core-collapse origin.
3 Kirshner et al. (1973) had been the first to detect this feature from optical and NIR observations of SN 1972E.
4 Here the term ‘host extinction’ includes all sources of dust extinction (intergalactic, interstellar, circumstellar) produced between the Milky Way and the SN.