
Global-scale future climate projections from ACCESS model contributions to CMIP6
Serena Schroeter A * , Daohua Bi B , Rachel M. Law B , Tammas F. Loughran B , Harun A. Rashid B and Zhaohui Wang B
A
B
Abstract
This paper describes projected climate evolution and outcomes simulated by the Australian Community Climate and Earth System Simulator (ACCESS) to varying future scenarios, including of socio-ecological and technological development, and land-use and land-cover change. Contributions to the Coupled Model Intercomparison Project Phase 6 (CMIP6) from the climate model version, ACCESS-CM2, and the fully coupled Earth System Model version, ACCESS-ESM1.5, are presented for the near-future (2020–2050), 21st Century (2000–2100) and longer-term (2100–2300). Scenario differentiation in the near future is aided by high-density sampling in large-ensemble ACCESS-ESM1.5, more clearly illustrating projected 2020–2050 global changes in temperature, precipitation and aerosol optical depth. Over the 21st Century, the heightened equilibrium climate sensitivity of ACCESS-CM2 relative to ACCESS-ESM1.5 results in persistently greater surface air temperature increases and larger amplified polar warming, leading to more rapid sea ice decline. Although weakening of the Atlantic meridional overturning circulation (AMOC) occurs in both models, 21st Century recovery under aggressive-mitigation and overshoot scenarios only occurs in ACCESS-ESM1.5; AMOC weakening continues under all scenarios in ACCESS-CM2 through to 2100. Longer-term climate response from simulations extending to 2300 depict opposing hemispheric responses of polar surface air temperatures and sea ice in both models under scenarios based on aggressive mitigation action, leading to a resurgence of surface ocean warming and Antarctic sea ice decline. Under a future scenario where development is driven by continued fossil fuel use, both AMOC and Antarctic Bottom Water Formation continue to weaken across 2200–2300 in both models, reaching such low levels in ACCESS-CM2 that these pivotal components of global meridional overturning circulation could be considered essentially to have ceased.
Keywords: ACCESS-CM2, ACCESS-ESM1.5, climate change, climate projection, climate simulation, CMIP6, coupled climate model, future scenarios.
1.Introduction
Future climate projections from state-of-the-art global climate models (GCMs) form the foundation for understanding potential societal and ecological risks (both global and regional) resulting from different emission and land-use trajectories. The latest archive of GCM outputs from major modelling centres around the world was recently coordinated through the sixth phase of the Coupled Model Intercomparison Project (CMIP6), a collaborative framework defining standard climate model experiments under guidance from the Working Group on Coupled Modelling (WGCM) of the World Climate Research Programme (WCRP) (Eyring et al. 2016). In addition to the core, baseline experiments of CMIP6 (including an unforced pre-industrial control simulation and forced historical simulation), several model intercomparison projects (MIPs) were endorsed to address specific scientific goals. One of these, the Land Use MIP (LUMIP) investigates the future climate impacts of changes in land-use and land-cover (Lawrence et al. 2016). Another is the ScenarioMIP, in which simulations estimate potential near- and long-term climate outcomes stemming from varying scenarios of global future socio-economic and technological development and the resulting emission levels (O’Neill et al. 2016). The scenarios span from aggressive mitigation action (combining reforestation and a shift towards sustainable development) through to energy-intensive, fossil fuel-driven development (Moss et al. 2010). The Coupled Climate–Carbon Cycle Model Intercomparison Project (C4MIP) investigates carbon cycle interactions and feedbacks in response to greenhouse gas emissions (Jones et al. 2016), whereas the CovidMIP simulations arose later from interest in potential climate impacts of societal COVID-19 lockdown periods, during which emissions were suddenly sharply reduced under suspended industrial, commercial and travel activities (Lamboll et al. 2021). CovidMIP also explored different potential recovery scenarios for post-lockdown emissions. The resulting trove of model data is standardised through the CMIP process and made widely available for quantitative exploration of potential future climate change. These estimations are a valuable source of scientific and technical guidance to inform policymakers considering different response options, and are compiled through various national and international assessments, such as the Intergovernmental Panel on Climate Change assessment reports (Meehl 2023).
The Australian Community Climate and Earth System Simulator (ACCESS) features among the GCMs that participated in the CMIP6, including an updated coupled model version, ACCESS-CM2 (Bi et al. 2020); a fully coupled Earth System Model version incorporating an interactive carbon cycle, ACCESS-ESM1.5 (Ziehn et al. 2020a); and an ocean and sea-ice only version, ACCESS-OM2 (Kiss et al. 2020). Following the work of Mackallah et al. (2022), in which an extensive overview of the spin-up, pre-industrial control (piControl) and idealised simulations are given (see also Section 2.1), and evaluation of the historical simulation in Rashid et al. (2022), we herein document and describe general, global-scale features of future projected climate evolution and outcomes in the atmosphere, ocean and sea ice simulated by the two fully coupled ACCESS models (ACCESS-CM2 and ACCESS-ESM1.5) under various forcing pathways. As is common for work discussing future scenarios, we include an overview of model simulations looking both at the near-future (2020–2050) and 21st Century (to 2100) simulated climate, during which greenhouse gas and aerosol forcing produce opposing temperature impacts. However, we also discuss extensions of a subset of scenarios beyond 2100 (during which the climate response is dominated by greenhouse gas forcing), which provide an important opportunity to examine long-term climate interactions, feedbacks and reversibility (O’Neill et al. 2016). Previous studies have shown that under net negative emissions scenarios, there are substantial regional differences in projections of temperature change following cessation of CO2 emissions (e.g. MacDougall et al. 2022); for example, while landmasses are generally projected to cool, warming continues in the Southern Ocean (Cassidy et al. 2023), with ramifications such as ongoing Antarctic sea ice decline (Chamberlain et al. 2023). Under a socioeconomic pathway of continued fossil fuel-driven development, rising CO2 concentrations persist beyond 2200, with scenario extensions thus enabling investigation of the long-term climate implications of continuously increasing levels of radiative forcing.
Section 2 provides a brief overview of the datasets produced and variables analysed; climate projections are then presented in Section 3. In Section 4, emissions-driven and altered land-use simulations using only ACCESS-ESM1.5 are described. Key highlights and conclusions are discussed in Section 5.
2.Data and method
2.1. Model description
The two versions of the ACCESS model we present here are ACCESS-CM2 and ACCESS-ESM1.5. As both models are documented in detail elsewhere (Bi et al. 2020; Ziehn et al. 2020a; Mackallah et al. 2022), we provide only a brief overview of their configuration. Both models use the UK Met Office Unified Model at N96 horizontal resolution (1.875° longitude by 1.25° latitude) as the atmosphere model component (Walters et al. 2019), although ACCESS-CM2 utilises version 10.6 with 85 vertical levels, ACCESS-ESM1.5 uses version 7.3 with 38 vertical levels. Both models use the Community Atmosphere Biosphere Land Exchange (CABLE) land surface scheme (Kowalczyk et al. 2013) (version 2.5 in ACCESS-CM2; version 2.4 in ACCESS-ESM1.5), and both also use version 5 of the National Oceanic and Atmospheric Administration (NOAA) Geophysical Fluid Dynamics Laboratory (GFDL) Modular Ocean Model (MOM5) at nominal 1° resolution (Griffies 2012) as the ocean component. The Los Alamos National Laboratory (LANL) sea ice model, CICE (Hunke et al. 2017), comprises the sea ice component for both models (version 5.1.2 for ACCESS-CM2 and version 4.1 for ACCESSESM1.5). As an Earth System Model, ACCESS-ESM1.5 also uses the CASA-CNP land surface biogeochemistry module and integrates the World Ocean Model of Biogeochemistry and Trophic-dynamics (WOMBAT) into MOM5 (Law et al. 2017; Ziehn et al. 2020a).
Further details of the model configuration, input forcing used and post-processing required for submission of ACCESS model output to the Earth System Grid Federation can be found in Mackallah et al. (2022). Their work also presents a brief overview of global-scale climate and biogeochemistry from the control and idealised experiments (primarily those experiments where atmospheric CO2 was quadrupled or increased by 1% per year). ACCESS-CM2 has a higher climate sensitivity (equilibrium climate sensitivity, ECS = 4.7°C) than ACCESS-ESM1.5 (ECS = 3.9°C), which is documented in Mackallah et al. (2022) alongside climate drift and calculations of effective radiative forcing for human and natural forcings to the climate – from the Radiative Forcing MIP experiments described by Pincus et al. (2016). Contemporary climate variability and change in ACCESS contributions to the historical experiment, including a brief presentation of the single-forcing historical experiments from DAMIP (Gillett et al. 2016), are evaluated in Rashid et al. (2022).
2.2. Data
The data used in this paper are published on the Earth System Grid Federation as part of the CMIP (Dix et al. 2019a; Ziehn et al. 2019a), ScenarioMIP (Dix et al. 2019b; Ziehn et al. 2019b), DAMIP (Dix et al. 2020; Ziehn et al. 2020b) and LUMIP (Ziehn et al. 2021) datasets. The historical experiment runs from 1850 to 2014, with ensemble members branching from different years of the piControl run (50 years apart for ACCESS-CM2 and 20 years apart for ACCESS-ESM1.5). The ScenarioMIP experiments then encompass the period from 2015 to 2100, with some simulations also extending to 2300. Both ACCESS versions have been used to complete the Tier 1 ScenarioMIP cases (ssp126, ssp245, ssp370 and ssp585), where the first digit indicates the Shared Socioeconomic Pathway (SSP) and the remaining digits indicate the 2100 forcing level. For example, ssp126 follows the first SSP, describing a ‘Sustainability’ future pathway, with a 2100 forcing of 2.6 W m−2; SSP2, 3 and 5 follow the ‘Middle-of-the-Road’, ‘Regional Rivalry’ and ‘Fossil-Fuelled Development’ future pathways respectively, with the former considered a medium-forcing scenario and the latter two high-forcing (O’Neill et al. 2016). The lower compute cost of ACCESS-ESM1.5 has allowed larger ensembles to be run, typically 40 members. For ACCESS-CM2, the ensemble size has increased from 5 to 10 for some experiments since table 2 of Mackallah et al. (2022).
Additionally, one Tier 2 scenario has been completed, ssp534-over, an overshoot scenario that branches from ssp585 at 2040, stabilising and then reducing atmospheric CO2 concentration (O’Neill et al. 2016, fig. 3b). Mackallah et al. (2022) indicated that ssp534-over had only been run with ACCESS-CM2, but this case has now been run with both models (one member for ACCESS-CM2 and 40 members for ACCESS-ESM1.5), with ACCESS-ESM1.5 extending to 2300. Both the lowest (ssp126) and highest (ssp585) forcing scenarios have also been run to 2300 for both models (for a single member in ACCESS-CM2 and a ten-member ensemble for ACCESS-ESM1.5).
Some variants of the scenario experiments have only been run with ACCESS-ESM1.5. These include an emissions-driven high-forcing scenario (esm-ssp585), which branches from the esm-hist experiment, and a continuation of hist-bgc with CO2 forcing from ssp585 applied only to the biogeochemistry and not the radiation (ssp585-bgc). Two LUMIP scenarios have been performed in which future land-use change from one scenario has been combined with greenhouse gas concentration forcings from another scenario (ssp585-ssp126Lu and ssp126-ssp370Lu). Finally the COVID pandemic prompted the development of a new set of scenarios (Lamboll et al. 2021), with a 5-year experiment focused on the initial pandemic period (ssp245-covid) and further experiments looking at different recovery scenarios to 2050 (ssp245-cov-strgreen, ssp245-cov-modgreen and ssp245cov-fossil).
2.3. Climate variables
The analysis in Sections 3 and 4 uses selected variables from the CMIP6 dataset listed in Table 1. In Section 3.2, mean Atlantic meridional overturning circulation is defined as the maximum intensity of ocean meridional overturning mass streamfunction (msftmz) at 26°N between 500- and 2500-m depth. Antarctic Bottom Water Formation (AAWBF) is defined as the (negative) maximum intensity of the same variable, south of 60°S between 0 and 3500 m. In Section 3.3, sea ice area (SIA) is calculated as the integral of the ice-covered grid cell area of sea ice concentration (siconc), as opposed to the common metric of sea ice extent (SIE) in which the entire grid cell area is counted, as SIA is a more direct estimate of actual ice coverage than SIE (Notz et al. 2016).
| Variable description | CMIP6 variable name | |
|---|---|---|
| 3-D field of transported CO2 | co23D | |
| Aerosol optical depth at 550 nm | od550aer | |
| Global ocean temperature | thetaoga | |
| Global average thermosteric sea level change | zostoga | |
| Ocean meridional overturning mass streamfunction | msftmz | |
| Precipitation | pr | |
| Sea ice area percentage | siconc | |
| Sea level pressure | psl | |
| Sea surface temperature | tos | |
| Surface air temperature | tas |
3.Future climate evolution and outcomes
3.1. Atmosphere
The temporal evolution of observed GMST (area-weighted global-mean surface air temperature; Fig. 1) has been discussed in many previous studies (e.g. Lean 2018; Hegerl et al. 2019; Rashid 2021; Rashid et al. 2022). Briefly, GMST anomalies (with respect to the 1850–1900 climatology) show an overall warming trend due to increasing greenhouse gases, modulated by multidecadal cooling periods during the 1880s to 1910s and 1940s to 1970s and an accelerated warming after 1975 (Fig. 1a). The earlier cooling was mostly due to a large volcanic eruption in 1883 (Krakatoa) injecting a large volume of aerosols into the stratosphere, reducing incoming solar radiation reaching the surface. The latter cooling period was associated with increased anthropogenic aerosol loading in the troposphere, reinforced by the stratospheric aerosols from the Mount Agung eruption in 1963 (Wilcox et al. 2013). Since 1975, warming has accelerated, which is attributed to a combination of rapidly rising greenhouse gases and gradually declining anthropogenic aerosols, especially in Europe and North America. This combined anthropogenic forcing dominates the historical variation of observed GMST, explaining ~83% of its variance; the remaining variance is explained by a small contribution from volcanic and solar forcing (~2%), internal climate variability from the Pacific and North Atlantic Oceans (~8%), and other sources, including observational uncertainty (e.g. Rashid 2021).
Temporal variation of observed and simulated global-mean (a) surface air temperature and (b) precipitation anomalies across the CMIP6 historical period (1850–2014) and future projection period (2015–2300). HadCRUT4 observations are plotted for 1850–2014 (black curve). The ensemble-mean time series for ACCESS-CM2 (five members) are plotted as solid curves and those for ACCESS-ESM1.5 (40 members) as dashed curves. For the post-2100 period, ACCESS-CM2 data are from a single member, whereas ACCESS-ESM1.5 has ten ensemble members for ssp126 and ssp585 and 40 ensemble members for ssp534-over. The GMST anomalies for observations and ACCESS simulations in (a) were calculated by subtracting the respective 1850–1900 time-means, whereas the GMPr anomalies in (b) were calculated by subtracting the respective 30-year 1985–2014 means (as observed GPCP precipitation data are only available since 1979).
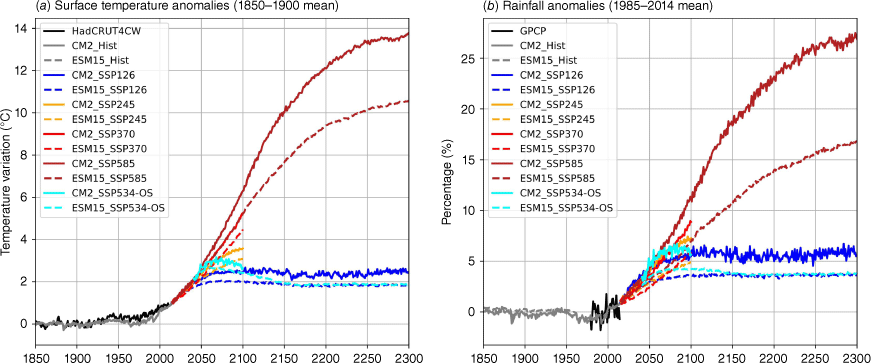
Simulated GMST anomalies largely follow the observed evolution over the historical period, though are somewhat underestimated by both models during the mid- to late-20th Century, largely due to the models’ overestimation of the aerosol-induced cooling, which is common for many CMIP6 models (Rashid et al. 2022). Across the ScenarioMIP experiments, the ACCESS models project a range of GMSTs that largely reflect the emission scenarios, with some differences between the model versions. The lowest warming (of ~2°C by 2100) occurs in ACCESS-ESM1.5, under the low emissions scenario (ssp126), whereas the highest projected warming (>6°C by 2100) occurs in ACCESS-CM2, under the high emissions scenario (ssp585). For each of the four scenarios, ACCESS-CM2 projects slightly higher temperatures than those in ACCESS-ESM1.5 for the corresponding scenarios, due to its higher equilibrium climate sensitivity (Mackallah et al. 2022).
In ssp534-over, in which CO2 and other greenhouse gas emissions undergo a rapid reduction after branching off from the ssp585 scenario at year 2040, GMST continues increasing for around another 30 years before starting to decrease. This continued warming is due to a lag between cessation of emission increases and stabilisation or decline of greenhouse gas concentrations (O’Neill et al. 2016). The temperature overshoot is higher in ACCESS-CM2 than ACCESS-ESM1.5, again because of a higher equilibrium climate sensitivity in the former model. For the same reason, ACCESS-CM2 projects higher GMSTs after year 2100 than ACCESS-ESM1.5 in the ssp126 and ssp585 runs (for which extension runs for both models are available). Extension runs are also available for the ssp534-over scenario for ACCESS-ESM1.5 only, which show that the overshot GMST in this model returns to the same level as that of ssp126 after 2150.
Fig. 1 also shows global-mean precipitation (GMPr) anomalies, as percentage differences of the corresponding 1985–2014 means, for the CMIP6 historical and future projection periods (Fig. 1b). The GMPr anomalies undergo a similar temporal evolution to GMST anomalies (with the maximum increase exceeding 25% of the present day value), as expected from the tropospheric energy balance consideration (e.g. Allen and Ingram 2002), and is most evident for future scenario runs with higher anthropogenic warming. For the historical period (with modest warming), the correlation coefficients between GMST and GMPr evolutions are also modest: 0.37, 0.61 and 0.27 for observations (calculated from 1979 to 2014), ACCESS-CM2 and ACCESS-ESM1.5 simulations (calculated from 1850 to 2014) respectively (see Supplementary Fig. S1). However, correlation coefficients for the scenario runs are 0.99 or 1, except for ssp534-over runs for which they are 0.89 and 0.72 for ACCESS-CM2 and ACCESS-ESM1.5 respectively. The relatively smaller values for the overshoot runs are due to the cooling of temperatures from late 21st Century in this scenario, during which period GMPr changes show a hysteresis behaviour, i.e. where the climate response to decreasing emissions does not mimic the trajectory of the antecedent increasing emissions; see Song et al. (2023). Under scenarios of modest warming, correlation coefficients are smaller in ACCESS-ESM1.5 than ACCESS-CM2 due to relatively higher warming in the latter model.
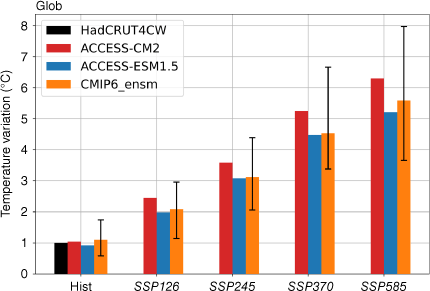
The global warming levels simulated by the two ACCESS models under different emission scenarios are compared with the corresponding levels from CMIP6 ensemble means (Fig. 2). The ACCESS models compare well with observations and CMIP6 ensemble-mean for the historical warming level (~1°C, measured at year 2014), although the CMIP6 ensemble-mean warming is slightly higher than the observed warming. For the four scenarios, ACCESS-ESM1.5 projections (at year 2100) are somewhat cooler than corresponding CMIP6 ensemble-mean projections, whereas ACCESS-CM2 projects consistently higher warming for the scenarios. The differences in projected warming between the ACCESS models and CMIP6 ensemblemeans are, however, much smaller than the corresponding warming ranges (vertical bars) across all CMIP6 models considered here.
Global warming levels in ACCESS-CM2 and ACCESS-ESM1.5 historical and ScenarioMIP experiments, compared with observations and CMIP6 ensemble means. The vertical bars indicate the corresponding CMIP6 ensemble ranges. For observations, the time mean of 2009–2019 is plotted and for the historical and scenario experiments, values for the last year of experiments (2014 and 2100 respectively) are plotted. The single-year values are plotted for model experiments as these are ensemble-mean values and hence are reasonably smooth.
The spatial distribution of mean DJF and JJA surface air temperature (SAT) changes at the end of the 21st Century relative to the end of the historical simulation are examined using ACCESS-CM2 and ACCESS-ESM1.5 models under the high forcing ssp370 scenario (Fig. 3). Both models consistently highlight the most pronounced warming over the Arctic Ocean in the DJF season, attributable to Arctic amplification. This effect extends to adjacent regions, with notably greater warming in northern Europe and northern North America. Generally, continents exhibit more pronounced warming than oceans, due to the larger heat capacity of the latter. In line with this, the Australian continent also experiences greater warming than the surrounding oceans (consistent with historical trends of Australian warming exceeding global-average warming; Grose et al. 2023). Among the world oceans, the Southern Ocean displays the least warming (especially during DJF), in agreement with studies of delayed ocean warming south of 50°S due to subduction of warmed water to the north and upwelling of cold, deeper water further south (Armour et al. 2016). Both ACCESS models exhibit significantly greater warming near the Antarctic continent during the JJA (austral winter) season compared to other regions of the Southern Ocean. This is primarily attributed to the substantial reduction in summer sea ice area by the end of the 21st Century under the ssp370 scenario projection (see Section 3.3.1), delaying autumn and early winter ice growth. In permitting a longer ice-free period during the turbulent flux-intensive austral winter, the warm ocean is free to transfer more heat to the near-surface atmosphere.
Time-mean surface climate change for surface air temperature (a, d, g, j), precipitation (%) (b, e, h, k), and sea level pressure (c, f, i, l) in ssp370. Anomalies are calculated as the difference between the last 30 years of the historical simulation (1985–2014) and the last 30 years of the ssp370 projection period (2071–2100). Ensemble means are calculated from five members for ACCESS-CM2 and 40 members for ACCESS-ESM1.5. For surface air temperature and sea level pressure, stippling indicates significance difference at the 95% confidence level based on a two-sided Student’s t test. For the precipitation (%), stippling denotes regions where the ssp370 or historical significantly differs from one based on a one-sided Student’s t test.
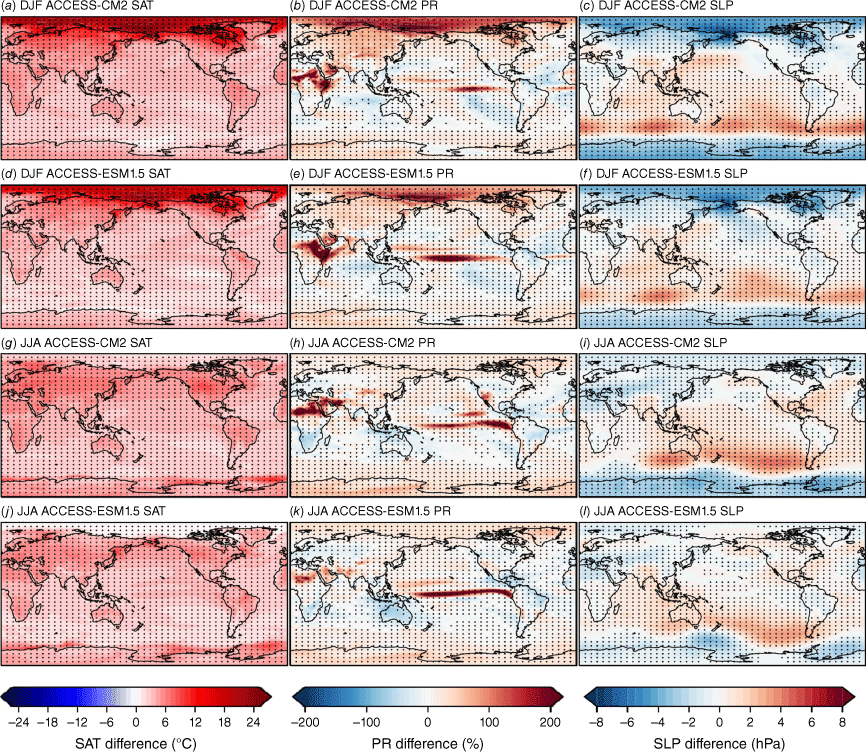
In the context of a fairly uniform tropical ocean warming, precipitation increases north of the equator and decreases to the south, alongside a northward shift of precipitation maxima (not shown); this pattern is potentially indicative of enhanced uplift and moisture content in the air overlying already wet regions, known as the ‘rich-get-richer’ thermodynamic mechanism (Chou et al. 2009). However, when viewed as a percentage of historical means (Fig. 3, middle panel), the most prominent increases of precipitation appear in the tropical Pacific Ocean below the equator, possibly linked to a common model bias producing an excessively cold tongue in the eastern equatorial Pacific (Wu et al. 2022). A remarkable (percentage) increase in precipitation over the Arctic in DJF (boreal winter) in both models is associated with large warming over the region in ssp370. Increased precipitation (in terms of percentage) is also found over tropical Africa and the Middle East. However, due to originally low precipitation in these areas, the actual amount of precipitation changes remain small. Additionally, other oceanic regions exhibit smaller precipitation fluctuations.
In both polar regions, sea level pressure (SLP) declines, most notably over the Arctic region during the boreal winter (DJF, Fig. 3 right panel), in line with the documented effect of regional warming, leading to intensification and poleward displacement of the Atlantic and southern mid-latitude jet streams (Hartmann et al. 2013). By contrast, the largest SLP increase is found over the Southern Ocean, aligning with previous studies attributing similar observed changes in large-scale circulation to increasing greenhouse gas concentrations (e.g. Knutson and Ploshay 2021). A distinct wave number 3–4 pattern of SLP change also emerges (contingent upon the season), which has been linked to an intraseasonal timescale response to atmospheric blocking (Grainger et al. 2017). Most continents exhibit a decline in sea level pressure, which concurs with the pronounced warming seen over landmasses.
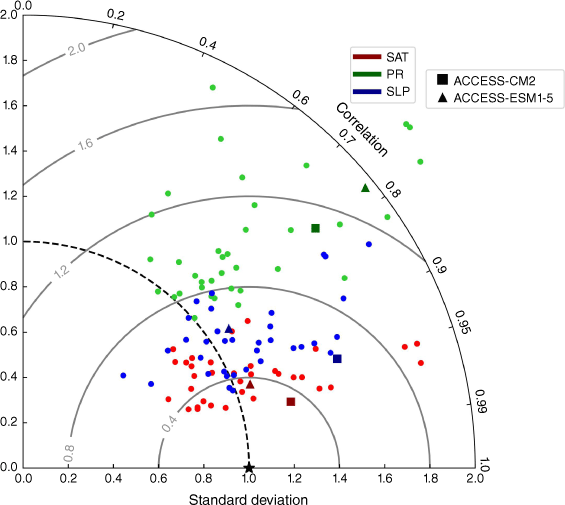
Time-mean global patterns of important variables may be compared with a reference pattern using the Taylor diagram (Taylor 2001). Usually, the reference pattern is computed from observations or reanalysis data, which (obviously) are not available for projections. Hence, we use the CMIP6 ensemble mean as the next best reference dataset for our comparison of ACCESS model projected global warming patterns. The spatial patterns of global warming for the two ACCESS models and CMIP6 ensemble-mean are defined as the difference between the time-means of 2071–2100 and of 1985–2014. Then the spatial standard deviations and pattern correlations needed for the Taylor diagram (Fig. 4) were calculated in the following order: (1) ensemble means of the time-mean differences for individual models; (2) multi-model mean of individual model means; and (3) spatial statistics using quantities in one and two. Among the three variables plotted, the projected changes for surface temperatures in individual models have the closest match with the CMIP6 ensemble-mean reference value, and the changes of precipitation projections match least well. The two ACCESS models compare well with the reference for surface temperatures, although ACCESS-CM2 has more spatial variability than ACCESS-ESM1.5, attributable to the smaller ensemble size in the former (5 vs 40). There is a tendency for the spatial variability to be larger than the reference value (i.e. standard deviation >1) for most models, which is most pronounced for precipitation. This is because the CMIP6 ensemble-mean field, being the mean of a larger ensemble, is a lot smoother spatially than individual model fields and hence tends to have a smaller standard deviation. Precipitation is in general noisier than, e.g. SAT, and so has the largest spatial variability in Fig. 4.
Comparison of spatial variability and correlations of projected changes between ACCESS models and other CMIP6 models on a Taylor diagram using the CMIP6 ensemble-mean as reference (indicated by an asterisk). Projected changes for time-mean SAT, PR and SLP are computed as the difference between the last 30 years of the ssp370 projection period (2071–2100) and the last 30 years of the historical simulation (1985–2014) on the global domain. The dots represent changes in individual models, and two ACCESS models are highlighted with squares and triangles.
A highly significant feature of climate change projections by GCMs is amplified polar warming (APW), wherein the polar regions experience substantially more warming compared to other areas of the globe (Fig. 3). Both observations and CMIP6 climate projections among CMIP5 and CMIP6 models have noted APW (Hahn et al. 2021); Rashid et al. (2022) document a reasonable representation of observed historical APW in the ACCESS models as well. It is well-known that APW shows pronounced seasonal and hemispheric asymmetries with the winter season, with the North Pole dominating this warming phenomenon. Proposed APW mechanisms include surface albedo and lapse-rate feedbacks, as well as increased atmospheric moisture transport (e.g. Hahn et al. 2021).
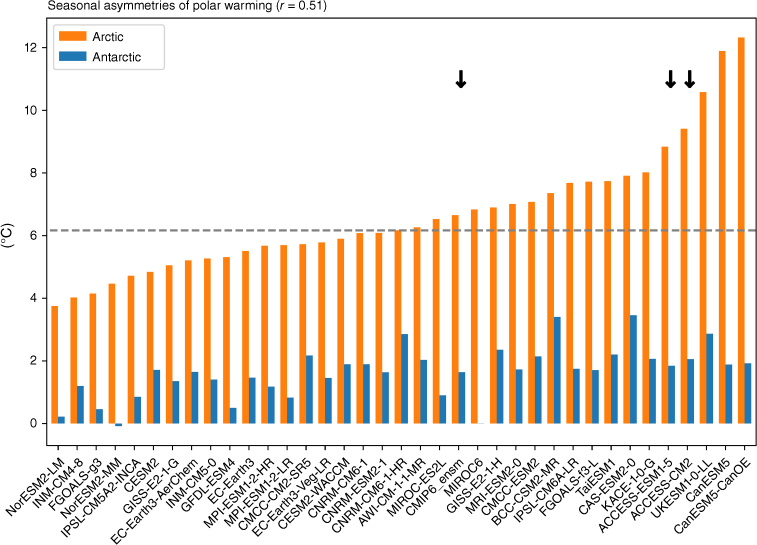
It is of interest to examine seasonally asymmetric APW (winter minus summer) in ACCESS models in comparison to other CMIP6 models. Fig. 5 shows the seasonal and polar asymmetries of APW for 36 CMIP6 models and the ensemble mean, with warming calculated as the difference between the respective last 30 years of SSP-3.70 and historical simulations. The large positive seasonal asymmetries over the Arctic indicate much greater warming in the winter than in the corresponding summer for all models. Asymmetries are also positive though substantially smaller for the Antarctic. In both polar regions, the magnitudes of seasonal asymmetries vary significantly across the models; this variation is most likely due to the differences in the simulated surface albedo feedback (Hahn et al. 2021). The two ACCESS models show similar seasonal asymmetries that are among the highest values shown by this group of CMIP6 models (Fig. 5); interestingly, two other CMIP6 models sharing the same atmospheric model with ACCESS-CM2 (UKESM1-0-LL and KACE-1-0-G) also show similarly high seasonal asymmetries. For the Antarctic, the seasonally asymmetric warming for the two ACCESS models are again higher than the corresponding median value, though less so for ACCESS-ESM1.5.
Seasonal asymmetries (winter minus summer) of polar warming in ACCESS-CM2 and ACCESS-ESM1.5 models, compared to other CMIP6 models. Polar warming is defined as the difference between 2071–2100 and 1985–2014 means of polar averaged SAT anomalies from ssp370 and historical runs respectively. The respective polar averages were taken over the regions bounded by the 65°N and 65°S latitude circles. Results are shown for the Arctic and Antarctic regions. The down arrows indicate the seasonal warming asymmetries for CMIP6 ensemble mean and two ACCESS models. The dashed horizontal line indicates the median seasonal warming asymmetry over the Arctic (which differs from the seasonal asymmetry of the ensemble mean).
Global mean temperatures (Fig. 1) are similar across the first decades of all scenarios despite carbon emission trajectories that deviate significantly from 2020. The ssp126 has decreasing emissions, whereas ssp245 approximately stabilises and only ssp370 and ssp585 continue to grow, such that 2040 emissions are ~25, 40, 60 and 70 Pg CO2 year−1 respectively. However, although emissions differ substantially, deviation of the atmospheric CO2 trajectories is slower. The CO2 concentrations vary by only ~80 ppm across these scenarios in 2040 (O’Neill et al. 2016). Another factor influencing the near future temperature is the different aerosol forcing across scenarios. Sulfur and black carbon emissions are largest in the ssp370 scenario, remaining at or above 2015 levels in 2040. For the other scenarios considered here, sulfur and black carbon emissions are lower in 2040 than 2015 with the largest reduction in ssp126 and intermediate reductions in ssp245 and ssp585.
Fig. 6 shows the ensemble mean global mean temperature anomaly, precipitation anomaly and aerosol optical depth at 550 nm for 2015–2055. The overshoot scenario (ssp534-over) is not shown since it only deviates from ssp585 in 2040. The larger ensemble for ACCESS-ESM1.5 allows better differentiation of the scenarios, with the high emissions case showing more warming than the other scenarios from c. 2030 and the low emissions scenario showing less warming from c. 2040. For precipitation, ssp370 shows the lowest rainfall over the first 40 years of the scenario, with ssp126 giving the highest precipitation from c. 2025–2040. The aerosol optical depth shows these two scenarios as the extreme cases, with ssp370 having the largest aerosol loading and ssp126 the lowest. The difference in aerosol optical depth between the two ACCESS versions is likely due to the different aerosol schemes used in the two models.
Ensemble mean global mean anomalies of surface air temperature (a, b), precipitation (c, d) and aerosol optical depth (e, f) for ACCESS-ESM1.5 (left column) and ACCESS-CM2 (right column). Anomalies are relative to the 1850–1899 period mean.
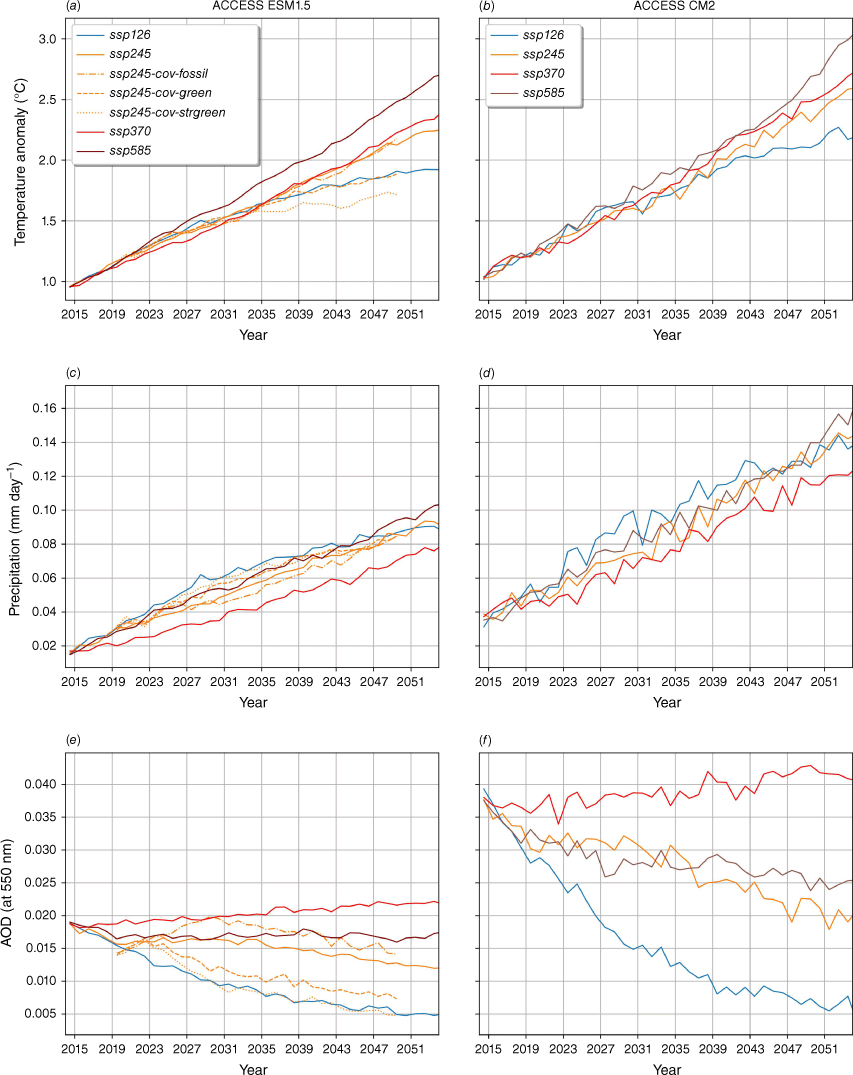
Fig. 6 also shows three CovidMIP (Lamboll et al. 2021) recovery cases for ACCESS-ESM1.5. The three CovidMIP scenarios all begin with reduced emissions in 2020–2021 and then follow three different recovery trajectories: one assumes that recovery is driven by additional fossil emissions ssp245-cov-fossil, whereas the other two assume different levels of additional investment in green technology (ssp245-cov-modgreen and ssp245-cov-strgreen). The ssp245-cov-strgreen case results in emissions closer to the SSP1-1.9 scenario (which has not been run with either ACCESS configuration). The fossil-fuel recovery case shows very similar global temperature to the standard ssp245 scenario but slightly lower precipitation and higher aerosol optical depth. The moderate and strong green recovery cases show lower temperatures from c. 2040, following the ssp126 scenario for the moderate green case and even lower for the strong green case. Both show slightly higher precipitation and lower aerosol optical depth, close to the ssp126 scenario.
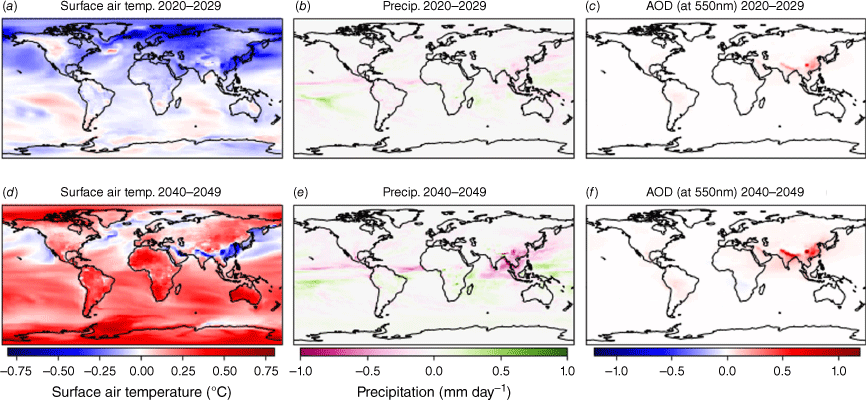
Comparing the ssp370 and ssp126 scenarios for ACCESS-ESM1.5 shows the impact of the different aerosol forcing. Fig. 7 shows difference maps for SAT, precipitation and aerosol optical depth (at 550 nm) for 2020–2029 and 2040–2049. For 2020–2029, ssp370 is cooler than ssp126 through most of the northern hemisphere (NH) due to the higher aerosol optical depth in ssp370. However, by 2040–2049, the impact of higher greenhouse gases in ssp370 now dominates, with positive temperature differences in almost all regions except China and north India along the southern edge of the Tibetan plateau. The regions of negative temperature difference closely match the regions of higher aerosol optical depth in ssp370 relative to ssp126, showing the cooling effect of the higher aerosol forcing. Differences in precipitation between the two scenarios are larger in 2040–2049 than in 2020–2029. Most prominent is a reduction in precipitation around China and into South-East Asia in ssp370 relative to ssp126, implying that locally higher aerosol results in regional drying. There are also changes in precipitation across tropical oceans that suggest a small shift in the intertropical convergence zone.
Difference maps of ensemble mean 2020–2029 (a) near surface temperature, (b) precipitation and (c) aerosol optical depth at 550 nm; (d–f) the same again for the period 2040–2049. Values are expressed as anomalies with respect to the 1850–1899 period mean.
These results show some similarity to the analysis of a related CMIP6 AerChemMIP experiment in which the ssp370 scenario is run with lower near-term climate forcers (NTCF) as in ssp126 (Allen et al. 2020). By comparing the standard and low NTCF ssp370 simulations, Allen et al. (2020) are able to isolate the impact of the NTCF whereas the analysis here encompasses both differences in NTCF and greenhouse gases. Nevertheless, the differences in global temperature and precipitation in the initial 10–15 years of the scenarios (ssp370 and ssp126) appear to be broadly similar to the differences reported in Allen et al. (2020) when it would be expected that the NTCF impact would dominate. Allen et al. (2020) also tend to see larger differences in Asian regions for precipitation and their larger temperature differences are more widespread across the northern mid-high latitudes, similar to Fig. 7a.
3.2. Ocean
Sea surface temperature (SST) is a fundamental climatic indicator of the ocean, with critical impacts on the Earth’s climate and climate variability through air–sea interactions that control the heat, water and momentum exchange between the ocean and atmosphere. Under global warming, the ocean absorbs the vast majority (91% as per IPCC AR6; Fox-Kemper et al. 2021) of the excess heat from greenhouse gas emissions, initially warming the ocean surface before undergoing regional redistribution into the ocean interior and ocean basins (Bindoff et al. 2019). Owing to the large heat capacity of the ocean, and its vast coverage of the global surface, SST changes in response to global warming forcing largely regulate the evolution of SAT at various scales (as discussed in Section 3.1).
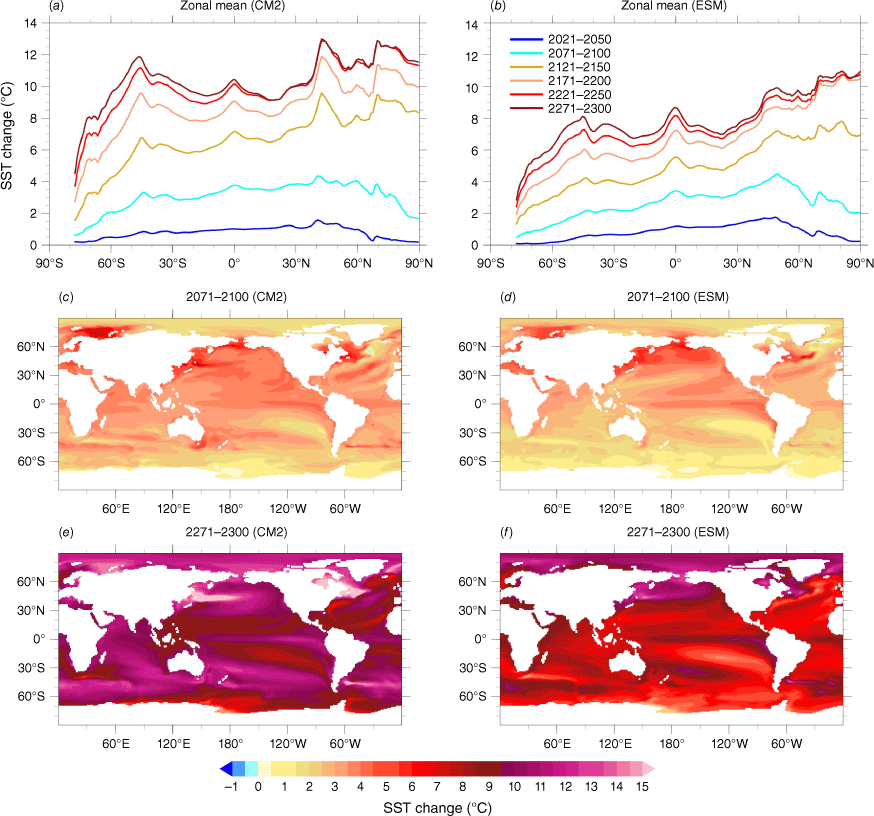
Fig. 8 shows the SST changes relative to the present day state for six selected periods projected by the two ACCESS models under the most optimistic (ssp126) scenario. Displayed in the top panels, (a) and (b) are the zonal mean change of SST for 30-year means, 50 years apart in CM2 and ESM1.5 respectively. In the CM2 case, SST increases noticeably in all latitudes by the middle of this century, with the largest warming (over 1.5°C) in the NH (~40°N and 50°N), which is approximately twice the largest warming seen in the southern hemisphere (SH) mid-latitudes. By the end of this century, sea surface warming is significantly enhanced in all latitudes except the polar regions, where sea ice presence inhibits SST change. The largest warming (>2.2°C) still occurs at ~50°N, and the SH mid-latitudes warm by more than 1.2°C. The spatial pattern of the 2071–2100 mean SST change presented by Fig. 8c shows that the largest warming seen at ~50°N may be largely attributable to the Labrador Sea in the North Atlantic ocean, where the largest warming reaches over 7°C; this is mainly associated with the dramatic Arctic sea ice decline reducing cold water flow (from summer ice melt) into that region.
The ssp126 SST changes (°C) relative to 1985–2014 average. (a, b) Zonal mean for six 30-year periods (2021–2050, 2071–2100, 2121–2150, 2171–2200, 2221–2250 and 2271–2300); (c, d) 2071–2100 average; and (e, f) 2271–2300 average for ACCESS-CM2 and ACCESS-ESM1.5 respectively. Note, ACCESS-ESM1.5 has (the first) ten members of each ensemble runs used for the calculations whereas ACCESS-CM2 just counts the first member of each run because ACCESS-ESM1.5 and ACCESS-CM2 have only ten and one member(s) respectively, covering the ssp126 2100–2300 extension. All calculations have the piControl climate drift removed accordingly.
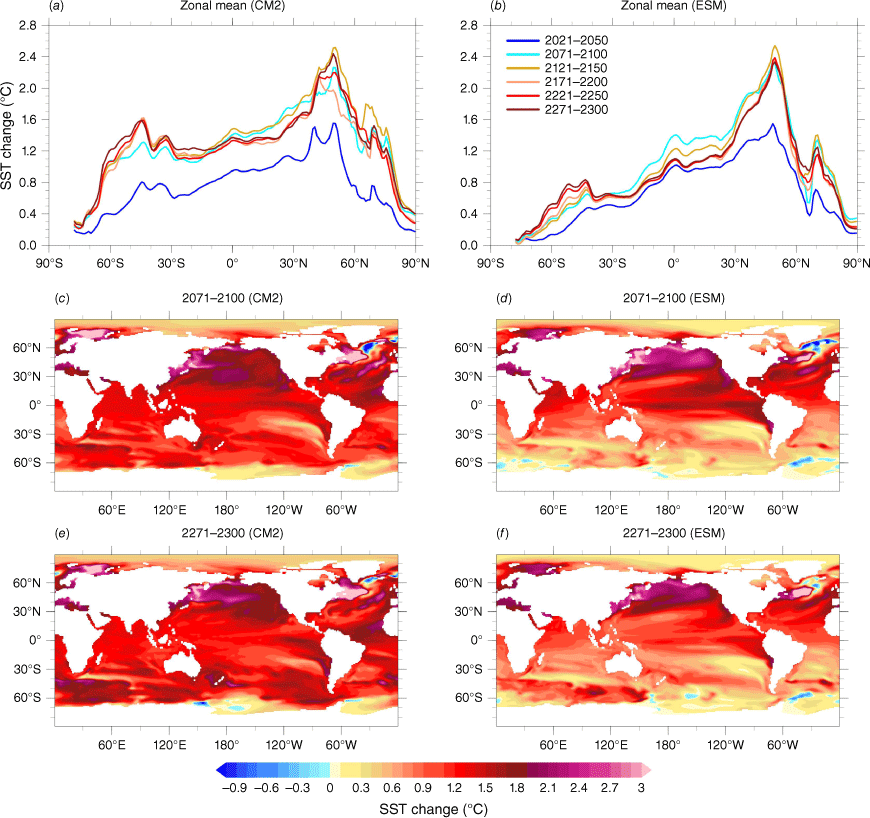
For the four periods selected from the 2101–2300 extension, the zonal-mean SST changes are all generally close to the 2071–2100 level, except for the SH mid-latitudes where already large warming is further increased to >1.6°C. This may indicate that the ocean surface has primarily stabilised by the end of this century under the forcing in ssp126. It should be noted that the ‘curve-intertwining’ after 2100 may indicate that the ocean surface has primarily stabilised by the end of this century under the forcing in ssp126 with any remaining differences after 2100 largely due to multi-decadal variation of the zonal SSTs. Fig. 8e shows the pattern of SST change for the period 2271–2300, which is very similar to that presented in (c), particularly over the NH, confirming the stabilisation of the ocean surface thermal state. The Southern Ocean warming is intensified though, consistent with the zonal mean difference in the SH mid-latitudes after 2100 noted above.
The SST response to ssp126 forcing in ACCESS-ESM1.5 contrasts with that of ACCESS-CM2, particularly in the Southern Ocean (Fig. 8b). Firstly, the SST change near the Antarctic coastline is small in ACCESS-ESM1.5 for all selected periods, due to significantly greater sea ice presence around Antarctica than ACCESS-CM2 (especially in summer, see Section 3.3), which efficiently constrains SST change. Secondly, the SST increase over the Southern Ocean (indeed, the SH as a whole) is remarkably less than that seen in ACCESS-CM2. This may also be partially attributable to Antarctic sea ice, which cools the ocean surface during its seasonal ice melt. Thirdly, in ACCESS-ESM1.5, the ocean surface stabilises noticeably earlier than in ACCESS-CM2 in most regions (except NH mid-latitudes), as evidenced by the reasonably close agreement between the 2021–2050 curve and the later curves in ACCESS-ESM1.5. We note that the tropics have the largest change in 2071–2100 and then drop back more noticeably in ACCESS-ESM1.5 than ACCESS-CM2, and the Southern Ocean continues to warm due to gradual melting of sea ice around Antarctica in ACCESS-ESM1.5. The exceptional NH mid-latitudes, centred at 50°N, reach the largest warming (~2.4°C) by the end of this century and stay at that level throughout the following 200-year extension. This large SST change stands out mainly because of the extreme warming of above 7°C occurring in the Labrador Sea as shown in Fig. 8d, f and discussed above. It is worth noting that, in Fig. 8, both the zonal mean curves and spatial patterns for ACCESS-ESM1.5 look smoother due to its ten-member ensemble mean, whereas the ACCESS-CM2 results comprise a single member.
In contrast to the outcomes under the relatively optimistic ssp126, zonal mean SST changes projected by the two models under the most pessimistic scenario ssp585 evolve continuously across the entirety of the simulation, due to the far more aggressive forcing (Fig. 9). It is not until near the end of the 200-year extension that the ocean surface thermal state reaches (quasi-)stabilisation for both models. As the sea ice disappears very quickly (see Section 3.3), the ocean surface is exposed, permitting a more dramatic increase in SST. In fact, for ACCESS-ESM1.5, the Arctic Ocean undergoes the largest zonal mean warming of over 11°C by 2300. For ACCESS-CM2, however, the largest zonal mean warming (~13°C) occurs at just north of 40°N, largely attributable to the long band of extreme warming in the North Pacific Ocean (east of Japan) where the maximum SST increase is as high as 22°C (Fig. 9e). In ACCESS-ESM1.5, the same localised extreme warming reaches a maximum SST change of 15°C (Fig. 9f). The maximum is associated with the cutoff of cold water (due to sea ice melting in the north) flowing into that region. In general, by the end of 2300, we see quite similar spatial patterns of SST changes over the global ocean in the two models, but the warming in ACCESS-ESM1.5 is 2–3°C milder in most regions than in ACCESS-CM2, especially in the SH.
As the atmosphere warms under global warming, more heat is absorbed through the underlying ocean surface and transferred into the ocean interior through ocean circulation, convection and diffusion; as a result, the world oceans absorb the majority of the excess heat trapped in the atmosphere due to greenhouse warming. The greatest ocean warming occurs in the SH, which causes the subsurface melting of Antarctic ice shelves and a series of subsequent long-term consequences including sea level rise due to water mass increase in the ocean.
Fig. 10a, b show the ensemble mean of global ocean temperature rise (volume-weighted) simulated across the historical period and five scenario runs for ACCESS-ESM1.5 and ACCESS-CM2 respectively. The two models, particularly ACCESS-CM2, do not show any noticeable change in thermal state of the world ocean for most of the historical period. It is not until c. 2000 that the ocean warming starts to increase steadily, and by 2014 (i.e. the end of the historical experiment), the world oceans of ACCESS-CM2 and ACCESS-ESM1.5 have been warmed by 0.04 and 0.06°C respectively. All of the following scenario runs continue this warming trend, and the two models project very similar ocean warming by the end of this century. In fact, ACCESS-CM2 projects an ocean warming by 2100 of 0.31, 0.40, 0.48, 0.56 and 0.36°C for ssp126, ssp245, ssp370, ssp585 and ssp534-over respectively, whereas the corresponding ocean warming projected by ACCESSESM1.5 is 0.34, 0.43, 0.50, 0.56 and 0.40°C under the five scenarios, which is generally slightly larger than in the ACCESS-CM2 cases (except for ssp585).
Timeseries from historical and five ScenarioMIP simulations of (a, b) annual mean global ocean warming (°C) in ACCESS-CM2 and ACCESS-ESM1.5 respectively (c, d) sea surface level rise (m) due to thermal expansion of ocean water, (e, f) Atlantic Meridional Overturning Circulation (Sverdrups, Sv, where 1 Sv = 1 ×10⁶ m3 s−1), and (g, h) Antarctic Bottom Water Formation (Sv) in ACCESS-CM2 and ACCESS-ESM1.5 respectively. Values are relative to the 1850–1900 average. All curves are detrended by removing the (quasi-linear) climate drift observed in the piControl run over the period 1850–2300 for both models respectively. Note that ssp126 and ssp585 projections are extended to 2300 in both models (ten ensembles each for ESM1.5 and one each for CM2), and ssp534-over extended to 2300 too in ACCESS-ESM1.5 (40 members). Inset in each panel highlights the projected evolution of the variable over the second half of this century.
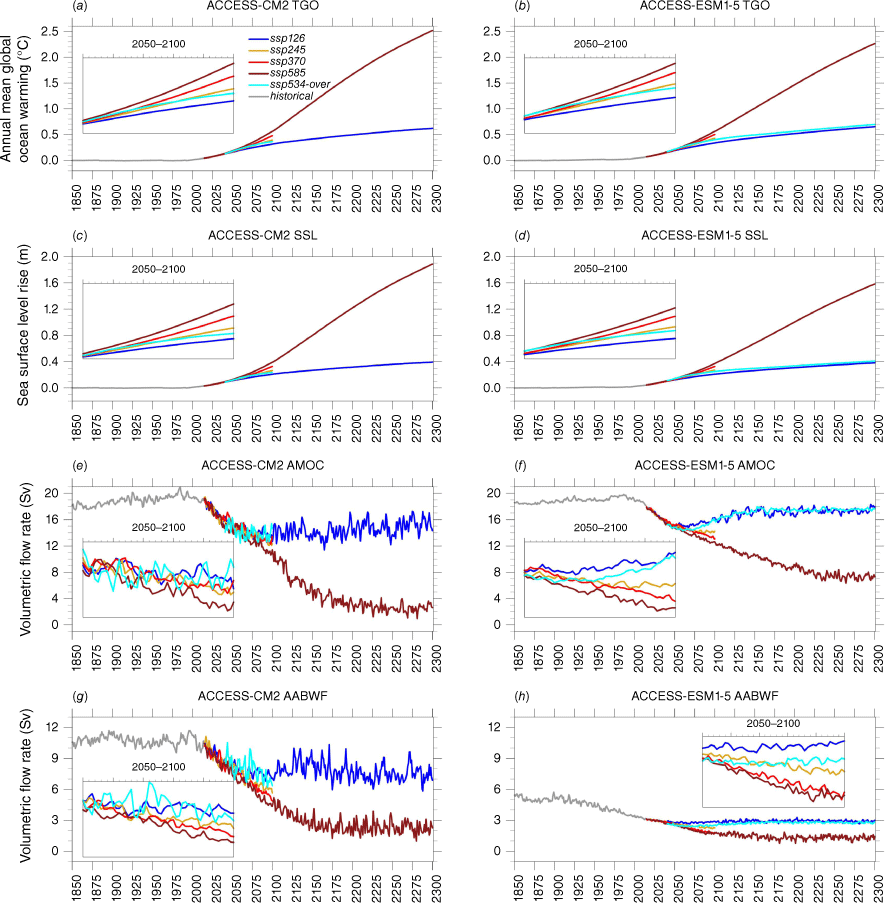
For the available extensions of the scenario runs beyond 2100 (i.e. ssp126 and ssp585 for ACCESS-CM2, and ssp126, ssp585 and ssp534-over for ACCESS-ESM1.5), forcing under ssp126 leads to similar ocean warming (~0.53°C) in both models by the end of 2300, whereas ssp585 results in 2.5°C ocean warming in ACCESS-CM2, which is ~0.25°C higher than in ACCESSESM1.5. Notable is the ocean warming evolution during the ssp534-over extension with ACCESS-ESM1.5, which stays very close to the ssp126 extension for much of the run, showing only a small long-term impact of early-stage larger surface warming (i.e. 2041–2150, as seen in Fig. 1a).
As changes in sea level result from both ocean density changes (steric sea-level change) and the exchange of mass (barystatic sea-level change) between ocean and cryosphere–land, one of the direct impacts of ocean warming is that, due to thermal expansion of ocean water, sea level rise can occur. The evolution of the steric sea level rise simulated by ACCESS-CM2 and ACCESS-ESM1.5 is presented in Fig. 10c, d. Clearly, the steric sea level changes align with the global ocean temperature changes shown in Fig. 10a, b, in agreement with findings of previous research that global mean steric sea-level change is nearly entirely contributed by global mean thermal expansion, since global mean halosteric (i.e. salinity) change is much smaller (e.g. Gregory et al. 2019). Both models produce similar steric sea level rises by the end of this century: 0.21/0.21 m (ssp126), 0.26/0.27 m (ssp245), 0.33/0.33 m (ssp370), 0.39/0.37 m (ssp585) and 0.24/0.24 m (ssp534-over) for ACCESS-CM2/ACCESS-ESM1.5. Steric sea level rise in the extended scenario runs are also in line with the projected ocean warming discussed above, with increases by 2300 of 0.40/0.40 m (ssp126), 1.89/1.58 m (ssp585) and –/0.41 m (ssp534-over) for ACCESS-CM2/ACCESS-ESM1.5 respectively.
Another consequence of ocean warming, which generally weakens from surface to the depths, is an increase in vertical density gradients and thus enhanced ocean stratification. This results in weakening of the global meridional overturning circulation (GMOC). GMOC is an important component of the Earth’s climate system, featured by the intertwined pathways for the surface-ventilated North Atlantic Deep Water (NADW), Antarctic Bottom Water (AABW) and the diffusively formed Indian Deep Water and Pacific Deep Water. It functions as a conveyor belt connecting the surface ocean and atmosphere with the interior ocean. In our models, GMOC is presented by the vertical indefinite integral of zonally integrated mass transport of the global ocean. The Atlantic meridional overturning circulation (AMOC) is arguably the most important part of the GMOC. It is a result of both atmospheric and thermohaline drivers, characterised by a northward flow of warm, salty water in the upper layers of the Atlantic, and a southward flow of colder, deep waters (McCarthy et al. 2017).
Specifically, global warming weakens the AMOC (e.g. Hawkins et al. 2011; Rahmstorf et al. 2015; Weijer et al. 2019) through changing the ocean surface thermohaline state (warming and freshening due to increased freshwater into ocean from sea ice melting, and ice sheet melting in real world) and ocean heat content increase that is distributed more in the upper ocean than the deep ocean. The evolution of annual mean AMOC mass transport through 26°N (AMOC-26N) simulated in ACCESS-CM2 and ACCESS-ESM1.5 is shown in Fig. 10e, f. Both models simulate a slight increase of AMOC-26N from 1850 to c. 1980 and thereafter a noticeable weakening, but the intensity is within the range of 17–21 Sverdrups (Sv, where 1 Sv = 1 × 10⁶ m3 s–1) during the historical runs, which agrees well with the RAPID array at 26°N observation (Smeed et al. 2018) that gives the range of 17–20.5 Sv before 2008. However, neither model simulates the observed ‘sudden drop’ of AMOC-26N (to a minimum of 12 Sv) in 2008–2010 and the recovery after 2010 (Smeed et al. 2018). We note that ACCESS-CM2 shows large interannual variability of AMOC-26N, which is in better agreement with observations than ACCESS-ESM1.5, but it may also be mostly due to the smaller ensemble size of ACCESS-CM2.
For ACCESS-ESM1.5, all the scenarios show continuous weakening of AMOC-26N nearly uniformly for several decades. At 2050 the AMOC-26N for each of the scenarios begin to diverge, with continued weakening in ssp245, ssp370 and ssp585 to the end of this century. As anticipated, AMOC transport is reduced the most under ssp585 and shows no sign of recovery. However, under ssp126 and ssp534-over, AMOC weakening stops after 2050 and starts recovering in the last few decades, especially for the ssp534-over case. By contrast, all scenario runs in ACCESS-CM2 see steady weakening of AMOC-26N towards the end of this century, and in ssp585 results in a bigger reduction of AMOC-26N (down to 10.5 Sv) than in ACCESS-ESM1.5 (12.5 Sv) by 2100. In comparison with the present day level (1985–2015), ACCESS-CM2 and ACCESS-ESM1.5 project ~45 and 35% weakening of the AMOC transport by 2100 respectively, both within the range of 35–45% estimated by Weijer et al. (2020) based on an ‘emergent relationship’ among the majority of models between AMOC strength and RAPID observations.
The AABWF cell, adjacent to Antarctica and at ~68°S, at 1000-m depth, is another important part of the GMOC. It is connected to the abyssal cell, which is centred ~3500-m depth and extends from Antarctica into the NH, ventilating the abyssal ocean with the cold and fresh AABW. Fig. 10h shows that, across the historical experiment, ACCESS-ESM1.5 simulates an AABWF of ~5 Sv in the first 70 years (i.e. until 1920), but after that, it sees slow but steady weakening of AABWF (down to ~3 Sv by 2014). However, in ACCESS-CM2 (Fig. 10g), the AABWF cell strength stays at ~11 Sv to the end of the historical simulation, with notable decadal variability. For the projection runs, ACCESS-ESM1.5 simulates a similar weakening of the AABWF cell under the ssp370 and ssp585 scenarios, at approximately the same rate of decrease as that driven by the historical forcing after 1920. The ssp245 scenario also forces a constant weakening of the AABWF cell until 2100 but at a lower rate. Under the other two scenarios, ACCESS-ESM1.5 sees a short period of slight weakening followed by a stabilisation of the AABWF cell. For ACCESS-CM2, the AABWF cell is evidently weakening all the way to the end of this century under all the scenarios, with the largest reduction of AABWF in ssp585 (down to ~4.3 Sv); however, this is still stronger than AABWF at 2100 in ACCESS-ESM1.5.
Under the extended ssp126 forcing, ACCESS-CM2 projects a stabilising AABWF cell and a slowly recovering AMOC through the course of the 200-year run, with a similar response in ACCESS-ESM1.5. It is noted that the ssp534-over scenario in ACCESS-ESM1.5 leads to an almost identical response of AMOC and AABWF as that seen under the ssp126 forcing. The extended ssp585 scenario in ACCESS-CM2, however, eventually leads to catastrophic damage to the AMOC transport and AABWF, the two most important components of the world ocean conveyer belt. They are both reduced to a residual level (compared to their normal ‘operational’ intensity) and may be deemed as practically shut off. For ACCESS-ESM1.5, AAWBF is already approximately half the strength of the cell in ACCESS-CM2 at the start of the historical period, and under ssp585 forcing, reduces to 1–2 Sv soon after 2100, where it remains through the extension. The ssp585 extension also shows dramatic reduction in the AMOC, though not as devastating as that in ACCESS-CM2; the remnant may still function, however, very inefficiently.
3.3. Sea ice
Inconsistent reproduction of observed mean and contemporary sea ice conditions among CMIP models is a long-standing issue (e.g. Arzel et al. 2006; Turner et al. 2013; Shu et al. 2015, 2020; Schroeter et al. 2018, among many others). However, ACCESS-CM2 and ACCESS-ESM1.5 often score highly among the CMIP cohort in metrics of Arctic sea ice, such as climatological average, seasonal cycle, multiyear linear trend and detrended standard deviation (Notz et al. 2016; Long et al. 2021). For the period between 1979 and 2014, ACCESS-ESM1.5 ranks among a small subset of models with climatological Arctic SIE within 0.5 × 10⁶ km2 of observation-based estimates year-round (Ziehn et al. 2020a; Long et al. 2021), and Arctic SIE biases in ACCESS-CM2 are also smaller than the CMIP6 ensemble mean (Long et al. 2021). ACCESS-CM2 is one of the only models able to capture both a plausible rate of both Arctic sea ice loss and global mean temperature change (Notz et al. 2016). In the SH, by comparison, both ACCESS-CM2 and ACCESS-ESM1.5 produce substantial negative biases in their representation of mean and contemporary historical sea ice cover. Although ACCESS-ESM1.5 approximately captures observed minimum Antarctic SIE across the historical period, it greatly underestimates maximum SIE (Rashid et al. 2022). ACCESS-CM2 has larger negative climatological Antarctic SIE biases than ACCESS-ESM1.5 largely due to overly warm SATs over the Antarctic continent and surrounding ocean, leading to heightened SSTs that inhibit summer ice presence. A negative trend in Antarctic SIE in ACCESS-CM2 commences in the mid-20th Century, and by the commencement of the satellite sea ice concentration record in 1979, simulated SIE is already ~2.0 × 10⁶ km2 below both minimum and maximum observed SIE.
At the turn of the 21st Century, Arctic sea ice cover is larger in ACCESS-CM2 than in ACCESS-ESM.5 due to cold-biased winter SATs (Rashid et al. 2022). However, the higher climate sensitivity of ACCESS-CM2 produces a much more rapid sea ice decline, with all scenarios reaching the ‘ice-free summer’ threshold of <1.0 × 10⁶ km2 (e.g. Notz et al. 2016) before 2040 (Fig. 11a). The higher-emission scenarios lose summer cover entirely soon after, whereas ssp126 and ssp534-over oscillate between ice-free and a small amount of summer ice presence for the remainder of the century. In ACCESS-ESM1.5, by comparison, ice-free summer Arctic conditions are only reached after 2040, first in the high-emission ssp585 and the overshoot ssp534-over, and the remaining experiments following in the ensuing decades (Fig. 11c). As in ACCESS-CM2, the two higher-emission scenarios lose summer ice entirely in the latter half of the century, with ssp245 on a similar trajectory. Although the aggressive-mitigation scenario, ssp126, does become ice-free in summer shortly after 2050, it quickly stabilises just under the threshold; ssp534-over begins a slow rebound after 2060 but remains well below the threshold and the level of ssp126 by 2100.
Annual minimum (summer: a, c, e, g) and maximum (winter: b, d, f, h) sea ice area (SIA) in historical and ScenarioMIP experiments in ACCESS-CM2 and ACCESS-ESM1.5 in the northern (NH: a–d) and southern (SH: e–h) hemispheres. Purple line in (a) and (c) indicates ‘ice-free’ Arctic summer conditions of 1.0 × 10⁶ km2. Note the y axis is inverted to show ’sea ice loss’ in line with increasing temperatures.
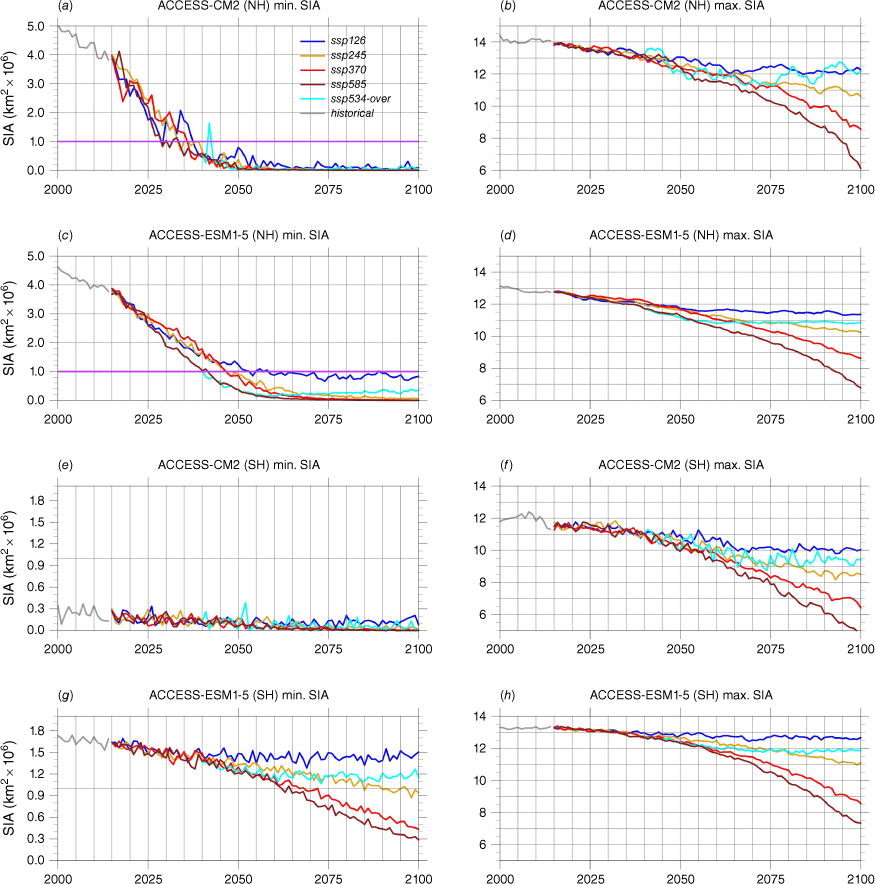
Despite higher-than-average warming of Arctic surface temperatures during the winter, the decline of Arctic winter SIA is fairly slow and scenario independent over the first half of the century. As temperatures diverge more strongly in the latter half of the century, however, sea ice declines also accelerate according to scenario (Fig. 11b, d). Under rapidly increasing temperatures, winter SIA in ssp585 declines by more than 55% by the end of the century in ACCESS-CM2, whereas in ssp534-over it rebounds after 2075, stabilising close to ssp126 levels (~1.0 × 10⁶ km2 or ~15% less than historical cover). In ACCESS-ESM1.5, both ssp126 and the overshoot stabilise soon after 2050, but the overshoot remains ~1.0 × 10⁶ km2 below ssp126 by 2100 (Fig. 11d). Just over half of historical SIA remains in ssp585 at the end of century, and 65% remains in ssp370; though large, these losses are proportionately smaller than losses in high-emission scenarios in ACCESS-CM2.
In the SH, where ocean heat content contributes substantially to spring sea ice retreat (Gordon 1981), both models produce warm SST biases and lower-than-observed climatological sea ice, as detailed in Ziehn et al. (2020a) and Bi et al. (2020). Despite lower warming levels during DJF relative to the Arctic (see Fig. 3), Antarctic summer sea ice declines are substantial over the 21st Century. In ACCESS-CM2, summer SIA is already dramatically low (<0.5 × 10⁶ km2) at the start of the century, and all scenarios continue declining to zero or near-zero summer ice values as air temperatures increase (Fig. 11e). In ACCESS-ESM1.5, by comparison, Antarctic summer SIA starts from a larger historical mean, and SIA decline is more scenario-dependent (Fig. 11g). The highest-forcing pathways, ssp585 and ssp370, lose ~80 and 75% of summer ice presence respectively, with sea ice cover well under 0.5 × 10⁶ km2 by 2100. Even the medium-range scenario ssp245 declines to nearly half of historical SIA by 2100, on a trajectory that implies continued losses into the next century. The lowest forcing scenario, ssp126, stabilises circa mid-century having lost nearly 15% of historical SIA, and the overshoot also stabilises soon after diverging from ssp585 c. 2060, with SIA approximately 0.35 × 10⁶ km2 lower than ssp126.
At the start of the century, winter Antarctic SIA is ~1.5 × 10⁶ km2 larger in ACCESS-ESM1.5 (Fig. 11h) than ACCESS-CM2 (Fig. 11f). Under ssp126 and the overshoot, winter SIA stabilises in the last decades of the 21st Century in both models, with losses of 5% SIA in ACCESS-ESM1.5 and 15% SIA in ACCESS-CM2 under ssp126 and an additional 6% loss in ssp534-over. Declines in the medium-range scenario slow towards 2100, implying SIA may stabilise early in the following century, whereas the trajectories of ssp370 and ssp585 suggest continued losses in the decades ahead. Indeed, winter ice presence under high-emission ssp585 reduces very quickly across the 21st Century, with an accelerating rate of decline in both models resulting in retention in 2100 of only 42% of historical winter SIA in ACCESS-CM2 and 55% in ACCESS-ESM1.5, reducing from ~12.0 × 10⁶ to just under 5.0 × 10⁶ km2 (and 13.0 × 10⁶ to 7.0 × 10⁶ km2 in ACCESS-ESM1.5) across the century.
Disparate hemispheric responses of high-latitude surface air temperatures and sea ice emerge over the longer term in the extensions of ssp126, ssp534-over (for ACCESS-ESM1.5) and ssp585 (shown as anomalies from the 1985–2014 mean in Fig. 12 – note the y axis has been inverted for SIA to imply loss under rising temperatures). As discussed in Section 3.3, summer sea ice is eliminated in the Arctic circa the mid-21st Century in all scenario experiments. Summer SIA appears to respond sharply to increasing winter SAT, suggesting an amplifying feedback wherein rapidly retreating spring ice cover produces a longer open-ocean period during which the low-albedo ocean surface absorbs more solar radiation and warms; autumn ice growth is progressively inhibited and additional ocean–atmosphere heat transfer during the darker months then further increases winter SAT. However, as Arctic winter SAT declines in response to reducing emissions across the 22nd and 23rd Centuries, summer sea ice presence likewise begins to rebound. This occurs most extensively in the ACCESSESM1.5 ssp534-over extension, where SIA eventually stabilises at approximately the same level as in ssp126, demonstrating reversibility of the additional commitment of temperature change under ssp534-over.
Annual minimum (summer) and maximum (winter) surface air temperature (SAT, solid lines) and sea ice area (SIA, dotted lines) anomalies in historical and (a–b) ssp126, (c–d) ssp534-over, and (e–f) ssp585 ScenarioMIP experiments in (a, c, e) ACCESS-CM2 and (b, d, f) ACCESS-ESM1.5 in the northern and southern hemispheres. Anomalies are calculated from the 1985–2014 mean.
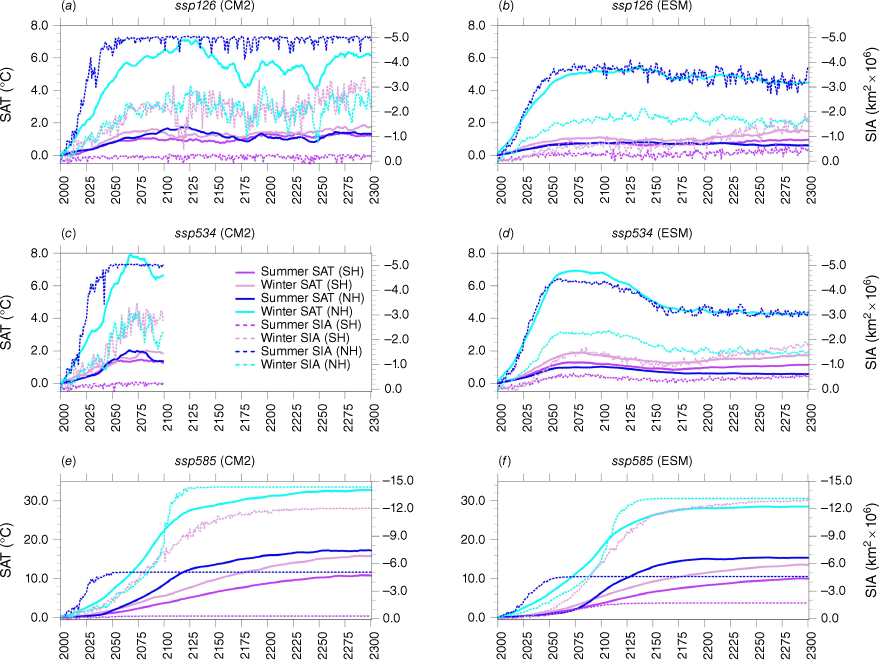
Sea ice in the SH, in comparison, shows the opposite response. Both SAT and winter ice in ssp126 and ssp534-over reach their lowest point prior to 2100, even showing a tendency to rebound over the 22nd Century; however, as warming accelerates in the Southern Ocean near the end of the 22nd Century (Fig. 8), a second Antarctic sea ice decline commences, continuing through to the end of the extension. The effect is consistent between the models and the two scenarios, and demonstrates a centennial-scale commitment of stored heat in the Southern Ocean and its overlying sea ice cover under even relatively small anthropogenic climate shifts – despite aggressive mitigation action undertaken to attempt to counteract those shifts.
At the other end of the forcing spectrum, high-magnitude temperature changes under ssp585 result in total loss of sea ice cover in both polar regions over the longer-term (note expanded Y axes in Fig. 12e, f). In the Arctic, sea ice volume rapidly and steadily diminishes over the 21st Century (not shown), whereas areal coverage reduces relatively slowly at first, accelerating as volume declines before culminating in an abrupt loss of winter SIA c. 2100 that rapidly leads to total ice elimination. Both winter and summer SAT continue to climb throughout the extension in ACCESS-CM2, though temperatures stabilise in ACCESS-ESM1.5 c. 2200. The eradication of Antarctic sea ice occurs on a longer timeframe, with minimal winter ice remaining in both models by the end of the extension; however, the abrupt winter loss seen in the Arctic does not appear in the Antarctic. The SH temperatures continue to climb throughout the extension in both models under ssp585, though decelerating trajectories just prior to 2300 suggest that temperatures may stabilise in the decades beyond.
4.ACCESS-ESM1.5 only cases
4.1. Emissions-driven simulations
The two emissions-driven ACCESS-ESM1.5 simulations (each comprising ten ensemble members) are the esm-hist experiment, which is part of the standard CMIP dataset, and the esm-ssp585 scenario which is part of C4MIP. Here, we compare the emissions-driven climate to the corresponding standard concentration-driven climate.
In terms of global mean temperature and precipitation anomalies, the emissions-driven simulations closely follow their concentration-driven counterpart with the ensemble spread of the former mostly falling within the ensemble spread of the latter (Fig. 13). The emissions-driven historical experiment is slightly warmer than the concentration version at the beginning of the simulation; however, after the Krakatoa volcanic eruption in 1883, it becomes slightly cooler. In the early 21st Century (under the esm-ssp585 scenario), temperature in the emissions-driven simulation catches up to the concentration-driven version again. The CO2 concentration in Fig. 13b shows a similar behaviour, suggesting that the difference is driven by the CO2 concentration. However, the global mean precipitation (not shown) does not show any noticeable difference between emissions-driven and concentration-driven configurations.
(a) Global mean temperature of esm-historical and esm-ssp585 emissions-driven simulations (red) and concentration-driven historical and ssp585 scenario (blue). Values are presented as absolute values to evince the absolute difference between the concentration and emissions-driven configurations. (b) Global mean atmospheric surface CO2 concentration in the esm-historical and esm-ssp585 emissions-driven configuration (red) and concentration-driven historical and ssp585 simulations (blue). Only surface CO2 concentrations are shown since the well-mixed boundary layer is what is seen by the land and the ocean.
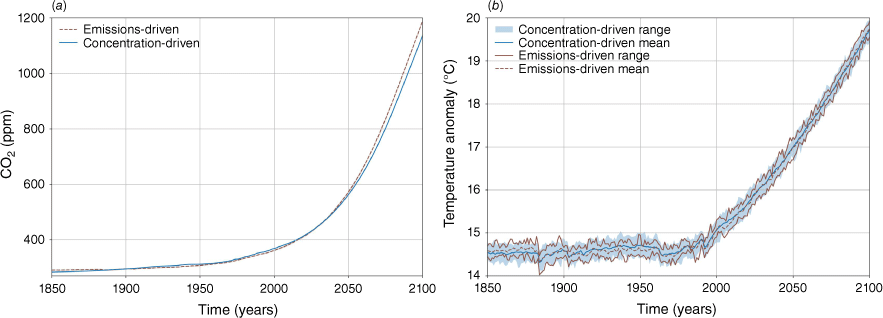
Use of an emissions-driven configuration provides additional feedbacks into the climate system that compete to increase or decrease the CO2 concentrations. For feedbacks related to temperature, the volcanic aerosol emissions from Krakatoa triggers global cooling and increased ocean CO2 uptake by the land and ocean, decreasing vegetation respiration and increasing surface solubility in the ocean. This then cools the climate more than the concentration-driven simulation. By contrast, ocean uptake can also decrease with warming by out-gassing, leading to more rapid future warming in the emissions-driven configuration. Furthermore, the effects of changes in atmospheric CO2 concentration itself can modulate atmospheric concentrations by CO2 fertilisation of vegetation on the land surface. However, future studies may wish to differentiate the effects of temperature and biogeochemical feedbacks using the hist-bgc and ssp585-bgc experiments. In spite of the additional feedbacks that lead to slightly different CO2 pathways, the emissions-driven and concentration-driven configuration are close over the whole historical and ssp585 periods, suggesting a good agreement of ACCESS-ESM1.5 with the integrated assessment model that generated the scenario.
4.2. LUMIP simulations of altered land-use
As part of ACCESS-ESM1.5’s participation in LUMIP (Lawrence et al. 2016), several future land-use policy sensitivity experiments were conducted. These simulations ran from 2015 to 2100 for various scenarios with altered land-use change from another scenario. This allows for analysis of the biogeophysical climate impacts of land-use and land management. One simulation was run in emissions-driven mode: esm-ssp585-ssp126Lu, which is derived from the esm-ssp585 configuration but uses land-use from ssp126, and analysed in further detail in Loughran et al. (2023). Two more scenarios were run in concentration-driven mode with swapped land-use: ssp370-ssp126Lu is derived from the ssp370 configuration but uses ssp126 land-use from the integrated assessment model IMAGE (van Vuuren et al. 2017), and ssp126-ssp370Lu is derived from the ssp126 configuration but uses ssp370 land-use from the integrated assessment model AIM (Fujimori et al. 2017). Consequently, ssp370-ssp126Lu represents a moderate–high atmospheric CO2 concentrations with increased tree cover and low land-use, whereas ssp126-ssp370Lu represents a scenario with low atmospheric CO2 concentrations and accelerated deforestation (see Supplementary Fig. S2 for tree cover difference).
The globally averaged SAT for the altered land-use change experiments are similar to their unaltered counterparts: ssp370-ssp126Lu is 0.003°C warmer and ssp126-ssp370Lu is 0.04°C cooler. The spatial patterns of land temperature and precipitation difference over the last 30 years of the century are shown in Fig. 14a, b (for differences significant at the 5% level). Land temperature changes generally correspond to changes in tree cover. The deforestation in ssp126-ssp370Lu causes most of the land surface to cool. By contrast, since global surface air temperatures for the ssp370 and ssp370-ssp126Lu simulations are more similar, the regional differences are also smaller. Many tropical regions with increased forest cover under the altered land-use scenario show increased surface temperatures.
Differences between the 2070–2100 means of the LUMIP altered land-use change experiments and the unaltered scenarios for temperature (a, b) and precipitation (c, d). Only values significant at the 5% level are shown.
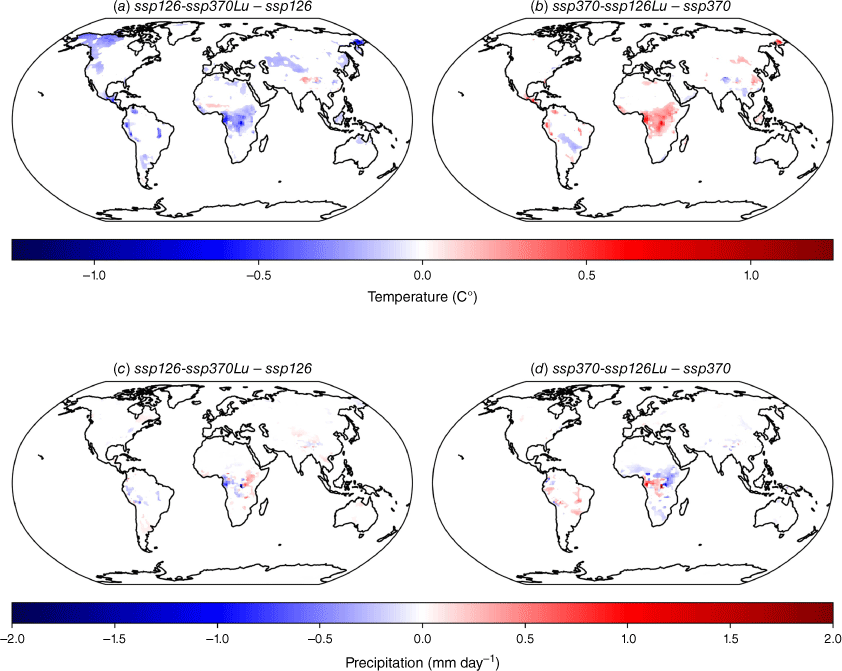
Since these simulations are concentration driven, the effects exclude biogeochemical feedbacks such as CO2 fertilisation, and instead represent the combined local and non-local biogeophysical effects. The three largest changes to surface properties from land-use change affecting climate are changes to albedo, surface roughness and evapotranspiration efficiency. With increased forest cover, decreased albedo increases shortwave radiation absorption and increased temperatures, whereas increased roughness and evapotranspiration efficiency increases turbulent heat fluxes leading to decreased surface temperatures. Since the model generally shows increased temperatures with forestation, the combined local and non-local effects of albedo dominate in ACCESS-ESM1.5.
Precipitation is also closely related to altered land-use. The largest significant changes occur in the tropical regions where rainfall is largest. In ACCESS-ESM1.5, decreased forest cover under a warming climate leads to decreased precipitation in the Amazon and the Congolian rainforests (Fig. 14c). The surrounding regions in central Africa have increased rainfall. Meanwhile, the maritime continent shows increased precipitation with decreased forest cover. However, the forestation under a cooler climate (Fig. 14d) shows the opposite spatial pattern, with increased precipitation with increased forest cover in the Amazon and Congolian rainforests.
5.Summary and conclusions
Building on the work of Mackallah et al. (2022), Bi et al. (2020), Ziehn et al. (2020a) and Rashid et al. (2022), in which the ACCESS contributions to the pre-industrial, idealised and historical experiments are described in detail, we have in the present paper demonstrated the future climate evolution and outcomes from the fully coupled climate model ACCESS-CM2 and the Earth System Model ACCESS-ESM1.5 under a range of forcing pathways. We examine near-future, 21st Century and long term climate responses of the atmosphere, ocean and sea ice, the main highlights of which are summarised below.
Under the most pessimistic, ssp585 scenario, the projected GMST anomalies exceed 5 and 6°C (at year 2100) in ACCESS-ESM1-5 and ACCESS-CM2 models respectively; the corresponding increases in GMPr are 0.22 and 0.35 mm day–1. The temporal evolution of GMPr closely follow the GMST evolution, especially in simulations with higher radiative forcings. The projected global warming levels (at 2100) in two ACCESS models match the corresponding CMIP6 ensemble-mean levels, with the ACCESS-ESM1-5 projections matching better. Beyond 2100, both GMST and GMPr continue to increase in ssp585, although the rate of increase becomes slower after c. 2120. In ssp126, both variables are projected to stabilise and remain so until 2300. In SSP5-3.4 overshoot experiments, the GMST and GMPr anomalies keep rising for a few decades after emissions peaking at 2040. These then start to decrease but at a slower rate than the antecedent increasing rate, giving rise to a hysteresis behaviour.
The projected time-mean spatial patterns of SAT, Pr and SLP in a medium to high forcing simulation (SSP3-7.0) compare well with the corresponding projected patterns for CMIP6 ensemble-means, with SAT (Pr) matching the most (least). These are also the variables showing the least (most) scatter among the CMIP6 models. The enhanced polar warming and its seasonal asymmetry are also simulated by the two ACCESS models, with the magnitude of the Arctic asymmetry being larger than in most other CMIP6 models.
Although SST increases substantially across the 21st Century over much of the global ocean surface, the presence (though generally declining) of sea ice slows surface ocean warming in the polar regions. Increased SST is most extreme in parts of the NH mid-latitudes, which can be linked to the reduction of cold water from summer Arctic sea ice melt, for example into the Labrador Sea in the North Atlantic. Over the longer term, as sea ice vanishes in the NH, the Arctic Ocean undergoes large zonal mean warming (of more than 11°C by 2300 in ACCESS-ESM1.5 under ssp585), with the cessation of relatively cold, seasonal meltwater input leading to even more extreme localised SST increases in the NH mid-latitudes. Under more optimistic scenarios, such as ssp126 and ssp534-over, Arctic surface air temperatures decrease as emissions reduce across the 22nd and 23rd Centuries, and sea ice quickly begins to recover in response.
The SH, however, shows the opposite response: under the low-emissions scenarios, SATs decrease and Antarctic sea ice volume rebounds somewhat after 2100; however, as the large absorption of excess atmospheric heat from greenhouse warming into the Southern Ocean continues across the extensions, both ACCESS-CM2 and ACCESS-ESM1.5 produce a secondary decline in Antarctic sea ice that appears to continue beyond the end of the extension. The additional heat is also transferred deeper into the ocean column; both models produce changes in ocean density in line with changes in global ocean temperatures, producing steric sea level rise. Warming and freshening (from melting land or polar ice) in the upper ocean strengthens the vertical density gradient of the ocean column, which weakens the global meridional overturning circulation. The worst impact is, unsurprisingly, seen under the pessimistic ssp585 scenario, which towards the end of the extension period has reduced so far that AMOC can be essentially considered ‘shut off’ in ACCESS-CM2. With the near elimination of Antarctic sea ice by the end of the extension, formation of AABWF and its vital role in ventilating the abyssal ocean, meets a similar fate in ACCESS-CM2. In ACCESS-ESM1.5, by contrast, AMOC may continue to function, though with much lower efficiency. Such changes in AMOC and AABWF suggest dramatic adjustments of oceanic transport of water, salt, carbon, nutrients and other substances around the world, and have disastrous consequences for the climate and ecosystem.
As discussed in Rashid et al. (2022), when compared against historical observations, neither ACCESS model is clearly ‘better’ than the other – each outperforms the other in different areas (e.g. a more accurate energy balance in ACCESS-CM2, but variability is more closely captured in ACCESS-ESM1.5). Our analysis of both models provides only a glimpse of what long-term projections may reveal, and despite having largely considered only global-scale metrics, some substantial regional impacts are already clearly visible. Of course, without observational reference extending into the future, there is enormous uncertainty in the veracity of model projections, which becomes greater the further into the future they extend, particularly given the wide range of simulated ECS compared with estimates from the observed climate record (McBride et al. 2021). However, given that the standard scenario period extends only ~75 years from now (to 2100), there is value in examining projected climate outcomes from the longer-term extension periods in order to reflect on potential timelines and impacts of climate stabilisation. This is particularly true of emissions-driven simulations, in which longer-term projections can explicitly represent the cycle of greenhouse gases and their impacts, such as carbon-climate feedbacks under aggressive mitigation scenarios depicting carbon removal and sequestration (Sanderson et al. 2023).
Data availability
CMIP6 data are hosted on the Earth System Grid Federation (https://esgf.llnl.gov/). Published datasets for ScenarioMIP are located at Dix et al. (2019b) (ACCESS-CM2) and Ziehn et al. (2019b) (ACCESS-ESM1.5), for LUMIP at Ziehn et al. (2021) (ACCESS-ESM1.5) and for DAMIP (including COVID simulations) at Ziehn et al. (2020b). Users of the Australian National University (ANU) National Computational Infrastructure (NCI) can also access the data directly from project fs38 (https://my.nci.org.au/mancini/project/fs38).
Acknowledgements
We acknowledge the coordination of CMIP6 by the Working Group on Coupled Modelling of the World Climate Research Programme, and the data archiving and access provided by the Earth System Grid Federation (ESGF). ACCESS submissions to CMIP6 were supported by CSIRO and the Earth Systems and Climate Change Hub (and subsequent Climate Systems Hub) of the Australian Government’s National Environmental Science Program (NESP). National Computational Infrastructure (NCI) resources supported the simulation, processing and publication of ACCESS model data. The authors also thank Paul Gravis for his assistance and insights in analysing near-future climate impacts.
References
Allen MR, Ingram WJ (2002) Constraints on future changes in climate and the hydrologic cycle. Nature 419, 224-232.
| Crossref | Google Scholar | PubMed |
Allen RJ, Turnock S, Nabat P, Neubauer D, Lohmann U, Olivié D, Oshima N, Michou M, Wu T, Zhang J, Takemura T, Schulz M, Tsigaridis K, Bauer SE, Emmons L, Horowitz L, Naik V, van Noije T, Bergman T, Lamarque J-F, Zanis P, Tegen I, Westervelt DM, Le Sager P, Good P, Shim S, O’Connor F, Akritidis D, Georgoulias AK, Deushi M, Sentman LT, John JG, Fujimori S, Collins WJ (2020) Climate and air quality impacts due to mitigation of non-methane near-term climate forcers. Atmospheric Chemistry and Physics 20, 9641-9663.
| Crossref | Google Scholar |
Armour KC, Marshall J, Scott JR, Donohoe A, Newsom ER (2016) Southern Ocean warming delayed by circumpolar upwelling and equatorward transport. Nature Geoscience 9, 549-554.
| Crossref | Google Scholar |
Arzel O, Fichefet T, Goosse H (2006) Sea ice evolution over the 20th and 21st Centuries as simulated by current AOGCMs. Ocean Modelling 12, 401-415.
| Crossref | Google Scholar |
Bi D, Dix M, Marsland S, O’Farrell S, Sullivan A, Bodman R, Law R, Harman I, Srbinovsky J, Rashid H, Dobrohotoff P, Mackallah C, Yan H, Hirst A, Savita A, Dias FB, Woodhouse M, Fiedler R, Heerdegen A (2020) Configuration and spin-up of ACCESS-CM2, the new generation Australian Community Climate and Earth System Simulator Coupled Model. Journal of Southern Hemisphere Earth Systems Science 70, 225-251.
| Crossref | Google Scholar |
Bindoff N, Cheung W, Kairo J, Arístegui J, Guinder V, Hallberg R, Hilmi N, Jiao N, Karim M, Levin L, O’Donoghue S, Cuicapusa SP, Rinkevich B, Suga T, Tagliabue A, Williamson P (2019) Chapt. 5. Changing ocean, marine ecosystems, and dependent communities. In ‘Climate Change 2021 – the Physical Science Basis. Working Group I Contribution to the Sixth Assessment Report of the Intergovernmental Panel on Climate Change’. (Eds H-O Pörtner, DC Roberts, V Masson-Delmotte, P Zhai, M Tignor, E Poloczanska, K Mintenbeck, A Alegría, M Nicolai, A Okem, J Petzold, B Rama, NM Weyer) pp. 447–587. (Cambridge University Press: Cambridge, UK, and New York, NY, USA) 10.1017/9781009157964.007
Cassidy LJ, King AD, Brown J, MacDougall AH, Ziehn T, Min S-K, Jones CD (2023) Regional temperature extremes and vulnerability under net zero CO2 emissions. Environmental Research Letters 19, 014051.
| Crossref | Google Scholar |
Chamberlain MA, Ziehn T, Law RM (2023) The Southern Ocean as the freight train of the global climate under zero-emission scenarios with ACCESS-ESM1.5. Biogeosciences Discussions 2023, 1-29.
| Crossref | Google Scholar |
Chou C, Neelin JD, Chen C-A, Tu J-Y (2009) Evaluating the “rich-get-richer” mechanism in tropical precipitation change under global warming. Journal of Climate 22, 1982-2005.
| Crossref | Google Scholar |
Dix M, Bi D, Dobrohotoff P, Fiedler R, Harman I, Law R, Mackallah C, Marsland S, O’Farrell S, Rashid H, Srbinovsky J, Sullivan A, Trenham C, Vohralik P, Watterson I, Williams G, Woodhouse M, Bodman R, Dias FB, Domingues C, Hannah N, Heerdegen A, Savita A, Wales S, Allen C, Druken K, Evans B, Richards C, Ridzwan SM, Roberts D, Smillie J, Snow K, Ward M, Yang R (2019a) CSIRO-ARCCSS ACCESS-CM2 model output prepared for CMIP6 CMIP. [Dataset] 10.22033/ESGF/CMIP6.2281
Dix M, Bi D, Dobrohotoff P, Fiedler R, Harman I, Law R, Mackallah C, Marsland S, O’Farrell S, Rashid H, Srbinovsky J, Sullivan A, Trenham C, Vohralik P, Watterson I, Williams G, Woodhouse M, Bodman R, Dias FB, Domingues C, Hannah N, Heerdegen A, Savita A, Wales S, Allen C, Druken K, Evans B, Richards C, Ridzwan SM, Roberts D, Smillie J, Snow K, Ward M, Yang R (2019b) CSIRO-ARCCSS ACCESS-CM2 model output prepared for CMIP6 ScenarioMIP. [Dataset]doi:10.22033/ESGF/CMIP6.2285
Dix M, Mackallah C, Bi D, Bodman R, Marsland S, Rashid H, Woodhouse M, Druken K (2020) CSIRO-ARCCSS ACCESSCM2 model output prepared for CMIP6 DAMIP. [Dataset] 10.22033/ESGF/CMIP6.14361
Eyring V, Bony S, Meehl GA, Senior CA, Stevens B, Stouffer RJ, Taylor KE (2016) Overview of the Coupled Model Intercomparison Project Phase 6 (CMIP6) experimental design and organization. Geoscientific Model Development 9, 1937-1958.
| Crossref | Google Scholar |
Fox-Kemper B, Hewitt H, Xiao C, Aðalgeirsdóttir G, Drijfhout S, Edwards T, Golledge N, Hemer M, Kopp R, Krinner G, Mix A, Notz D, Nowicki S, Nurhati I, Ruiz L, Sallée J-B, Slangen A, Yu Y (2021) Chapt. 9. Ocean, cryosphere and sea level change. In ‘Climate Change 2021 – the Physical Science Basis. Working Group I Contribution to the Sixth Assessment Report of the Intergovernmental Panel on Climate Change’. (Eds H-O Pörtner, DC Roberts, V Masson-Delmotte, P Zhai, M Tignor, E Poloczanska, K Mintenbeck, A Alegría, M Nicolai, A Okem, J Petzold, B Rama, NM Weyer) pp. 1211–1362. (Cambridge University Press: Cambridge, UK, and New York, NY, USA) 10.1017/9781009157896.011
Fujimori S, Hasegawa T, Masui T, Takahashi K, Herran DS, Dai H, Hijioka Y, Kainuma M (2017) SSP3: AIM implementation of shared socioeconomic pathways. Global Environmental Change 42, 268-283.
| Crossref | Google Scholar |
Gillett NP, Shiogama H, Funke B, Hegerl G, Knutti R, Matthes K, Santer BD, Stone D, Tebaldi C (2016) The Detection and Attribution Model Intercomparison Project (DAMIP v1.0) contribution to CMIP6. Geoscientific Model Development 9, 3685-3697.
| Crossref | Google Scholar |
Gordon AL (1981) Seasonality of Southern Ocean sea ice. Journal of Geophysical Research: Oceans 86, 4193-4197.
| Crossref | Google Scholar |
Grainger S, Frederiksen CS, Zheng X (2017) Projections of Southern Hemisphere atmospheric circulation interannual variability. Climate Dynamics 48, 1187-1211.
| Crossref | Google Scholar |
Gregory JM, Griffies SM, Hughes CW, Lowe JA, Church JA, Fukimori I, Gomez N, Kopp RE, Landerer F, Cozannet GL, Ponte RM, Stammer D, Tamisiea ME, van de Wal RSW (2019) Concepts and terminology for sea level: mean, variability and change, both local and global. Surveys in Geophysics 40, 1251-1289.
| Crossref | Google Scholar |
Grose MR, Boschat G, Trewin B, Round V, Ashcroft L, King AD, Narsey S, Hawkins E (2023) Australian climate warming: observed change from 1850 and global temperature targets. Journal of Southern Hemisphere Earth Systems Science 73, 30-43.
| Crossref | Google Scholar |
Hahn LC, Armour KC, Zelinka MD, Bitz CM, Donohoe A (2021) Contributions to polar amplification in CMIP5 and CMIP6 models. Frontiers in Earth Science 9, 710036.
| Crossref | Google Scholar |
Hartmann DL, Tank AMK, Rusticucci M, Alexander L V, Brönnimann S, Charabi YAR, Dentener FJ, Dlugokencky EJ, Easterling DR, Kaplan A, Soden BJ, Thorne PW, Wild M, Zhai P (2013) Chapt. 2. Observations: atmosphere and surface. In ‘Climate Change 2021 – the Physical Science Basis. Working Group I Contribution to the Sixth Assessment Report of the Intergovernmental Panel on Climate Change’. (Eds H-O Pörtner, DC Roberts, V Masson-Delmotte, P Zhai, M Tignor, E Poloczanska, K Mintenbeck, A Alegría, M Nicolai, A Okem, J Petzold, B Rama, NM Weyer) pp. 159–254. (Cambridge University Press: Cambridge, UK, and New York, NY, USA) 10.1017/CBO9781107415324.008
Hawkins E, Smith RS, Allison LC, Gregory JM, Woollings TJ, Pohlmann H, de Cuevas B (2011) Bistability of the Atlantic overturning circulation in a global climate model and links to ocean freshwater transport. Geophysical Research Letters 38, L10605.
| Crossref | Google Scholar |
Hegerl GC, Brönnimann S, Cowan T, Friedman AR, Hawkins E, Iles C, Müller W, Schurer A, Undorf S (2019) Causes of climate change over the historical record. Environmental Research Letters 14, 123006.
| Crossref | Google Scholar |
Hunke E, Lipscomb W, Jones P, Turner A, Jeffery N, Elliott S (2017) CICE, The Los Alamos Sea Ice Model. (US Department of Energy) Available at https://www.osti.gov/biblio/1364126
Jones CD, Arora V, Friedlingstein P, Bopp L, Brovkin V, Dunne J, Graven H, Hoffman F, Ilyina T, John JG, Jung M, Kawamiya M, Koven C, Pongratz J, Raddatz T, Randerson JT, Zaehle S (2016) C4MIP – the Coupled Climate–Carbon Cycle Model Intercomparison Project: experimental protocol for CMIP6. Geoscientific Model Development 9, 2853-2880.
| Crossref | Google Scholar |
Kiss AE, Hogg AM, Hannah N, Boeira Dias F, Brassington GB, Chamberlain MA, Chapman C, Dobrohotoff P, Domingues CM, Duran ER, England MH, Fiedler R, Griffies SM, Heerdegen A, Heil P, Holmes RM, Klocker A, Marsland SJ, Morrison AK, Munroe J, Nikurashin M, Oke PR, Pilo GS, Richet O, Savita A, Spence P, Stewart KD, Ward ML, Wu F, Zhang X (2020) ACCESS-OM2 v1.0: a global ocean–sea ice model at three resolutions. Geoscientific Model Development 13, 401-442.
| Crossref | Google Scholar |
Knutson TR, Ploshay J (2021) Sea level pressure trends: model-based assessment of detection, attribution, and consistency with CMIP5 historical simulations. Journal of Climate 34, 327-346.
| Crossref | Google Scholar |
Kowalczyk E, Stevens L, Law R, Dix M, Wang Y, Harman I, Haynes K, Srbinovsky J, Pak B, Ziehn T (2013) The land surface model component of ACCESS: description and impact on the simulated surface climatology. Australian Meteorological and Oceanographic Journal 63, 65-82.
| Crossref | Google Scholar |
Lamboll RD, Jones CD, Skeie RB, Fiedler S, Samset BH, Gillett NP, Rogelj J, Forster PM (2021) Modifying emissions scenario projections to account for the effects of COVID-19: protocol for CovidMIP. Geoscientific Model Development 14, 3683-3695.
| Crossref | Google Scholar |
Law RM, Ziehn T, Matear RJ, Lenton A, Chamberlain MA, Stevens LE, Wang Y-P, Srbinovsky J, Bi D, Yan H, Vohralik PF (2017) The carbon cycle in the Australian Community Climate and Earth System Simulator (ACCESS-ESM1) – part 1: model description and pre-industrial simulation. Geoscientific Model Development 10, 2567-2590.
| Crossref | Google Scholar |
Lawrence DM, Hurtt GC, Arneth A, Brovkin V, Calvin KV, Jones AD, Jones CD, Lawrence PJ, de Noblet-Ducoudré N, Pongratz J, Seneviratne SI, Shevliakova E (2016) The Land Use Model Intercomparison Project (LUMIP) contribution to CMIP6: rationale and experimental design. Geoscientific Model Development 9, 2973-2998.
| Crossref | Google Scholar |
Lean JL (2018) Observation-based detection and attribution of 21st Century climate change. Wiley Interdisciplinary Reviews: Climate Change 9, e511.
| Crossref | Google Scholar |
Long M, Zhang L, Hu S, Qian S (2021) Multi-aspect assessment of CMIP6 models for Arctic sea ice simulation. Journal of Climate 34, 1515-1529.
| Crossref | Google Scholar |
Loughran TF, Ziehn T, Law R, Canadell JG, Pongratz J, Liddicoat S, Hajima T, Ito A, Lawrence DM, Arora VK (2023) Limited mitigation potential of forestation under a high emissions scenario: results from multi-model and single model ensembles. Journal of Geophysical Research: Biogeosciences 128, e2023JG007605.
| Crossref | Google Scholar |
McBride LA, Hope AP, Canty TP, Bennett BF, Tribett WR, Salawitch RJ (2021) Comparison of CMIP6 historical climate simulations and future projected warming to an empirical model of global climate. Earth System Dynamics 12, 545-579 .
| Crossref | Google Scholar |
McCarthy G, Smeed D, Cunningham S, Roberts C (2017) Atlantic Meridional Overturning Circulation (AMOC). MCCIP Science Review 2017, 15-21.
| Crossref | Google Scholar |
MacDougall AH, Mallett J, Hohn D, Mengis N (2022) Substantial regional climate change expected following cessation of CO2 emissions. Environmental Research Letters 17, 114046.
| Crossref | Google Scholar |
Mackallah C, Chamberlain MA, Law RM, Dix M, Ziehn T, Bi D, Bodman R, Brown JR, Dobrohotoff P, Druken K, Evans B, Harman IN, Hayashida H, Holmes R, Kiss AE, Lenton A, Liu Y, Marsland S, Meissner K, Menviel L, O’Farrell S, Rashid HA, Ridzwan S, Savita A, Srbinovsky J, Sullivan A, Trenham C, Vohralik PF, Wang YP, Williams G, Woodhouse MT, Yeung N (2022) ACCESS datasets for CMIP6: methodology and idealised experiments. Journal of Southern Hemisphere Earth Systems Science 72, 93-116.
| Crossref | Google Scholar |
Meehl GA (2023) ‘The Role of the IPCC in Climate Science.’ (Oxford University Press) 10.1093/acrefore/9780190228620.013.933
Moss RH, Edmonds JA, Hibbard KA, Manning MR, Rose SK, van Vuuren DP, Carter TR, Emori S, Kainuma M, Kram T, Meehl GA, Mitchell JFB, Nakicenovic N, Riahi K, Smith SJ, Stouffer RJ, Thomson AM, Weyant JP, Wilbanks TJ (2010) The next generation of scenarios for climate change research and assessment. Nature 463, 747-756.
| Crossref | Google Scholar | PubMed |
Notz D, Jahn A, Holland M, Hunke E, Massonnet F, Stroeve J, Tremblay B, Vancoppenolle M (2016) The CMIP6 Sea-Ice Model Intercomparison Project (SIMIP): understanding sea ice through climate-model simulations. Geoscientific Model Development 9, 3427-3446.
| Crossref | Google Scholar |
O’Neill BC, Tebaldi C, van Vuuren DP, Eyring V, Friedlingstein P, Hurtt G, Knutti R, Kriegler E, Lamarque J-F, Lowe J, Meehl GA, Moss R, Riahi K, Sanderson BM (2016) The Scenario Model Intercomparison Project (ScenarioMIP) for CMIP6. Geoscientific Model Development 9, 3461-3482.
| Crossref | Google Scholar |
Pincus R, Forster PM, Stevens B (2016) The Radiative Forcing Model Intercomparison Project (RFMIP): experimental protocol for CMIP6. Geoscientific Model Development 9, 3447-3460.
| Crossref | Google Scholar |
Rahmstorf S, Box JE, Feulner G, Mann ME, Robinson A, Rutherford S, Schaffernicht EJ (2015) Exceptional twentieth-century slowdown in Atlantic Ocean overturning circulation. Nature Climate Change 5, 475-480.
| Crossref | Google Scholar |
Rashid HA (2021) Diverse responses of global-mean surface temperature to external forcings and internal climate variability in observations and CMIP6 models. Geophysical Research Letters 48, e2021GL093194.
| Crossref | Google Scholar |
Rashid H, Sullivan A, Dix M, Bi D, Mackallah C, Ziehn T, Dobrohotoff P, O’Farrell S, Harman I, Bodman R, Marsland S (2022) Evaluation of climate variability and change in ACCESS historical simulations for CMIP6. Journal of Southern Hemisphere Earth Systems Science 72, 73-92.
| Crossref | Google Scholar |
Sanderson BM, Booth BB, Dunne J, Eyring V, Fisher RA, Friedlingstein P, Gidden M, Hajima T, Jones CD, Jones C, et al. (2023) The need for carbon emissions-driven climate projections in CMIP7. EGUsphere 2023, 1-51.
| Crossref | Google Scholar |
Schroeter S, Hobbs W, Bindoff N, Massom R, Matear R (2018) Drivers of Antarctic sea ice volume change in CMIP5 models. Journal of Geophysical Research: Oceans 123, 7914-7938.
| Crossref | Google Scholar |
Shu Q, Song Z, Qiao F (2015) Assessment of sea ice simulations in the CMIP5 models. The Cryosphere 9, 399-409.
| Crossref | Google Scholar |
Shu Q, Wang Q, Song Z, Qiao F, Zhao J, Chu M, Li X (2020) Assessment of sea ice extent in CMIP6 with comparison to observations and CMIP5. Geophysical Research Letters 47, e2020GL087965.
| Crossref | Google Scholar |
Smeed DA, Josey SA, Beaulieu C, Johns WE, Moat BI, Frajka-Williams E, Rayner D, Meinen CS, Baringer MO, Bryden HL, McCarthy GD (2018) The North Atlantic Ocean Is in a state of reduced overturning. Geophysical Research Letters 45, 1527-1533.
| Crossref | Google Scholar |
Song S-Y, Yeh S-W, Allan RP, Xie S-P, An S-I, Park H-S (2023) Climate sensitivity controls global precipitation hysteresis in a changing CO2 pathway. npj Climate and Atmospheric Science 6, 156.
| Crossref | Google Scholar |
Taylor KE (2001) Summarizing multiple aspects of model performance in a single diagram. Journal of Geophysical Research: Atmospheres 106, 7183-7192.
| Crossref | Google Scholar |
Turner J, Bracegirdle TJ, Phillips T, Marshall GJ, Scott Hosking J (2013) An initial assessment of antarctic sea ice extent in the CMIP5 models. Journal of Climate 26, 1473-1484.
| Crossref | Google Scholar |
van Vuuren DP, Stehfest E, Gernaat DEHJ, Doelman JC, van den Berg M, Harmsen M, de Boer HS, Bouwman LF, Daioglou V, Edelenbosch OY, Girod B, Kram T, Lassaletta L, Lucas PL, van Meijl H, Müller C, van Ruijven BJ, van der Sluis S, Tabeau A (2017) Energy, land-use and greenhouse gas emissions trajectories under a green growth paradigm. Global Environmental Change 42, 237-250.
| Crossref | Google Scholar |
Walters D, Baran AJ, Boutle I, Brooks M, Earnshaw P, Edwards J, Furtado K, Hill P, Lock A, Manners J, Morcrette C, Mulcahy J, Sanchez C, Smith C, Stratton R, Tennant W, Tomassini L, Van Weverberg K, Vosper S, Willett M, Browse J, Bushell A, Carslaw K, Dalvi M, Essery R, Gedney N, Hardiman S, Johnson B, Johnson C, Jones A, Jones C, Mann G, Milton S, Rumbold H, Sellar A, Ujiie M, Whitall M, Williams K, Zerroukat M (2019) The Met Office Unified Model Global Atmosphere 7.0/7.1 and JULES Global Land 7.0 configurations. Geoscientific Model Development 12, 1909-1963.
| Crossref | Google Scholar |
Weijer W, Cheng W, Drijfhout SS, Fedorov AV, Hu A, Jackson LC, Liu W, McDonagh EL, Mecking JV, Zhang J (2019) Stability of the Atlantic meridional overturning circulation: a review and synthesis. Journal of Geophysical Research: Oceans 124, 5336-5375.
| Crossref | Google Scholar |
Weijer W, Cheng W, Garuba OA, Hu A, Nadiga BT (2020) CMIP6 models predict significant 21st Century decline of the Atlantic Meridional Overturning Circulation. Geophysical Research Letters 47, e2019GL086075.
| Crossref | Google Scholar |
Wilcox LJ, Highwood EJ, Dunstone NJ (2013) The influence of anthropogenic aerosol on multi-decadal variations of historical global climate. Environmental Research Letters 8, 024033.
| Crossref | Google Scholar |
Wu X, Okumura YM, DiNezio PN, Yeager SG, Deser C (2022) The Equatorial Pacific Cold Tongue Bias in CESM1 and Its Influence on ENSO Forecasts. Journal of Climate 35, 3261-3277.
| Crossref | Google Scholar |
Ziehn T, Chamberlain M, Lenton A, Law R, Bodman R, Dix M, Wang Y, Dobrohotoff P, Srbinovsky J, Stevens, L, Vohralik P, Mackallah C, Sullivan A, O’Farrell S, Druken K (2019a) CSIRO ACCESS-ESM1.5 model output prepared for CMIP6 CMIP. [Dataset] 10.22033/ESGF/CMIP6.2288
Ziehn T, Chamberlain MA, Law RM, Lenton A, Bodman RW, Dix M, Stevens L, Wang YP, Srbinovsky J (2020a) The Australian Earth System Model: ACCESS-ESM1.5. Journal of Southern Hemisphere Earth Systems Science 70, 193-214.
| Crossref | Google Scholar |
Ziehn T, Dix M, Mackallah C, Chamberlain M, Lenton A, Law R, Druken K, Ridzwan SM (2020b) CSIRO ACCESS-ESM1.5 model output prepared for CMIP6 DAMIP. [Dataset] 10.22033/ESGF/CMIP6.14362
Ziehn T, Dix M, Mackallah C, Chamberlain M, Lenton A, Law R, Druken K, Ridzwan SM (2021) CSIRO ACCESS-ESM1.5 model output prepared for CMIP6 LUMIP. [Dataset] 10.22033/ESGF/CMIP6.15741