

Admission to hospital for effects of heat and light: NSW, 1993–94 to 2003–04
Paul J. Beggs A B and Pavla Vaneckova AA Department of Physical Geography, Macquarie University
B Corresponding author. Email: paul.beggs@mq.edu.au
NSW Public Health Bulletin 19(8) 132-137 https://doi.org/10.1071/NB07004
Published: 20 October 2008
Abstract
The study examined the hospital admission rates and characteristics of patients experiencing severe heat-related morbidity in NSW using data from the NSW Health Inpatient Statistics Collection. The study covered the 11-year period from July 1993 to June 2004. ICD-10-AM. codes examined included T67 (effects of heat and light). There was an average of 91 admissions for each year due to a principal diagnosis of the effects of heat and light, with consistently more males than females admitted (1.7 : 1). Many of the admissions (39%) were of people 65 years of age or older. Most admissions (49%) occurred in the summer months of December and January.
The 2003 heat wave in Europe and climate change caused by humans have heightened interest in the relationships between climate and public health generally, and heat-related morbidity and mortality in particular.1–3 While many studies have examined heat-related mortality, in some cases associated with specific heat waves, fewer studies have examined heat-related morbidity; for example, by analysis of hospital records.4–10 The study examines the hospital admission rates and patient characteristics for severe heat-related morbidity in New South Wales (NSW) by analysing routinely-collected hospital inpatient data.
Methods
Data used in the study were from the NSW Health Inpatient Statistics Collection (ISC). The ISC is a census of all admitted patient services provided by NSW public hospitals, public psychiatric hospitals, public multi-purpose services, private hospitals and private day procedures centres.11 Eleven years of de-identified unit record data were obtained for the period 1 July 1993 to 30 June 2004. Clinical information in the ISC, such as principal diagnosis, additional diagnoses and external causes of injury or poisoning, is coded according to the International Statistical Classification of Diseases and Related Health Problems – Tenth Revision – Australian Modification (ICD-10-AM). Codes examined included T67 (effects of heat and light), incorporating T67.0 (heatstroke and sunstroke), T67.1 (heat syncope), T67.2 (heat cramp), T67.3 (heat exhaustion, anhydrotic), T67.4 (heat exhaustion due to salt depletion), T67.5 (heat exhaustion, unspecified), T67.6 (heat fatigue, transient), T67.7 (heat oedema), T67.8 (other effects of heat and light) and T67.9 (effect of heat and light, unspecified). External causes Y40–Y59 (drugs, medicaments and biological substances causing adverse effects in therapeutic use) used in addition to a T67 diagnosis were also examined.
Temporal characteristics were examined by analysis of the data by year, month and day of the week. Spatial characteristics were examined through analysis of the data by statistical division. Statistical division is an Australian Standard Geographical Classification defined area, which represents a large, general purpose, regional-type geographic area. Statistical divisions represent relatively homogeneous regions characterised by identifiable social and economic links between the inhabitants and between the economic units within the region.12 There are a total of 12 statistical divisions in NSW. Spatial characteristics were also examined through analysis of the data by latitudinal (north or south) and coastal/non-coastal groupings of statistical divisions. The six statistical divisions north of approximately 33.3°S were categorised as ‘north’, and the six statistical divisions south of this latitude were categorised as ‘south’. The six statistical divisions with a coastal border were categorised as ‘coastal’, while those without a coastal border were categorised as ‘non-coastal’. Rates were age-standardised using the 1996 Australian population.
Results
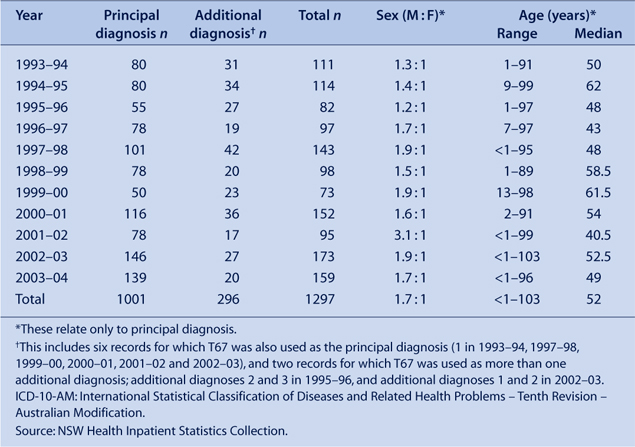
Over the study period, there were a total of 1289 admissions for effects of heat and light as either the principal or an additional diagnosis. Most of these (78%) were as the principal diagnosis. Where the effects of heat and light were used as an additional diagnosis, the most common principal diagnoses included volume depletion (E86) (14%), syncope and collapse (R55) (8%) and other medical care (Z51) (5%). All effects of heat and light results presented are for the principal diagnosis admissions only. There were an average of 91 admissions each year due to a principal diagnosis of effects of heat and light, although the number varied considerably from year to year, with a minimum of 50 in 1999–00 and a maximum of 146 in 2002–03 (Table 1). The crude average annual statewide hospital admission rate for the effects of heat and light was 1.5 for every 100 000 population. There were consistently more males than females admitted due to a principal diagnosis of effects of heat and light, with the ratio ranging from 1.2 : 1 to 3.1 : 1, and the overall ratio of 1.7 : 1. Admissions due to a principal diagnosis of effects of heat and light spanned all age groups, with a minimum age of less than 1 year and a maximum of 103 years. However, many admissions (39%) were aged 65 years and over. There was no clear trend in any of these annual characteristics over the study period.
|
Of the ten sub-categories, two were associated with the majority of admissions. These were ‘heatstroke and sunstroke’ (T67.0) and ‘heat exhaustion, unspecified’ (T67.5), which accounted for 33% and 39% of admissions, respectively (Table 2). Another 23% of admissions are accounted for by ‘heat syncope’ (T67.1) and ‘heat exhaustion, anhydrotic’ (T67.3). The remaining sub-categories are associated with very few admissions, each including years during the study period in which there were no associated admissions. The sub-category, heat oedema (T67.7), was not used during the study period.

|
Analysis of the additional diagnoses and external causes of injury or poisoning associated with T67 principal diagnosis admissions was restricted to the years 1993–94 to 2001–02 because the last two years of the data (2002–03 and 2003–04) had mixed these two fields. Sixty-three percent of T67 principal diagnosis admissions over the years 1993–94 to 2001–02 had one or more additional diagnoses, with a total of 959 additional diagnoses recorded. The most common additional diagnoses were volume depletion (E86) (15%) followed by essential (primary) hypertension (I10) (7%). All remaining additional diagnoses categories made up less than 4% each, with most being used only once. Nearly all the T67 principal diagnosis admissions over the years 1993–94 to 2001–02 (98%) had an external cause of injury or poisoning (Table 3). The majority of external causes (66%) were exposure to excessive natural heat (X30). A more in-depth inspection of this field revealed that approximately 2.4% of all external causes were a drug, medicament or biological substance causing adverse effects in therapeutic use (Y40–Y59), but only the six admissions with Y52 as the external cause of injury or poisoning are shown in Table 3. Place of occurrence of external cause of injury, and activity when injured, had only been used for two years of the data (2000–01 to 2001–02). For these years, 175 of the 194 records (90%) had a place of occurrence, and for the majority of these the place of occurrence was either the home, unspecified or school or other institution and public administrative area. Fewer of the records in these years had an activity when injured (150; 77%). There were only four ‘activity when injured’ categories used, and most were ‘other activity’.

|
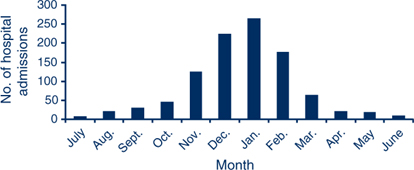
Admission did not vary considerably by day of the week, with the minimum of 126 (13%) occurring on Mondays and the maximum of 166 (17%) occurring on Tuesdays. In contrast, there was considerable monthly variation (Figure 1). Most admissions (49%) occurred in the first months of summer (December and January), with a further 30% of admissions occurring in the months either side of this period (November and February). Each of the remaining months included at most 6% of admissions, and the two winter months of June and July each included 1% or less of admissions.
|
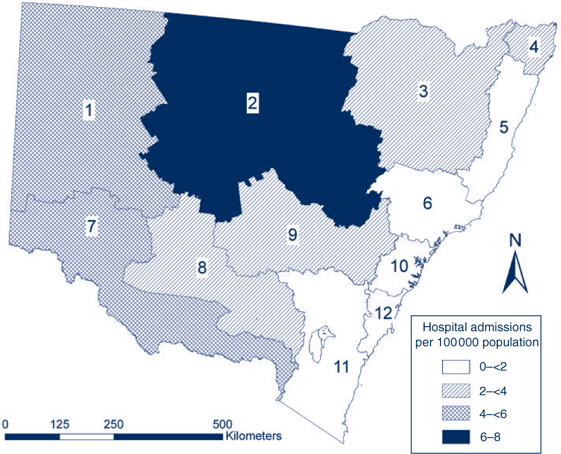
There was strong spatial variability in admissions due to a principal diagnosis of effects of heat and light. The annual average hospital admission rate was more than twice as high in the north of the state than in the south (2.5 v. 1.2 per 100 000), and almost four times higher in the west (non-coastal) than in the east (coastal) (4.3 v. 1.1 per 100 000). Consistent with this broad pattern, the Illawarra statistical division in the south-east of the state had the lowest annual average hospital admission rate of 0.7 per 100 000, and the North Western statistical division had the state’s highest annual average hospital admission rate of 7.8 per 100 000 (Figure 2).
|
Discussion
The study examined the hospital admission rates and characteristics of heat-related morbidity in NSW by analysis of routinely collected hospital inpatient data. As indicated in previous studies of hospital admissions, the severe types of heat-related disease (heat exhaustion and heatstroke), were the most common.8 Because the ISC does not capture patients who present only to emergency departments, general practices or other non-hospital health services, or those who do not consult any health service, the total magnitude of heat-related illness in NSW is likely to be greater than is indicated in this study.
The seasonal variability of heat-related admissions was expected and is consistent with previous studies, including slight asymmetry around the middle of summer with skewing in admissions towards the beginning of the summer due to acclimatisation as the season progresses.13,14 Similarly, the tendency for heat-related illness to occur in older people (median age of 52 years in the study) has been found in previous studies.8 Although the over-representation of males does not seem to be common in previous studies, some of which have found more females than males affected by heat-related illness, two recent studies of sports and leisure-related heat illness and injury have found an excess of hospitalisations for males, suggesting participation in sports and leisure activities may have contributed to the gender difference found in the study.8,15,16
Previous research suggests that there may be some underreporting of medications as an external cause. For example, in comparison to 2.4% in the present study, another study found a large proportion of heat-related admissions involved one or more medications, such as diuretics (46%) and major tranquillisers (13%), which are risk factors for heat-related illness.8
Acknowledgments
The assistance of Frank Siciliano is gratefully acknowledged. We thank John Agland (Manager, Information Analysis and Dissemination Unit, NSW Department of Health) for assistance with access to the ISC. The study was funded by the Macquarie University Research Development Grant Scheme.
[1] Poumadère M, Mays C, Le Mer S, Blong R. The 2003 heat wave in France: dangerous climate change here and now. Risk Anal 2005; 25(6): 1483–94.
| Crossref | GoogleScholarGoogle Scholar | PubMed | (Cited 16 January 2008.)
[12]
[13] Lugo-Amador NM, Rothenhaus T, Moyer P. Heat-related illness. Emerg Med Clin North Am 2004; 22(2): 315–27.
| Crossref | GoogleScholarGoogle Scholar | PubMed |

[14] Khosla R, Guntupalli KK. Heat-related illnesses. Crit Care Clin 1999; 15(2): 251–63.
| Crossref | GoogleScholarGoogle Scholar | PubMed | CAS |
[15] Driscoll TR, Cripps R, Brotherhood JR. Heat-related injuries resulting in hospitalisation in Australian sport. J Sci Med Sport 2008; 11(1): 40–7.
| Crossref | GoogleScholarGoogle Scholar | PubMed |
[16] Finch CF, Boufous S. The descriptive epidemiology of sports/leisure-related heat illness hospitalisations in New South Wales, Australia. J Sci Med Sport 2008; 11(1): 48–51.
| Crossref | GoogleScholarGoogle Scholar |