

A comparison of two nutrition signposting systems for use in Australia
Jimmy Chun-Yu Louie A , Victoria Flood A , Anna Rangan A , Debra J. Hector A and Tim Gill A BA NSW Centre for Public Health Nutrition, The University of Sydney
B Corresponding author. Email: t.gill@mmb.usyd.edu.au
NSW Public Health Bulletin 19(8) 121-126 https://doi.org/10.1071/NB07118
Published: 20 October 2008
Abstract
Consumers are interested in making healthier food choices but the mandatory nutrition information panel currently in use in Australia is not easily understood or interpreted by most consumers. A simple nutrition signpost would be valuable. This paper reviews two nutrition signposting systems currently being considered for adoption in Australia. The authors conclude that a system similar to the colour-coded Traffic Light System is likely to be most useful.
Why use signposting?
Consumers today are interested in the nutritional quality of the food products they purchase. As such, mandatory nutritional labelling requirements are now present in several countries including the United States of America (USA), Australia and New Zealand. In Australia, legislation requires that nutrition information be listed on packaged food in the form of a nutrition information panel (NIP), with the aim of assisting consumers to make healthier food choices.1–3 When used by health professionals and technically minded consumers, the NIP is highly informative, but general consumers find it difficult to comprehend.4–7 A simple labelling or signposting system that is easily seen and easily and quickly interpreted would assist consumers in making healthier food choices.1,8–10 It has been suggested that the combination of a nutrition signpost together with the traditional NIP is likely to be more effective in assisting consumers to make healthier choices.3,8,11
Front-of-pack signposts, or logos, such as the Heart Foundation tick and the Glycaemic Index (GI) symbol have already been voluntarily used widely in Australia. These signposts have been shown to assist consumers in selecting healthier choices within the same food group.12,13 However, there can be a lack of transparency around the inclusion criteria of privately owned systems and often limited evaluation of the impact. Research has shown that when a signpost is endorsed officially by government legislation or standards, its credibility is strongly increased.8 In the United Kingdom (UK), a voluntary signposting system is not providing a high level of assistance to consumers as some food manufacturers oppose the recommended system and use their own signposts, resulting in a plethora of different signposts creating confusion among consumers. Thus, if an effective, simple-to-use signpost can be identified for use in Australia, a mandatory system supported by Food Standards Australia New Zealand (FSANZ) to govern the use of such a signpost would be preferred, with inclusion criteria clearly presented to the public and its impact evaluated on a regular basis.
Potential signposting systems for use in Australia
There are two nutrition signposting systems that have been developed recently and are considered primary contenders for use in Australia by various population health groups and industry:
-
The colour-coded Traffic Light System (CTLS)
-
The Percentage Daily Intake (%DI)
There are several other signposting systems previously or currently trialled in various countries – for example, the Choices front-of-pack stamp, Smart Spots and Shop Smart with Heart – but these other systems have not been sufficiently evaluated within the Australian context and are not considered within this paper.14–16
Colour-coded Traffic Light System
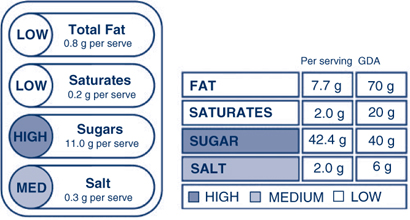
The CTLS has been developed by the Food Standards Agency (FSA) in the UK, where it is currently used. This system categorises the four key nutrients most associated with public health issues (fat, saturated fat, sugars and salt) as high, medium or low compared to a set of agreed criteria and these nutrients are then each given a red, amber or green rating, which are portrayed as red, amber or green traffic lights on the package (Figure 1).17,18 Another light is sometimes included in the signpost for energy content but it is not a core criterion.19 The criteria, which are universal across food types, compare the total fat, saturated fat, sugar and salt content of the food item against the Guideline Daily Amount (GDA) for each 100 g. The cut-offs for each category are summarised in Table 1.19 The FSA recommends a particular list of foods that the CTLS should be used on (mainly composite, processed foods), but does not discourage its use on other products, including drinks.19
|
 red: high;
  amber: medium;
  green: low. Source: Food Standards Agency (UK).

|
The CTLS is designed to promote the moderation message, by encouraging consumers to select food items with more green or amber lights and limit those with red lights.20 Sales data from the UK suggest that this labelling system may be effective, although sales may also be influenced by other factors such as price and promotion. For example, sales of breakfast cereals with mainly green lights or amber lights are growing twice as fast as breakfast cereals in total, and frozen meals with red lights on the label decreased in sales by 35%.21 Similar effects on sales have been reported for other products.22,23
Jones and Richardson demonstrated that a traffic light signpost helps guide the attention of the consumer to the important nutrients (i.e. those associated with chronic disease) as well as improving the accuracy of the healthiness rating of nutrition labels.24 When a traffic light signpost was present, consumers were more likely to assess the healthiness rating using a combination of nutrients, rather than a single one such as fat or energy content. The authors suggest caution when interpreting their results though, as in their study the colour-coded traffic light was placed next to the NIP, whereas it was designed for use on the front of pack.
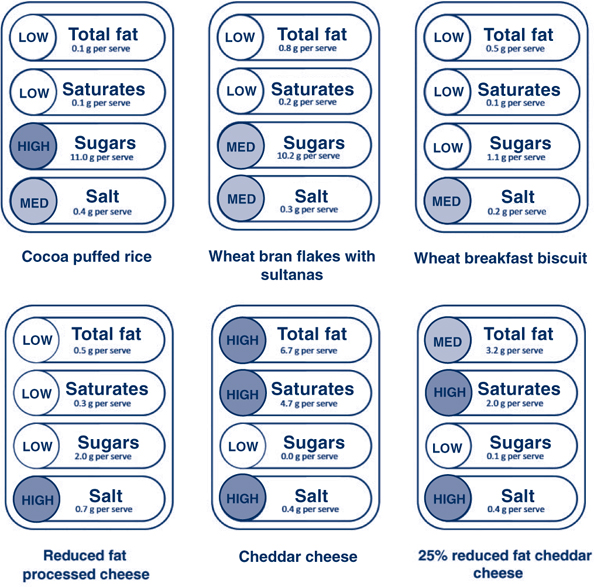
The traffic light signposts of some of the commonly consumed food items generated using the criteria specified in Table 1 are shown in Figure 2.
|
Feunekes et al. indicated that the CTLS gives inconsistent differentiation between healthier and less healthy products within certain categories.8 For example, initially the CTLS did not provide any distinction between breakfast cereals such as cocoa puffed rice and wheat bran flakes with sultanas, even though the latter has a better nutrient profile and is generally regarded as a healthier choice due to the presence of fruit sugars rather than added sugars. The FSA has updated the sugar criteria so that only non-milk extrinsic sugars (NMES) – i.e., added sugars – are considered to determine the red colour code (high) (see Table 1 and Figure 2).19
The CTLS has also been criticised for labelling some core foods such as cheese with three or even four red lights (Figure 2), potentially contributing to a reduction in intake of these foods. This could be avoided if different cut-offs were specific to foods or food groups.20 Such mislabelling could also be avoided by the additional use of a single traffic light to represent the overall nutrient profile or healthiness of the food product, taking into account other nutrients such as fibre and protein. The single traffic light could be generated by criteria similar to the Nutrient Profile Modelling System (NPMS) used by FSANZ in the eligibility assessment of Nutrition, Health and Related Claims.25
Another limitation of the CTLS alone is the potential for confusion around product choice by a consumer when faced, for example, with a product that carries two green lights and two red lights. Consumers may also find it confusing as to whether a 5 g serve of food carrying red lights is less healthy than a 300 g serve of a food carrying amber lights. The CTLS, however, is designed for comparison within a particular food group, and it is unlikely the serving size would vary much within a food group. Also, the overarching concept of discouraging consumption of foods with red lights still applies.
Critics have suggested that CTLS may act as a disincentive for food manufacturers to improve the nutritional composition of food products, if it is not technically possible to move from red to amber or from amber to green.26,27 Certainly many manufacturers were unable to make the required changes to meet the criteria of the National Heart Foundation tick, which is similar conceptually to the single traffic light. However, many manufacturers did respond by removing around 33 tonnes of salt from their products in a year.28
Percentage Daily Intake
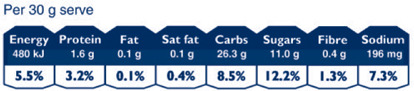
In 2006, the Australian Food and Grocery Council (AFGC) recommended the inclusion of information on the percentage daily intake (%DI) for key nutrients on the packages of their members’ products.29 The %DI labelling concept originated in the USA, where percentage daily value (%DV) is included in the nutrition fact panel. A very similar concept has been developed in the UK, called percentage guideline daily amounts (%GDA).30 In Australia, some food manufacturers have already placed a standalone signpost or %DI counter, for a wide range of nutrients beyond those recommended by the AFGC, on the front of their food packages (Figure 3).29
|
Percentage daily intakes are generally calculated as the percentages of the nutrients provided by one serving of the food compared to the reference value of an average male adult who consumes a daily diet of 8700 kJ. Only the inclusion of the %DI of energy is required under this scheme, but the seven core nutrients (energy, protein, fat, saturated fat, carbohydrates, total sugars and sodium), which are the same as those included in the traditional NIP, are usually listed. Additional %DI values for nutrients such as fibre, vitamins and minerals can also be included in this system, but are not compulsory.
While the %DI counter provides factual information about specific nutrients, it is likely that it is too complex for most consumers. Interpretation requires the consumer to consider:
-
different serving sizes of similar products, as illustrated for breakfast cereals in Figure 4
-
information about other foods to be consumed throughout the day
-
how the guide fits in with their average daily requirement, which is not necessarily the same as an average adult male.

|
In addition, the approach includes ‘negative’ nutrients such as saturated fat and ‘positive’ nutrients such as fibre, which add to the complexity of this system.31 In the case of negative nutrients, the consumer is expected to moderate intake to a recommended upper limit; on the other hand, for positive nutrients, the consumer is expected to pursue the recommended minimum intake. Several studies have reported on the limitations of the %DI to consumers. Levy et al. reported that 71% of adults in a study did not understand the meaning of %DV (the US version of %DI), and most incorrectly rated the fat content of food items using this system.32 In another study, Barone et al. found that the provision of %DV was misperceived by undergraduate participants and the system did not alter judgments about the overall healthiness of a product.33 Notably, recent research by FSANZ shows that non-NIP users are unlikely to benefit from the %DI concept, and that consumers need several attempts to evaluate products in a forced situation before the %DI can be used correctly, severely limiting its application and effectiveness.34
The %DI counter has strong support from some stakeholders who believe the system allows easy comparison between products, and who highlight the existing use of the system, but this appears to be contradicted by consumer research.35 The implementation of this system in Australia and New Zealand would be relatively simple as there is existing approval by FSANZ for the inclusion of %DI information on food packages. The food industry also believes that the use of a %DI counter in Australia and New Zealand could assist international harmonisation of labelling, as many countries use a similar system already. However, Beard has suggested that the industry may favour the %DI counter because it is concerned about the impact of red lights on the sales of certain products.13 Even if manufacturers can reformulate their products such that they carry fewer red or more green lights, the process takes time, costs and is risky to business.4
Support for the %DI system may be more prevalent in the UK where inclusion of an NIP is not mandatory (unless a nutrition claim is made).26,27,36,37 In Australia, the %DI system may be less valuable as NIPs are mandatory and thus the use of the simpler CTLS is a potentialiy useful addition, in combination with the more detailed NIP. %DI information can be effectively included in the CTLS, which has already been demonstrated by UK food manufacturers.
Opponents of the %DI approach are also concerned that the %DI is based on an average male adult diet therefore has little application for children. In contrast, the CTLS is based on per 100 g, which is essentially a percentage, so a red light relating to fat for adults (> 20 g per 100 g) would have the same application to children, though the cut-off may be different.
Conclusion
The advantages and disadvantages of the two systems are summarised in Table 2. Based on this assessment, we believe that a system similar to the Colour-coded Traffic Light System currently used in the UK is likely to be more effective for use in Australia than a percentage daily intake (%DI) counter. In particular, it would complement the more detailed mandatory NIP already in operation. A combination of a single traffic light, based on the overall nutrient profile of the food, together with the CTLS for individual nutrients, including total fat, saturated fat, sugar and salt, would offer additional benefits. Whichever system is chosen, there should be clear and specific mandatory guidelines on how the information should be presented on food packages to minimise confusion to consumers. Further research on the effect of a CTLS on consumer behaviour would be valuable, including investigation of the effect of labelling on sales. Consideration should also be given to producing a set of criteria appropriate for each food group.

|
Acknowledgment
The NSW Centre for Public Health Nutrition is funded by NSW Health and The Nutrition Research Foundation of The University of Sydney. This review was initiated and conducted by the investigators, and does not necessarily represent the view of the funding groups.
[1] van Kleef E, van Trijp H, Paeps F, Fernández-Celemín L. Consumer preferences for front-of-pack calories labelling. Public Health Nutr 2007; 11(2): 203–13.
| PubMed | (Cited 9 August 2007.)
[5] Cowburn G, Stockley L. Consumer understanding and use of nutrition labelling: a systematic review. Public Health Nutr 2005; 8(1): 21–8.
| Crossref | GoogleScholarGoogle Scholar | PubMed | (Cited 20 May 2008.)
[16] Kinnunen TI. The heart symbol: A new food labelling system in Finland. Nutr Bull 2000; 25 335–9.
| Crossref | GoogleScholarGoogle Scholar | (Cited 20 May 2008.)
[18]
[19]
[20] Beard TC, Nowson CA, Riley MD. Traffic-light food labels. Med J Aust 2007; 186(1): 19.
| PubMed | (Cited 7 November 2007.)
[24] Jones G, Richardson M. An objective examination of consumer perception of nutrition information based on healthiness ratings and eye movements. Public Health Nutr 2007; 10(3): 238–44.
| Crossref | GoogleScholarGoogle Scholar | PubMed | (Cited 27 August 2007.)
[26]
[27] Bussell G. Nutritional profiling vs guideline daily amounts as a means of helping consumers make appropriate food choices. Nutr Food Sci 2005; 35(5): 337–43.
| Crossref | GoogleScholarGoogle Scholar | (Cited 9 August 2007.)
[30] Rayner M, Scarborough P, Williams C. The origin of Guideline Daily Amounts and the Food Standards Agency’s guidance on what counts as ‘a lot’ and ‘a little’. Public Health Nutr 2004; 7(4): 549–56.
| Crossref | GoogleScholarGoogle Scholar | PubMed | (Cited 23 October 2007.)
[32] Levy L, Patterson RE, Kristal AR, Li S. How well do consumers understand percentage daily value on food labels? Am J Health Promot 2000; 14(3): 157–60.
| PubMed | CAS | (Cited 9 August 2007.)
[35]
[36]
[37]
[38]