

Sample size calculations for the design of health studies: a review of key concepts for non-statisticians
Alistair Merrifield A C and Wayne Smith BA Centre for Epidemiology and Evidence, NSW Ministry of Health
B Environmental Health Branch, NSW Ministry of Health
C Corresponding author. Email: amerr@doh.health.nsw.gov.au
NSW Public Health Bulletin 23(8) 142-147 https://doi.org/10.1071/NB11017
Published: 21 September 2012
Abstract
Sample size calculations before conducting a health study or clinical trial are important to provide evidence that the proposed study is capable of detecting real associations between study factors. This review aims to clarify statistical issues related to the calculation of sample sizes and is illustrated with an example of a recent study design to improve health outcomes related to water and sewage in NSW Aboriginal communities. The effect of power, significance level and effect size on sample size are discussed. Calculations of sample sizes for individual-based studies are modified for more complex trial designs by multiplying individual-based estimates by an inflationary factor.
Sample size calculations are an important consideration when designing a health study.1,2 Investigators need to provide suitable calculations to ensure that a study is capable of detecting a real effect due to an intervention. While there are articles available to assist researchers who have some statistical background with sample size calculations,2 there are few available for those with limited statistical knowledge. This review is based on a literature review of relevant articles that the authors have found useful. It provides a background understanding for the researcher to be able to more easily communicate with the statistician during the sample size calculation process. We introduce important concepts in a clear and non-technical account to a reader who is uneasy with basic statistics. Suitable references will be given to enable the interested reader to go beyond the scope of this review.
While studies may be conducted to examine differences between treatment groups or to estimate some population statistic,1 here we focus on the former. We introduce the reader to the steps involved in calculating a sample size for an individual-based randomised control trial with treatment and control groups and a binary outcome (two categories). These principles apply to other types of outcomes. The review also discusses the calculation of sample sizes for more complex study designs.
Calculation of sample sizes for studies in which individuals are randomised
Three fundamental factors are involved in calculating sample sizes: significance level, power and effect size (defined in Table 1). We recommend Kirby et al. for a more detailed discussion.2 When consulting a statistician for a sample size calculation, a researcher can help assist the process with a knowledge of these three parameters. Various sample size calculators are available online, which further explain the relationship of these three components to sample size (these tools should be used with appropriate statistical advice).3

|
The process for calculating a sample size is:4
-
Specify the null and alternative hypotheses, power, effect size and significance level.
-
Define the study population.
-
Estimate the required parameters (e.g. means, standard deviations) from the available data. These estimates are often derived from pilot studies and literature searches.
-
Calculate a range of sample sizes for a range of parameters (to provide different scenarios).
-
Choose the most appropriate sample size from these scenarios, given the study constraints.
Example
A proposed study to examine the intervention of improved water and sewage on health outcomes in discrete NSW Aboriginal communities (Aboriginal Communities Water and Sewage Program Health Outcomes Evaluation) provides an illustration of sample size calculations. The health outcome under consideration is the presence of intestinal infections. The measure for the study is expressed as a relative risk (RR), which is the ratio of the probability of intestinal infections in the Aboriginal communities before and after the intervention. Sample size formulae for binary outcomes (presence or absence of intestinal infections) are given in Wittes and Campbell et al. (with formulae for other situations).4,5
Sample size calculations are based on a set of assumptions. For this example we assume that information from the previous Housing for Health in NSW study6 holds true for our proposed study. From this study, we estimate the probability of intestinal infection before the intervention as 0.051. We assume that there are equal numbers of people in both the treatment and the control groups, significance level 5% and power 80%. We alter effect size (the difference between probabilities before and after intervention) to give us a range of sample sizes corresponding to different scenarios. In addition to the reduction in the prevalence of intestinal infections of 43% seen in the Housing for Health in NSW study, we also present a worst case of a 20% reduction, an intermediate reduction of 50% and a best reduction of 60%. The resulting sample sizes for the Aboriginal Communities Water and Sewage Program Health Outcomes Evaluation are calculated from formulae 7B and 7C in Wittes4 (Table 2). From Table 2, we see that the smaller the detectable difference, the larger the sample size required (if all other parameters are held constant). The Housing for Health in NSW study reported a relative reduction of 43%; the probability of intestinal infection after the intervention is (1 – 0.43) × 0.051 = 0.029. The absolute effect size is 0.051 – 0.029 = 0.022. The corresponding sample size is 2686 (Table 2).

|
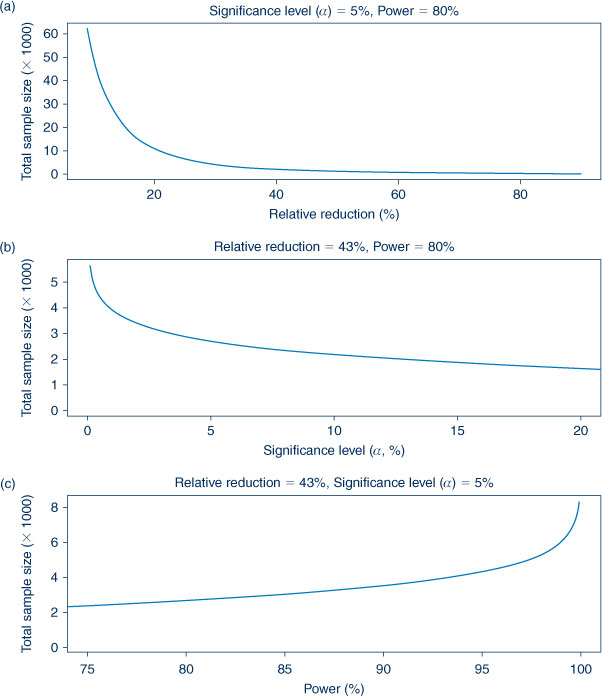
Figure 1 shows the effect that power, significance level and effect size have on sample size. Figure 1(a) shows the relationship of different effect sizes on sample size. A decreasing relative reduction means a smaller difference to be detected between treatment and control outcomes which requires a larger sample size. The effect of significance level is shown in Figure 1(b). Ideally, a study should mistakenly reject a true null hypothesis of no treatment effect as few times as possible. For this to occur, a smaller significance level and consequently a larger sample size are required. Figure 1(c) shows the effect of power on sample size. Increased power means a study is more likely to correctly reject a null hypothesis of no treatment effect and a larger sample size is required. A study with more precise estimates of treatment effects will have higher power and lower significance level; this situation comes at the cost of a larger sample size. We recommend Kirby et al. to describe the relationship of significance level, power and effect size on sample size.2
|
Calculation of sample sizes for studies in which clusters of individuals are randomised
The Aboriginal Communities Water and Sewage Program Health Outcomes Evaluation study is a more complicated design as the community (not the individual) receives the intervention. The intervention is an improved water and sewage program. Such an intervention cannot feasibly be delivered to individuals. The clusters are communities and the intervention is randomised to clusters. The sample size calculation for a cluster study involves calculating the corresponding sample size for an individual study and multiplying this by an inflationary factor to account for the more complex trial design.7–10 This inflationary factor is called the design effect (DE). Eldridge et al. provide formulae for design effects for various continuous (e.g. blood pressure, weight) and binary (e.g. whether the patient has the disease or not) outcomes.7 The estimation of a design effect for cluster randomised control trials involves three factors: mean size of clusters, variation of cluster size and intra-cluster correlation (ICC).
The intra-cluster correlation can be regarded as a measure of the degree of similarity in outcomes between clusters.11 There have been previous papers presenting intra-cluster correlations for different cluster units and populations.12,13 Appropriate intra-cluster correlations for binary outcomes are discussed in Ridout et al.14 These outcomes have an associated variance, which can be modelled as two components: variation in outcomes between clusters and variation in outcomes within each cluster. The intra-cluster correlation is the ratio of the between-cluster variation to total variation (the sum of the between and the within). The intra-cluster correlation is between 0 and 1. Small values of intra-cluster correlation imply that variation within clusters is much greater than variation between clusters and the clustering effect of individuals is less important. If the intra-cluster correlation is zero, outcomes can be regarded as being the same between clusters. The intra-cluster correlation is estimated from available data on cluster sizes and the number of outcomes (intestinal infections) within each cluster.
Example
Information about the size of clusters must be included in our study. We base this on the Housing for Health in NSW study.6 The clusters are of different sizes and therefore we estimate a mean cluster size and cluster size variation (using standard deviation). From the Housing for Health in NSW study,6 the mean cluster size = 150.7 and standard deviation = 103.5.
We estimated the intra-cluster correlation using the cluster information from the Housing for Health in NSW study (formula 7 in Ridout et al.14). The intra-cluster correlation is estimated as 0.007. We present estimated sample sizes in Table 3. In addition to the reduction in the prevalence of intestinal infections of 43% seen in the Housing for Health in NSW study, we also present a worst case of a 20% reduction, an intermediate of 50% and a best of 60% (assuming 80% power, 5% significance level and equal numbers in groups). We multiply the individual sample sizes presented in Table 2 by the design effect to obtain the estimates in Table 3. From Table 3, the corresponding sample size is 7074.

|
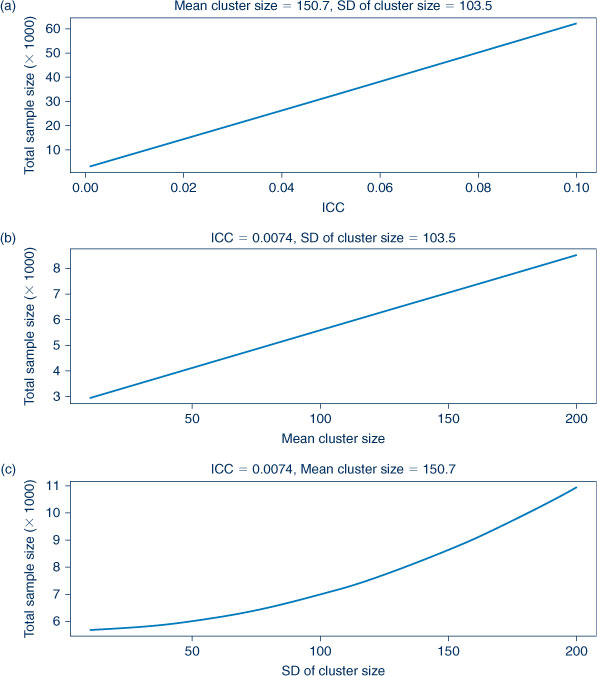
Figure 2 shows the relationships of intra-cluster correlation and cluster size on sample size. From Figure 2(a), it is apparent that the estimate of the intra-cluster correlation will have a large impact on sample size. As outcomes between clusters become more heterogeneous, the intra-cluster correlation increases. This decreases precision in the resulting outcome estimates from the clusters, and larger samples are thus needed. If the intra-cluster correlation is zero and there is no variation between clusters, the design effect (DE) = 1 and the resulting sample size is equivalent to an individual-level trial size.
|
Individual-level studies are more efficient than cluster-level studies7 which is reflected by the larger sample size in response to increased (mean) cluster size shown in Figure 2(b). All other things being equal, an increasing cluster size standard deviation results in increased sample size (Figure 2(c)). Intuitively, increased standard deviation reflects increasing disparity between the size of the clusters. Due to less precise estimates, a larger sample size is required. Trials are more statistically efficient for similar sized clusters and need smaller sample sizes. Larger samples are required for increasing mean and standard deviation.
Other factors affecting sample size calculations
There are other important factors that need to be accounted for in sample size calculations, including losses to follow-up, unequal treatment group sizes and the noncompliance of subjects to the intervention.1,2,4 If the study investigator is able to provide an estimate of these factors to the statistician, the calculation of the required sample size will be improved.
Discussion
The calculation of sample sizes is based on several parameters; the researcher should at least be aware of power, significance level and effect size. Increased power, smaller significance level and smaller effect sizes translate into larger sample sizes. The researcher and statistician are faced with selecting the most appropriate sample size from an appropriate set of parameters (subject to financial and logistical constraints).
Sample size calculations for more complex study designs can be regarded as multiplying the estimated sample size from an equivalent individual-level study by a design effect. Additional considerations involved in the calculation of this design effect include estimating the intra-cluster correlation and the sizes of the clusters, losses to follow-up and noncompliance.
Sample size calculations are an important and complex part of study design and should be discussed by study investigators and statisticians as early as possible during the design of a study design.
Acknowledgment
AM was employed as part of the NSW Biostatistical Officer Training Program funded by the NSW Ministry of Health while undertaking this work based at Environmental Health Branch, NSW Health. We thank the reviewers for their comments.
References
[1] Whitley E, Ball J. Statistics review 4: Sample size calculations. Crit Care 2002; 6 335–41.| Statistics review 4: Sample size calculations.Crossref | GoogleScholarGoogle Scholar |
[2] Kirby A, Gebski V, Keech AC. Determining the sample size in a clinical trial. Med J Aust 2002; 177 256–7.
[3] Campbell MK, Thomson S, Ramsay CR, MacLennan GS, Grimshaw JM. Sample size calculator for cluster randomised trials. Comput Biol Med 2004; 34 113–25.
| Sample size calculator for cluster randomised trials.Crossref | GoogleScholarGoogle Scholar |
[4] Wittes J. Sample size calculations for randomised controlled trials. Epidemiol Rev 2002; 24 39–53.
| Sample size calculations for randomised controlled trials.Crossref | GoogleScholarGoogle Scholar |
[5] Campbell MJ, Julious SA, Altman DG. Estimating sample sizes for binary, ordered categorical, and continuous outcomes in two group comparisons. BMJ 1995; 311 1145–8.
| Estimating sample sizes for binary, ordered categorical, and continuous outcomes in two group comparisons.Crossref | GoogleScholarGoogle Scholar | 1:STN:280:DyaK28%2FkvVymug%3D%3D&md5=f544488e7eae9a83d4c9bba9617ff358CAS |
[6] Closing the gap: 10 years of Housing for Health in NSW. An evaluation of a healthy housing intervention. Aboriginal Environmental Health Unit, NSW Health. 2010. Available from: http://www.health.nsw.gov.au/pubs/2010/pdf/housing_health_010210.pdf (Cited 12 August 2011).
[7] Eldridge SM, Ashby D, Kerry S. Sample size for cluster randomised trials: effect of coefficient of variation of cluster size and analysis method. Int J Epidemiol 2006; 35 1292–300.
| Sample size for cluster randomised trials: effect of coefficient of variation of cluster size and analysis method.Crossref | GoogleScholarGoogle Scholar |
[8] Bland JM, Kerry SM. Statistics notes: trials randomised in clusters. BMJ 1997; 315 600
| Statistics notes: trials randomised in clusters.Crossref | GoogleScholarGoogle Scholar | 1:STN:280:DyaK2svkvVKgtA%3D%3D&md5=8b38f1237f4868473f820274de912652CAS |
[9] Kerry SM, Bland JM. Statistics notes: sample size in cluster randomisation. BMJ 1998; 316 549
| Statistics notes: sample size in cluster randomisation.Crossref | GoogleScholarGoogle Scholar | 1:STN:280:DyaK1c7mt1entg%3D%3D&md5=d35d444fa35ceacee97f36ca07b6e1fcCAS |
[10] Kerry SM, Bland JM. Statistics notes: analysis of a trial randomised in clusters. BMJ 1998; 316 54
| Statistics notes: analysis of a trial randomised in clusters.Crossref | GoogleScholarGoogle Scholar | 1:STN:280:DyaK1c7htlWjsw%3D%3D&md5=47db8005e60f73cf5b39182f72e01735CAS |
[11] Kerry SM, Bland JM. Statistics notes: the intracluster correlation coefficient in cluster randomisation. BMJ 1998; 316 1455
| Statistics notes: the intracluster correlation coefficient in cluster randomisation.Crossref | GoogleScholarGoogle Scholar | 1:STN:280:DyaK1c3jvFKisQ%3D%3D&md5=f09d7349ab21f74c596e18c9e2cded3cCAS |
[12] Knox SA, Chrondros P. Observed intra-cluster correlation coefficients in a cluster survey sample of patient encounters in general practice in Australia. BMC Med Res Methodol 2004; 4 30
| Observed intra-cluster correlation coefficients in a cluster survey sample of patient encounters in general practice in Australia.Crossref | GoogleScholarGoogle Scholar |
[13] Mickey RM, Goodwin GD. The magnitude and variability of design effects for community intervention studies. Am J Epidemiol 1993; 137 9–18.
| 1:STN:280:DyaK3s7mslagsQ%3D%3D&md5=b71c7409b642a817236bd61a3229f114CAS |
[14] Ridout MS, Demétrio CG, Firth D. Estimating intraclass correlation for binary data. Biometrics 1999; 55 137–48.
| Estimating intraclass correlation for binary data.Crossref | GoogleScholarGoogle Scholar | 1:STN:280:DC%2BD3M3ntV2qtQ%3D%3D&md5=8302250fb3a75f4fa24a7c83fcfcdf63CAS |