

Year in review: health protection in NSW, 2012
Health Protection NSWNSW Public Health Bulletin 24(3) 105-118 https://doi.org/10.1071/NB13009
Published: 23 December 2013
Health protection involves the prevention and control of threats to health from communicable diseases and the environment. In New South Wales (NSW) in 2012 these functions were carried out by a range of groups, among them Health Protection NSW’s Communicable Diseases and Environmental Health Branches, the NSW Ministry of Health’s Population and Public Health Division, Public Health Units, clinicians, Local Health District services, local government, other government agencies, and communities.
In this report we highlight the major health outcomes and achievements related to Health Protection NSW’s activities in 2012, including some examples of health protection projects done in the field (Boxes 1–6). The health outcomes described in this report are measured mainly through routine surveillance data that are derived from notifications of selected diseases provided by doctors, hospitals and laboratories to Public Health Units under the NSW Public Health Act 2010.
| Box 1. NSW Denominator Data Project |
| Positive laboratory results for notifiable conditions are reported by each pathology service to the local Public Health Unit. This provides information about the number of new cases of disease. Data on the level of testing is useful to indicate whether an apparent increase in notification is due to increased testing. The NSW Denominator Data Project began in January 2012 to collect the total number of tests performed per month (the denominator data) for selected notifiable conditions with significant public health implications from 14 public and private laboratories in NSW. The data for sexually transmitted infections (HIV, chlamydia and gonorrhoea), vectorborne infections (Ross River and Barmah Forest viruses), pertussis and enteric diseases are reported in a web-based secure site per laboratory. The reported data are interpreted per laboratory (to account for various testing methods) and collated to give monthly aggregated data per condition. Comparison with notifications provides an indication of a trend in incidence to enable timely public health action. As no demographic information is provided, the data cannot be used to indicate specific rates for age, sex or geographic location. The positivity rate for all conditions in 2012 ranged from 0.1% (shigellosis) to 5.7% (chlamydia infection). Notifications for chlamydia and gonorrhoea were correlated with testing, while the incidence of enteric conditions suggests that seasonal factors rather than testing patterns influence notification rates. |
| Box 2. Backyard tattooists: risky business for all involved |
| The growth in the popularity of body art, coupled with the ease of buying body art equipment over the internet, has contributed to an apparent increase in skin penetration procedures done at home by ‘backyard tattooists’. Unsterile skin penetration runs the risk of spreading viral, bacterial, and other infections. During 2012, the North Coast Public Health Unit (PHU) responded to six complaints about backyard tattooists. The complaints included two from parents whose children had been tattooed by other children without the parents’ knowledge, one from a mother concerned that her child’s tattoos were performed by an adult tattoo operator without the mother’s knowledge, and three from concerned registered tattoo parlours. In response, staff from the PHU visited, inspected or wrote to the alleged backyard tattooists, informing them of the health risks and legal implications, and involving council or police assistance where necessary. The PHU also issued a media release warning of the potential risks of backyard tattoos, and contributed an article to the Department of Education and Communities’ regional weekly electronic newsletter for primary and secondary school staff across the North Coast. |
| Box 3. Sydney cruise ship health surveillance and inspection |
| Sydney Harbour is the busiest cruise ship destination in Australia with over 200 voyages arriving in 2012, bringing half a million people to the city. With this come public health risks: cases of infectious diseases on cruise ships are commonplace and outbreaks of respiratory disease and gastroenteritis occur. In response, the South Eastern Sydney Public Health Unit (PHU) has developed two public health programs: the Cruise Ship Health Surveillance Program and the Vessel Inspection Program. These programs aim to monitor disease occurrence, increase preventive action and offer operational public health advice to international vessels entering the Port of Sydney. During the period 2006–2011, the Cruise Ship Health Surveillance Program was involved in the investigation of 45 outbreaks of disease onboard cruise ships entering Sydney; 30 of these outbreaks were caused by gastroenteritis and almost half of these were confirmed to be due to norovirus. Of 15 outbreaks of respiratory disease, influenza was confirmed in seven. Environmental inspection of vessels occurs routinely or as part of an outbreak investigation. A Vessel Inspection Manual has been written by staff of the PHU to provide guidance on inspection items including the potable water supply system; the medical facilities including vaccine storage; recreational water facilities; childcare facilities; collection, storage and disposal of waste; skin penetration procedures; pest control strategies; general infection control standards; and ventilation systems. A website has been developed to provide advice to passengers, crew and their agents and to present monthly reports of the proportion of acute respiratory disease and acute gastroenteritis reported by cruise ships. The Environmental Health Vessel Inspection Manual and a 5-year report of the Cruise Ship Health Surveillance Program are available at: http://www.seslhd.health.nsw.gov.au/Public_Health/CruiseShipProgram/default.asp |
| Box 4. Avian influenza in Hunter New England |
| An outbreak of low pathogenicity H9N2 at a Hunter New England turkey farm in April 2012 was the first such outbreak detected in Australian poultry. Eight human contacts were provided with seasonal influenza vaccination and placed under surveillance until 7 days after last poultry exposure. All remained well and baseline serology demonstrated no evidence of influenza A infection. Antivirals were not used. All birds were destroyed. |
| Enhanced surveillance by the Department of Primary Industries subsequently identified low pathogenicity H9N2 in a second turkey flock in Hunter New England. There was no significant poultry illness and repeat testing confirmed clearance of the virus from the flock. Six human contacts were encouraged to have seasonal influenza vaccination through their general practitioner and were monitored; none developed significant illness. Nose and throat swabs collected from two contacts with mild upper respiratory symptoms were positive for rhinovirus and enterovirus. Serology was not collected and antivirals were not used. No clear pathway of transmission between farms was identified and the same virus was later identified in water birds in the region. |
| In November, highly pathogenic H7N7 was detected in poultry on an egg farm in the region. Seven close human contacts were monitored and the offer of antiviral prophylaxis was accepted by one. Nose and throat swabs from a contact with upper respiratory symptoms tested negative for influenza and other respiratory pathogens by polymerase chain reaction. No other illness developed. All birds were destroyed. |
| The need for modified public health responses to low pathogenicity avian influenza outbreaks (rather than adopting high pathogenicity avian influenza protocols), with a limited role for serology and questionable value of antivirals during these outbreaks, were important lessons arising from the management of these avian influenza outbreaks. |
| Box 5. Public health emergency preparedness exercises |
| Sourcing ciprofloxacin for 200 people? Identifying the cause of a mysterious illness affecting children in the state’s southwest? These fictional scenarios, considered as part of discussion exercises focused on an intentional release of anthrax spores (August 2012) and a contaminated consumer product (December 2012), are one of the best ways to test response arrangements, build relationships and identify planning gaps. In 2012 Health Protection NSW and the Office of the Chief Health Officer launched a series of exercises focused on public health responses to major incidents or emergencies. Health Protection NSW, the NSW Ministry of Health, Public Health Unit staff, and colleagues from other health specialities (e.g. pharmaceutical services, microbiology and toxicology) were brought together to tackle some of the trickier aspects of the myriad of incidents managed by public health services. The discussions, while always entertaining, also contribute to a common understanding of the tools and strategies we have at our disposal. |
| In the spirit of strengthening NSW Health’s ability to deal with major emergencies and natural disasters, the Office of the Chief Health Officer led the development of a pilot specialised public health commander course. Following a competitive tender process, the course was developed in consultation with key public health practitioners and delivered to 21 participants over 3 days in June 2012. The aim of the course was to enhance the ability of senior NSW public health professionals to effectively lead teams during responses to emergencies or major incidents. The course enabled participants to interact with a range of existing emergency management tools and processes that are available for use in both emergency situations and day-to-day operations. The course also reinforced existing emergency management concepts and arrangements, including how to apply an incident control system. |
| Box 6. Investigating Legionnaires’ disease clusters in western Sydney |
| From February to April 2012, 14 cases of Legionnaires’ disease due to Legionella pneumophila serogroup 1 were reported in Western Sydney and Nepean Blue Mountains residents. This was around twice the number of cases usually seen in this period. The cases had onset in three clustered periods: early February, mid-March and late April. There were several locations in western Sydney that more than one case had visited during the incubation period of the illness common to each of the clusters. In collaboration with environmental health officers from local councils, all known cooling towers within 500 m of places that cases had visited were inspected, and water samples were taken. Public Health Unit (PHU) and council environmental health officers also searched for and tested other potential sources of L. pneumophila, such as unregistered cooling towers, untreated water irrigation systems, car washes, fountains and misting systems. The environmental investigation did not identify the source of infection, however notification rates returned to the normal level after April. A review of weather patterns showed that during the incubation period prior to each cluster of cases the conditions were particularly humid and cloudy. From late April to the end of May there were no further days of complete cloud cover and high humidity. The PHU hypothesises that the periods of complete cloud cover and high humidity may have allowed L. pneumophila to survive longer in an aerosol and travel further than usual. |
Tables 1–6 show disease-specific data on notifiable conditions reported by: year of onset of illness; month of onset of illness; Local Health District; and age group and sex. Note that the degree to which notification data reflect the true incidence of disease varies and is subject to a range of caveats.1

|

|

|

|

|

|
Surveillance
Vaccine-preventable diseases
In 2012 there were:
-
no haemophilus influenzae type b notifications in children aged less than 5 years for the first time since 1993
-
5824 pertussis notifications (including one death in a 7-week old infant), a marked decrease from the record numbers in 2011 (>13 000)
-
172 measles notifications, of which two were imported from overseas, 169 were found to be linked to an imported case (measles virus D8), while another was locally acquired but presumably acquired from an imported case not identified through surveillance (measles virus B3). Most cases were notified by South Western Sydney and Western Sydney Local Health Districts. People of Pacific Islander ethnicity and Aboriginal people were disproportionately affected. There were 58 notifications in children aged less than 5 years, with 37 notifications in infants aged less than 1 year (too young to be vaccinated)
-
66 meningococcal disease notifications, the lowest number since the introduction of the meningococcal C vaccine in 2003. Of these, 43 were due to serogroup B (65%), five were due to serogroup Y (8%), four were due to serogroup W135 (6%), two were due to serogroup C (3%), and 12 were of an unknown serogroup (18%). The two cases of meningococcal C disease were reported in young adults who were not vaccinated. Meningococcal notifications have been declining for more than a decade
-
105 mumps notifications, an increase from the 67 reported in 2011. The highest notifications were in metropolitan areas and in under-vaccinated persons aged 30–34 years (n = 27), followed by those aged 35–39 years (n = 15)
-
566 invasive pneumococcal disease notifications, a slight increase compared with 529 in 2011. Serotype 19A was identified as the cause of infection in 33% of cases in children aged less than 5 years and 17% of the remainder of the cases where typing was available.
Bloodborne viruses
In 2012 there were:
-
2328 total hepatitis B case notifications, an 8% decrease compared with 2011 (n = 2525) and the lowest recorded number in 20 years (total notifications are mainly of people whose time of infection is unknown). Fifty-four percent of cases were male and 30% were aged between 25 and 34 years
-
28 newly-acquired hepatitis B case notifications, a 7% decrease compared with 2011 (n = 30). Eighty-six percent of cases were male
-
3292 total hepatitis C case notifications, similar to the number reported in 2011 (n = 3326). Sixty-four percent of cases were male and 34% were aged between 30 and 39 years
-
47 newly-acquired hepatitis C case notifications, an 8% decrease compared with 2011 (n = 51). Sixty-six percent of cases were male
-
409 cases of newly-diagnosed HIV infection, a 24% increase compared with 2011 (n = 330). The increase was across most at-risk groups. Most new HIV infections were reported to be male homosexually-acquired (81%), with other risk exposure categories reported as heterosexual contact (14%) and injecting drug use (2%). The proportion of people with newly-diagnosed homosexually-acquired HIV infection who reported having an HIV test in the year prior to diagnosis decreased slightly from 42% in 2011 to 40% in 2012, while the proportion of those who reported no previous HIV test prior to diagnosis rose from 14% in 2011 to 17% in 2012.
Sexually transmissible infections
In 2012 there were:
-
21 291 chlamydia case notifications, a 4% increase compared with 2011 (n = 20 570). Fifty-six percent of cases were female and 58% were aged between 15 and 24 years
-
4127 gonorrhoea case notifications, a 43% increase compared with 2011 (n = 2882). Eighty-one percent of cases were male and 39% were aged between 20 and 29 years
-
498 infectious syphilis case notifications, a 19% increase compared with 2011 (n = 418). Almost all cases (96%) were male and 30% were aged between 40 and 49 years
-
29 lymphogranuloma venereum (LGV) case notifications, a 19% decrease from the 36 in 2011. All cases were male, and 35% were aged between 30 and 39 years. The number of LGV notifications has decreased since 2010 following an outbreak early in that year. The outbreak in NSW occurred in the global context of increased European rates of LGV infection in men who have sex with men.2
Enteric diseases
In 2012 there were:
-
7669 enteric disease case notifications, a 6% increase compared with the average annual count for the previous 5 years
-
2955 salmonellosis case notifications, a 15% decrease compared with 2011 and similar to the average annual count for the previous 5 years
-
61 outbreaks of probable foodborne disease affecting 662 people, an increase compared with 47 outbreaks affecting 797 people in 2011
-
803 outbreaks of probable viral gastroenteritis in institutions affecting 13 842 people, an increase compared with 525 notifications affecting 9071 people in 2011. The increase was likely related to the emergence of a new variant of norovirus GII.4 (known as Sydney 2012)3
-
13 point-source outbreaks of Salmonella Typhimurium infection affecting 162 people, most likely associated with the consumption of sauces and desserts prepared with raw eggs.
Respiratory diseases
In 2012 there were:
-
61 Legionnaires’ disease case notifications due to Legionella pneumophila infection, compared with 60 cases in 2011. Public health investigations did not identify any common sources for these cases. L. pneumophila cases peaked in February 2012 with 12 cases reported. Notifications due to L. longbeacheae infection decreased (29 compared with 38 cases in 2011)
-
7999 notifications of influenza, an increase compared with 5773 notifications in 2011. Approximately 78% of laboratory-confirmed influenza was influenza A, with the influenza A(H3N2) strain predominating (97%). The incidence of influenza B increased later in the season and accounted for 21% of laboratory-confirmed influenza cases overall. While laboratory-confirmed influenza notifications are likely to represent only a small proportion of cases in the community, other indicators of increased influenza activity in 2012 were: an increase from June to September of people presenting to emergency departments with influenza-like illness (well above the normal expected range); and a marked increase in the number of reported outbreaks of respiratory illness in aged-care and other residential care facilities. The increase in morbidity due to influenza is most likely because the predominant strain (influenza A(H3N2)/Victoria/361/2011) was different to the strain in the 2012 influenza vaccine
-
471 notifications of tuberculosis, a decrease from the 523 cases reported in 2011
-
three cases of multi-drug resistant tuberculosis (MDR-TB). Five cases per year were reported in 2010 and 2011.
Vectorborne diseases
In 2012 there were:
-
603 Ross River virus infection notifications, an increase from 579 in 2011
-
347 Barmah Forest virus infection notifications, a 24% decrease compared with the 458 notifications in 2011
-
208 dengue fever case notifications, a 50% increase compared with the 139 notifications in 2011. The majority of the cases in 2012 were linked to international travel; Indonesia was the most commonly reported exposure site (40%), followed by Thailand (21%), India (7%) and the Philippines (5%). While there currently is no local transmission of dengue fever in NSW, it is the most common mosquitoborne viral disease of humans worldwide and represents a major international public health concern
-
70 malaria case notifications, compared with 77 in 2011. All were acquired overseas. Travel to India was the most commonly reported exposure site (19%), followed by Sudan and Pakistan (both 10%)
-
no confirmed cases of flavivirus infections, Kunjin virus infections or Murray Valley encephalitis virus infections notified
-
two confirmed cases of Chikungunya, both acquired outside Australia (India and Kenya); this is a decrease from the 10 cases notified in 2011.
Zoonotic diseases
In 2012 there was:
-
a slight decrease in Q fever case notifications (116 compared with 137 in 2011). Q fever was the most commonly notified zoonotic disease in 2012
-
a slight decrease in brucellosis infections (four compared with six in 2011). Two cases were overseas-acquired and two infections were in hunters of feral pigs in Northern NSW.
Prevention activities
Immunisation
In 2012 NSW Health:
-
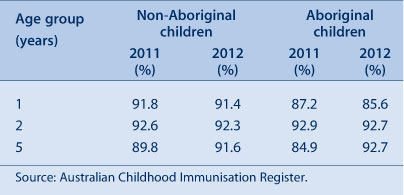
maintained high immunisation coverage rates for children at 1, 2 and 5 years of age (Table 7). While coverage rates for Aboriginal and non-Aboriginal children are comparable at 2 and 5 years of age, coverage for Aboriginal children is less at 1 year of age and Aboriginal children are more likely to be vaccinated late at any age
-
funded a pilot program to employ Aboriginal Health Workers to work collaboratively with existing services to promote timely vaccination of Aboriginal children through targeted interventions
-
developed an immunisation awareness campaign to inform the community and providers about the importance of ensuring that children are fully vaccinated on time
-
successfully implemented the transition from Prevenar 7 to Prevenar 13 vaccine for children at 2, 4 and 6 months of age, and a supplementary program for children who had commenced Prevenar 7 vaccination to provide greater protection against pneumococcal disease
-
introduced a more focused pertussis control strategy by offering new mothers free pertussis vaccine in the maternity unit after the birth of their child or via their general practitioner (GP) within 2 weeks post-birth
-
increased immunisation coverage rates for adolescents in the NSW School-Based Vaccination Program for vaccines offered to students in Years 7 and 10 (Table 8)
-
facilitated the provision of free seasonal influenza vaccine to people at high risk of severe influenza complications. The NSW Health Population Health Survey estimated that 31% of all respondents (95% CI: 28–33%) interviewed during August and September 2012 had received a seasonal influenza vaccine in the previous 12 months; vaccine uptake was similar to the estimate for the same period in the previous year (33% [95% CI: 31–35%]). For respondents aged 65 years and over (one of the identified high-risk groups), the estimated vaccination rate was 72% (95% CI: 69–76%), which is similar to previous years.
|

|
Disease control
In 2012 Health Protection NSW:
-
initiated a range of control measures to contain the measles outbreak, including sending letters to health care providers, issuing media alerts, developing measles alert posters and other materials for health care facilities and local GPs, and holding free local vaccination clinics in areas with high rates of measles infections
-
continued an influenza prevention campaign that focused on three key respiratory disease prevention messages: Cover your face when you cough or sneeze; Wash your hands; and Stay at home if you're sick so you don't infect others. The campaign included distribution of The Spread of Flu is Up to You campaign posters; vaccination and pregnancy brochures; and infection control signage to health care facilities, aged-care facilities and a range of other sectors
-
with local Public Health Units and an expert sub-committee of the NSW Tuberculosis Advisory Committee, continued to develop and implement strategies to eliminate transmission of tuberculosis in Aboriginal communities in NSW. This work involves better understanding barriers to early presentation to health services and non-compliance with treatment for latent tuberculosis infection, and investigation of strategies to raise awareness and increase early diagnosis of tuberculosis. The Northern NSW and Mid North Coast Local Health Districts have employed two Aboriginal Community Engagement Consultants to work directly with local Aboriginal communities on awareness-raising and prevention activities
-
continued the NSW Arbovirus Surveillance Program, which included testing for both alphaviruses (Barmah Forest, Ross River and Sindbis virus) and flaviviruses (Alfuy, Edge Hill, Kokobera and Stratford) in mosquitoes trapped at 20 coastal, inland and metropolitan locations, and testing of chickens for antibody seroconversion to Murray Valley encephalitis virus and Kunjin virus at 10 sites in inland NSW from November 2011 to April 2012. During the 2011–2012 season inland areas had seen considerable arboviral activity with 67 isolates from mosquitoes and 15 seroconversions for Murray Valley encephalitis virus in chickens. Inland areas have also seen extremely high numbers of mosquitoes due to excessive precipitation and flooding. Coastal and Sydney metropolitan areas had low vector abundance and minimal arboviral activity
-
issued statewide media releases in January, March and December, warning about the increased risk of mosquitoborne infections and how to prevent them. In addition, advice on mosquito control in flood-affected areas was provided to councils and the general public in March. These were supplemented by the information on the Ministry of Health website, development of guiding principles for environmental health officers, distribution of Fight the Bite posters and brochures, radio advertising and a range of local media messaging by public health officials.
Drinking water
In 2012 Health Protection NSW:
-
together with local Public Health Units, helped more than 30 local water utilities develop risk-based drinking water management systems, consisting of documents, procedures and other supporting information for the safe supply of drinking water. These systems allow water utilities to document current practices that fulfil Australian Drinking Water Guidelines4 requirements, identify any gaps, conduct risk assessment workshops, identify critical control points (e.g. filtration and disinfection), and develop operational procedures for critical control points
-
developed guidelines jointly with the NSW Office of Water (NSW Guidelines for Drinking Water Management Systems)5 and the NSW Food Authority (NSW Guidelines for Water Carters)6 to assist water suppliers to comply with the requirements of the NSW Public Health Act 2010 for all suppliers of drinking water to develop, by 1 September 2014, a management system based on the Framework for Management of Drinking Water Quality (Australian Drinking Water Guidelines 2011)7
-
rebuilt the NSW Drinking Water Database, which holds the results of drinking water monitoring across regional NSW, to improve data management and reporting
-
reviewed multiple applications for water recycling
-
continued to regulate major water utilities (Hunter Water Corporation, Sydney Water Corporation and Sydney Catchment Authority), monitor compliance of utilities with the NSW Fluoridation of Public Water Supplies Act 1957, and oversee more than 100 regional water utilities.
Aboriginal health
NSW Housing for Health
In 2012:
-
Housing for Health8,9 projects were underway in Broken Hill, Tibooburra, Purfleet/Taree, Box Ridge/Coraki, Walhallow, Cabbage Tree Island and Toomelah/Boggabilla. NSW Health, in partnership with other state and Commonwealth agencies, has been delivering Housing for Health projects in the Aboriginal community housing sector across NSW since 1998. Housing for Health aims to test and repair or replace health hardware (mainly plumbing or electrical items) so that houses are safe and occupants have the ability to carry out evidence-based healthy living practices (such as washing people and clothes). The Program has surveyed and serviced over 2826 houses in 86 Aboriginal communities over the period 1998–2012. Over 81 000 items relating specifically to improved health and safety have been fixed, benefiting approximately 12 100 people
-
integrated projects (i.e. Housing for Health projects run together with the Aboriginal Housing Office housing upgrade projects) were underway in Toomelah/Boggabilla, and preparations began for a project in Murrin Bridge.
Aboriginal Communities Water and Sewerage Program
In 2012:
-
seven new Aboriginal communities began receiving improved water and sewerage services (bringing the total to 41 communities, and over 4000 people receiving improved water and sewerage services under the Program). Regional Public Health Units worked with communities, the NSW Office of Water, local water utilities and service providers to implement Risk-Based Water and Sewerage Management Plans. The Aboriginal Communities Water and Sewerage Program10 is a joint partnership between the NSW Government and the NSW Aboriginal Land Council. It aims to ensure adequate operation, maintenance and monitoring of water supplies and sewerage systems in over 60 Aboriginal communities in NSW. NSW Health is involved in the development and roll-out of the Program across the state.
The Aboriginal Environmental Health Officer Training Program
In 2012 there were:
-
11 Aboriginal environmental health officer trainees participating in the Program
-
12 graduate Aboriginal environmental health officers from the Program
-
nine Training Program partnerships under 50/50 funding agreements:
-
-
four partnerships with Public Health Units
-
four three-way partnerships with Public Health Units and Local Government
-
one partnership with Local Government.
-
Heat
In November 2012, when a period of unseasonably hot weather coincided with a number of major events in Sydney, the NSW Heatwave Sub Plan was activated for the first time. NSW Health worked closely with the NSW Police Force and other agencies to ensure the public were provided with clear and consistent advice on how to minimise the risk of heat-related illness.
Implementation of Public Health Regulation 2012
In 2012 Health Protection NSW:
-
developed supporting resources including forms, information sheets, fact sheets and audit tools to assist in the implementation of the Public Health Act 2010 and the Public Health Regulation 2012, both of which commenced on 1 September 2012
-
held forums at 11 localities across the state to brief Local Government environmental health officers on the regulatory changes, and their implementation and enforcement methodology. Specific case studies were developed through a steering committee for presentation and study at the forums. Local Government feedback was positive, providing advice for improvements.
Asbestos
In 2012 Health Protection NSW:
-
participated in the Heads of Asbestos Coordination Authority, a state-based interagency group that has been developing programs including a statewide plan for asbestos, a model asbestos policy for local councils, and a comprehensive public awareness campaign. Through this membership it also provides input into the newly formed Commonwealth Asbestos Safety and Eradication Agency.
Air quality
In 2012 Health Protection NSW:
-
supported two environmental studies in the Hunter Valley to help define the types of exposure of the community to particulate air pollution and determine the distribution and relative contribution of various sources to this pollution. This information will inform programs to reduce community exposure
-
supported the Chief Health Officer’s Air Pollution Expert Advisory Committee, which provides independent advice on the scientific basis for management of the health effects of air pollution.
Conclusion
Communicable diseases and the environment pose many potential threats to human health. These potential threats are dealt with through a combination of four goals:
-
preventing production of the threat (through, for example, immunisation, regulation of drinking water and working with planning agencies to ensure planning approvals address potential health threats)
-
early identification of the threat (through surveillance systems such as the disease and exposure notification, and arbovirus surveillance systems)
-
reducing the level of the threat (through strategies such as outbreak control, immunisation, and identification and treatment of the causes of diseases)
-
effective communication (with the community, with appropriate health professionals, with other government agencies such as the NSW Environment Protection Authority and NSW Department of Planning, and with other jurisdictions, to respond to threats and reduce exposures).
Effective health protection for the NSW population is dependent on our success in achieving these four goals. That success is dependent on the skills, experience and advocacy of health protection workers across the state in identifying, responding to and communicating health threats to the NSW population.
Increasing international travel also increases the risk of importing enteric diseases such as hepatitis A, typhoid and paratyphoid, and other vaccine-preventable diseases such as measles and diphtheria. This underlines the need to maintain high vaccination coverage rates for all NSW children, and for all people planning travel, to ensure they have received all their routine vaccines, as well as specific travel vaccines such as hepatitis A and typhoid for some destinations.
Steady migration to Australia of people from countries with a high burden of tuberculosis necessitates maintenance of specialised tuberculosis services accessible across NSW for early detection, expert treatment and screening activities.
Acknowledgments
Protecting the health of the community is a collaborative effort, involving Public Health Units, clinicians, laboratory scientists, affected communities, and other government and community-based organisations. We thank all those involved for the role they played in NSW in 2012.
References
[1] Year in review: health protection in NSW, 2011. N S W Public Health Bull 2012; 23 129–41.| 23043745PubMed |
[2] European Centre for Disease Prevention and Control. Sexually transmitted infections in Europe, 1990–2009. Stockholm: ECDC. Available at: http://ecdc.europa.eu/en/publications/Publications/110526_SUR_STI_in_Europe_1990-2009.pdf (Cited 30 October 2013).
[3] Van Beek J, Ambert-Balay K, Botteldoorn N, Eden JS, Fonager J, Hewitt J, et al. Indications for worldwide increased norovirus activity associated with emergence of a new variant of genotype II.4, late 2012. Euro Surveill 2013; 18 8–9.
| 1:STN:280:DC%2BC3szmtV2ntg%3D%3D&md5=f6db6b9e5ed61034ed543a710a4feafbCAS | 23305715PubMed |
[4] National Health and Medical Research Council and Natural Resource Management Ministerial Council. Australian drinking water guidelines Paper 6. National water quality management strategy. Canberra: NHMRC, NRMMC, Commonwealth of Australia; 2011.
[5] NSW Health, NSW Department of Primary Industries – Office of Water 2013. NSW Guidelines for Drinking Water Management Systems. Available at: http://www0.health.nsw.gov.au/resources/publichealth/environment/water/pdf/nsw_guidelines_for_dwms.pdf (Cited 11 September 2013).
[6] NSW Health, NSW Food Authority 2012. NSW Guidelines for Water Carters. Available at: http://www.health.nsw.gov.au/environment/Publications/nsw-guidelines-for-water-carters.pdf (Cited 11 September 2013).
[7] National Health and Medical Research Council. Australian Drinking Water Guidelines 2011. Available at: http://www.nhmrc.gov.au/guidelines/publications/eh52 (Cited 11 September 2013).
[8] NSW Department of Health. Housing for Health. Available at: http://www.health.nsw.gov.au/environment/aboriginal/Pages/housing-for-health.aspx (Cited 30 October 2013).
[9] NSW Department of Health. Closing the Gap: 10 Years of Housing for Health in NSW. An evaluation of a healthy housing intervention. Available at: http://www0.health.nsw.gov.au/pubs/2010/pdf/housing_health_010210.pdf (Cited 30 October 2013).
[10] NSW Aboriginal Land Council and NSW Government. Aboriginal water supply and sewerage program. Available at: http://www.alc.org.au/media/27358/Final_A3%20Folded_3mm%20Bleed.pdf (Cited 30 October 2013).