

4. Trends in NSW
NSW Public Health Bulletin 21(1) 16-25 https://doi.org/10.1071/NB10S04
Published: 24 June 2010
Confinements and births by plurality
There were 96 030 births to 94 602 women reported in 2007 (Table 1). In 2003 and 2004, the numbers of births in NSW remained stable at about 86 000 per annum. In 2005, the number of births increased to 90 610, a rise of 5.8% compared with 2004; in 2006, the number of births increased to 92 781, a rise of 7.9% compared with 2004; and in 2007, and the number of births increased to 96 030, a rise of 12.2% compared with 2004. The proportion of pregnancies that are multiple (twin and triplet) has remained stable at about 1.6% since 2003.

|
Health area of residence
In 2007, the largest number of births occurred in the Sydney South West Area, followed by Sydney West and South Eastern Sydney and Illawarra Areas (Table 2). Compared with 2004, there were increases in the numbers of births in all health areas. The increase occurred mainly in the metropolitan areas, with the Sydney South West and Sydney West Areas reporting over 2000 more births in 2007 than in 2004; and Northern Sydney and Central Coast, and South Eastern Sydney and Illawarra Areas reporting over 1000 more births in 2007 than in 2004.

|
Maternal age
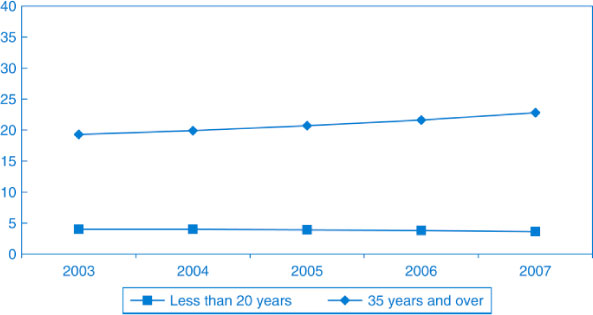
The number of mothers giving birth was stable for teenage mothers and increased across all other age groups in 2007 compared with previous years, with the largest increase among mothers aged 35–39 years. The percentage of mothers who were teenagers fell from 4.0% in 2003 to 3.6% in 2007. The percentage of mothers aged 35 years and over increased from 19.3 to 22.8% of all mothers giving birth (Figure 1, Table 3).
|

|
The mean maternal age rose from 30.2 to 30.6 years over the 5 years from 2003 to 2007. The trend towards later childbirth is evident among both primiparous and multiparous mothers; the mean maternal age rose from 28.5 to 29.0 years for primiparous mothers and from 31.4 to 31.8 years for multiparous mothers. The proportion of mothers giving birth for the first time who were aged 35 years or more increased from 12.3 to 15.1% over the 5-year period, and the proportion of multiparous mothers who were aged 35 years or more increased from 24.5 to 28.4%.
Maternal country of birth
In the period 2003–2007, about 70% of mothers were born in Australia. In 2007, mothers born in the United Kingdom, New Zealand, China, Vietnam and India together accounted for 11.2% of all mothers (Table 4). Further information on maternal country of birth is shown in Chapter 8.

|
Maternal Aboriginality
The reported number of Aboriginal or Torres Strait Islander mothers giving birth increased from 2161 in 2003 to 2888 in 2007, an increase from 2.5 to 3.1% of all mothers (Table 5). Further information on maternal Aboriginality and reporting of Aboriginality is shown in Chapter 7.

|
Previous pregnancies
In recent years there were no substantial changes in the reported number of previous pregnancies greater than 20 weeks gestation (Table 6). The proportion of mothers giving birth for the first time has been stable at 41–42%, while the proportion of mothers giving birth to a second to fifth baby has been stable at about 56%. The number of women giving birth for the sixth or subsequent time rose by 17.9% from 1258 in 2003 to 1483 in 2007 – however, these mothers comprised only 1.6% of all mothers in 2007.

|
Duration of pregnancy at first antenatal visit
Between 2003 and 2007, the proportion of mothers commencing antenatal care before 20 weeks gestation rose from 86.6 to 90.7%, while the proportion of mothers starting antenatal care at 20+ weeks gestation declined from 12.9 to 7.2% between 2003 and 2007 (Table 7).

|
Smoking in pregnancy
The proportion of mothers reporting any smoking during pregnancy declined between 2003 and 2007: in 2003, 12 875 (15.1%) mothers reported smoking in pregnancy, 12 472 (14.8%) in 2004, 12 738 (14.3%) in 2005, 12 307 (13.5%) in 2006 and 12 068 (12.8%) in 2007.
Of mothers who smoked during pregnancy in 2007, 5.6% stopped smoking before the second half of pregnancy. Over the 5-year period, among those who smoked in the second half of pregnancy there was a trend towards smoking fewer cigarettes per day (Table 8).

|
Place of birth
In 2007, the majority of mothers planned to give birth in a hospital labour ward, and 4.1% of mothers planned to give birth in a birth centre (Table 9). Sixty-nine percent of mothers who planned to give birth in a birth centre actually did so. The total number of reported planned homebirths rose slightly from 132 in 2003 to 175 in 2007, while the reported number of planned homebirths that occurred at home rose from 109 in 2003 to 144 in 2007.

|
Hypertension and diabetes
Reporting of gestational diabetes was stable at 4–5% of mothers between 2003 and 2007, whereas rates of diabetes mellitus have remained stable at about 0.6% over the 5-year period (Table 10). During 2006, there was a change in the format for reporting hypertension in pregnancy where reporting of pre-eclampsia was replaced with reporting of proteinuric and non-proteinuric pregnancy-induced hypertension. Overall, hypertension in pregnancy was reported among 6.6% of mothers in 2007, compared with 6.5% in 2003.

|
Labour
The rate of spontaneous onset of labour fell from 60.4% in 2003 to 57.3% in 2007 (Table 11). The rate of induction of labour was 25.9% in 2007, similar to previous years. The most common reported reason for induction of labour in 2007 was prolonged pregnancy (41 or more weeks) (28.2%), followed by prelabour rupture of membranes (11.5%), hypertensive disease (7.9%), diabetes (5.8%), suspected intrauterine growth retardation (3.9%), fetal distress (1.7%) and fetal death (1.2%).

|
Birth
Among NSW mothers, the rate of normal vaginal birth decreased from 62.8% in 2003 to 59.9% in 2007 (Table 12). The caesarean section rate increased from 26.5 to 29.0%. The rate of instrumental birth remained steady at 10 to 11%.

|
Operative and instrumental births are more common among privately than publicly-insured mothers (Table 13). Among privately insured mothers, the rate of normal vaginal birth fell from 52.1% in 2003 to 47.7% in 2007 and the caesarean section rate increased from 32.4 to 37.9%. Among publicly insured mothers, the rate of normal vaginal birth fell from 69.5 to 66.5% and the caesarean section rate rose from 21.5 to 24.6%.

|
Baby sex
There was no significant change in the pattern of baby sex since 2003, with slightly more male babies born than females in each year. In 2007, 49 313 (51.4%) of babies were male, 46 656 (48.6%) were female, 10 were of indeterminate sex, and sex was not reported for 51 babies. This compares with babies born in 2003, when 44 623 (51.6%) of 86 414 babies were male, 41 722 (48.3%) were female, 19 were of indeterminate sex, and sex was not reported for 50 babies.
Gestational age
In 2007, 7.4% of babies were born prematurely (less than 37 weeks gestation), compared with 7.0% in 2003 (Table 14). Over the 5-year period, about 93% of babies were born at term (37–41 weeks gestation). Over the last 5 years, the percentage of postmature (42+ weeks gestation) has been declining, down from 2.5% in 2003 to 0.9% in 2007.

|
Birth weight
Since 2003, the rate of low birth weight (less than 2500 g) has been just over 6% (Table 15). The rate was 6.1% in 2007.

|
Apgar score
In 2007, 2.1% of babies were born with an Apgar score of less than 7 at 5 minutes and 1.1% were born with a score less than 4 (Table 16). These rates are similar to those of previous years.

|
Perinatal outcome
In the period 2003–2007, the perinatal mortality rate varied from 8.6 to 9.0 per 1000 (Table 17). In 2007, 72.5% of all reported perinatal deaths were stillbirths and 27.5% were neonatal deaths.

|
In 2007, of the 868 perinatal deaths in NSW, 821 (94.6%) were reported among planned hospital births, 24 (2.8%) among planned birth-centre births, two occurred in a planned home birth, and 20 were among babies born before arrival at hospital.
Maternal deaths
In the period 1990–2006, 177 deaths were reported among pregnant women or women who gave birth less than 6 weeks previously. Of these, 55 (31.1%) died of incidental causes not related to the pregnancy or its management, 76 (42.9%) deaths were found to be directly due to pregnancy or its management, and 43 (24.3%) deaths were found to result from pre-existing disease or disease which developed during pregnancy (not due to direct obstetric causes), but which may have been aggravated by the physiologic effects of pregnancy (Table 18). Table 19 shows maternal deaths by cause in NSW for 2005 and 2006.

|

|