6. NSW hospitals
NSW Public Health Bulletin 21(1) 35-70 https://doi.org/10.1071/NB10S06
Published: 24 June 2010
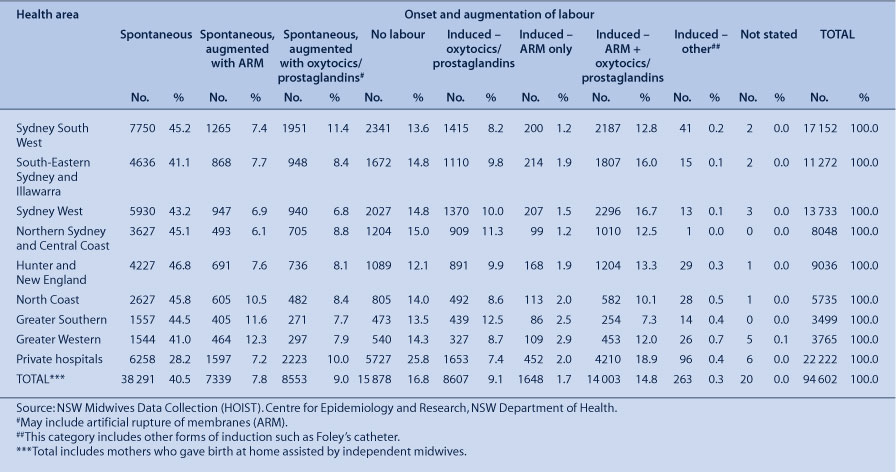
Onset and augmentation of labour
Table 33 shows onset or augmentation of labour for area health services, and Table 34 for individual hospitals by maternity service level where at least 200 mothers gave birth in 2007.
|

|
Type of birth
Table 35 shows type of birth for area health services, and Table 36 for individual hospitals by maternity service level where at least 200 mothers gave birth in 2007.

|

|
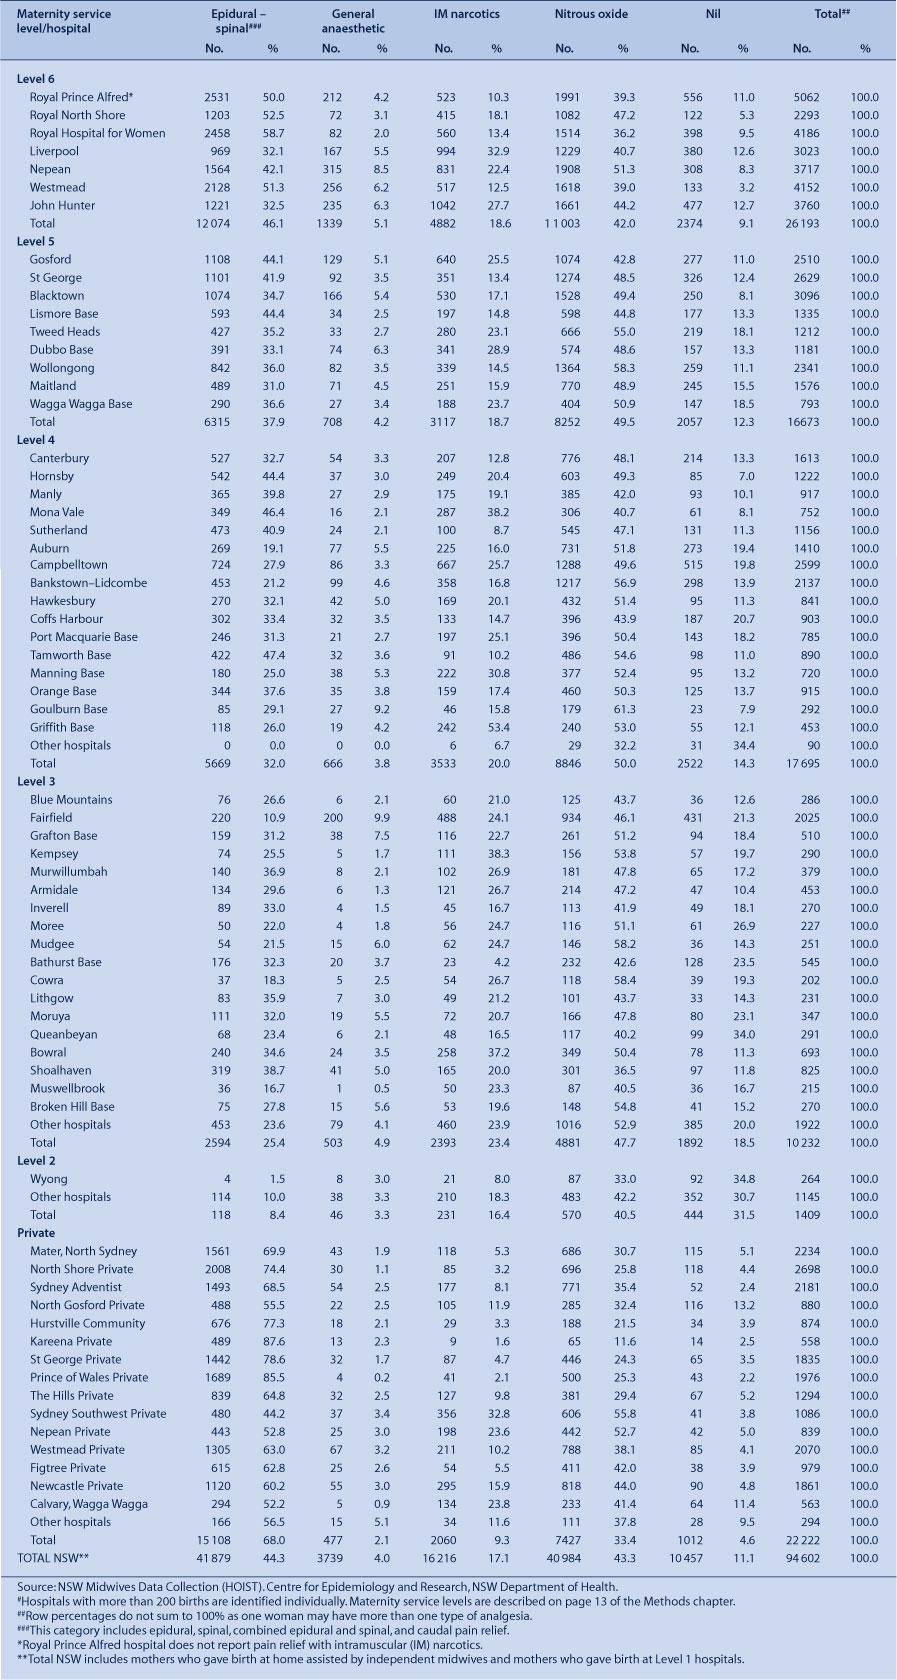
Pain relief
Table 37 shows type of pain relief provided to women during labour or delivery for area health services, and Table 38 for individual hospitals by maternity service level where at least 200 mothers gave birth in 2007.

|
|
In addition to the types of pain relief shown in the tables, a further 23 655 (25%) women were reported to have received local anaesthetic to the perineum, and 765 (0.8%) received a pudendal block.
Perineal status
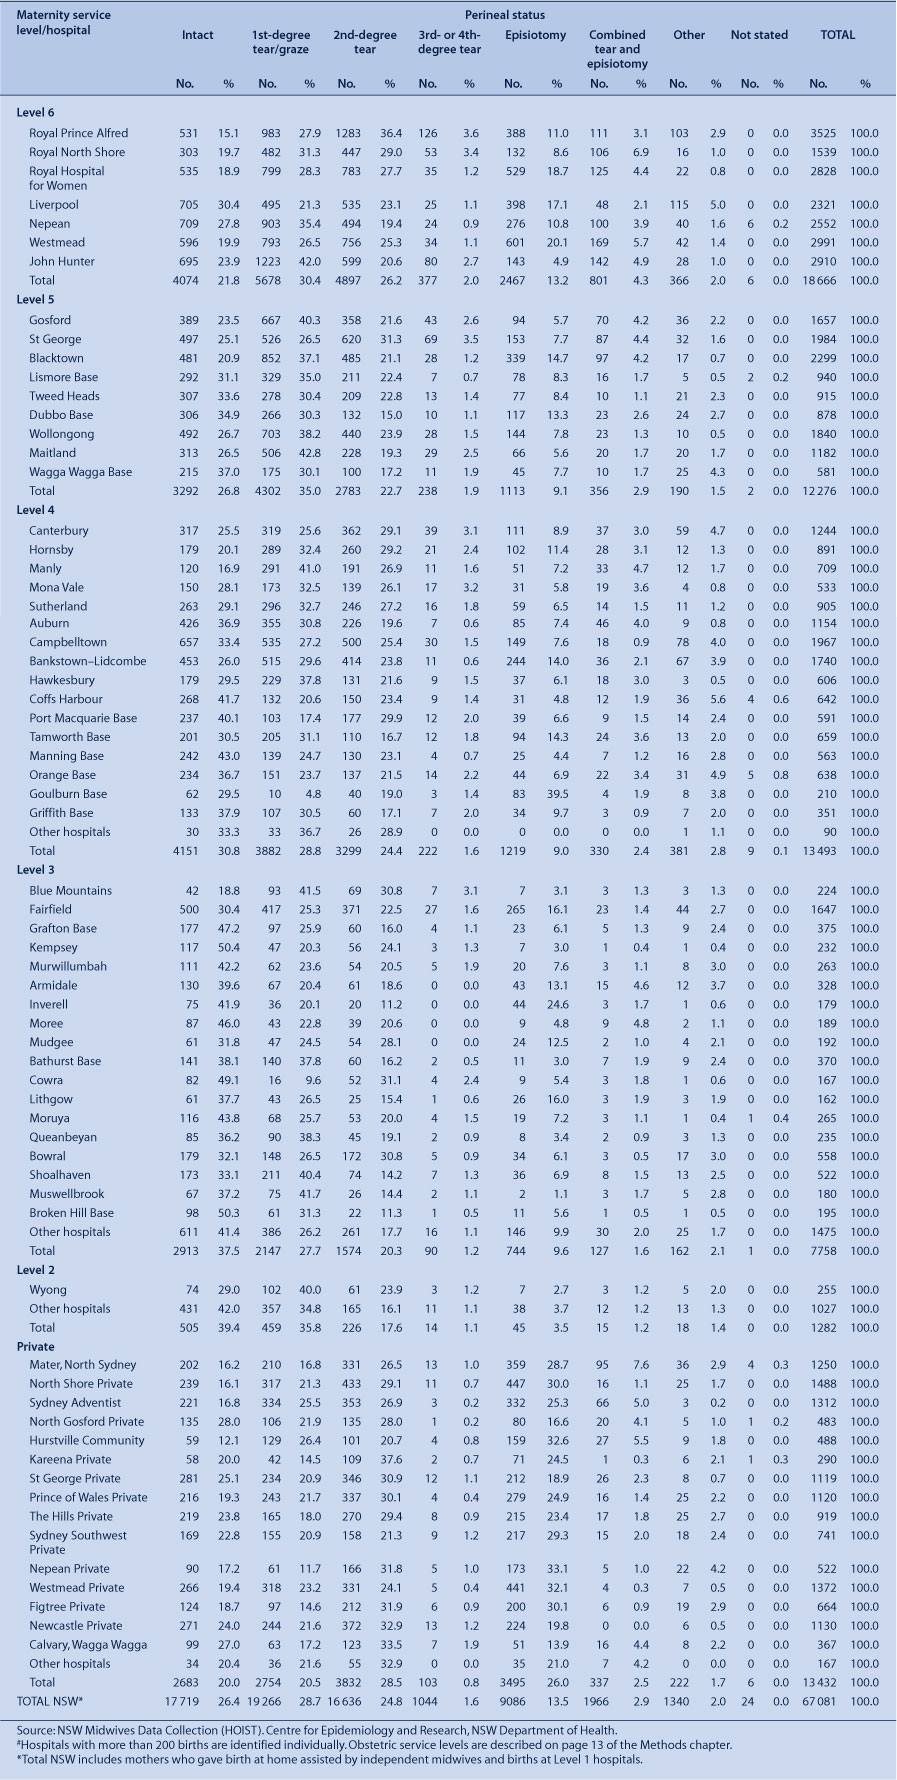
Table 39 shows the perineal status in vaginal births for area health services, and Table 40 for individual hospitals by maternity service level where at least 200 mothers gave birth in 2007.

|
|
There were 1477 cases of third-degree tear and 144 cases of fourth-degree tear reported among women who gave birth vaginally in 2007, including tears associated with an episiotomy.
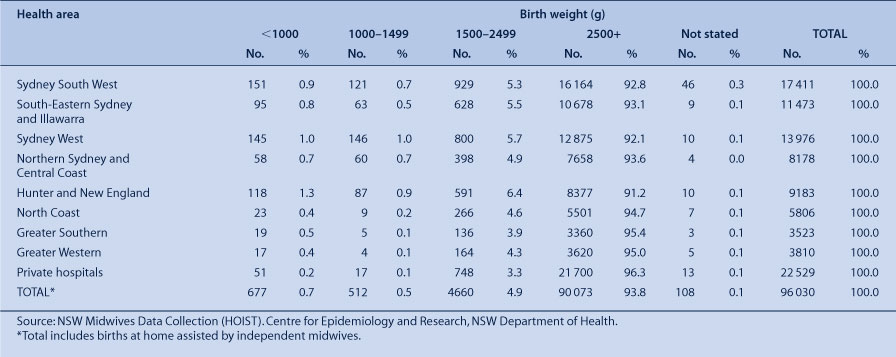
Birth weight
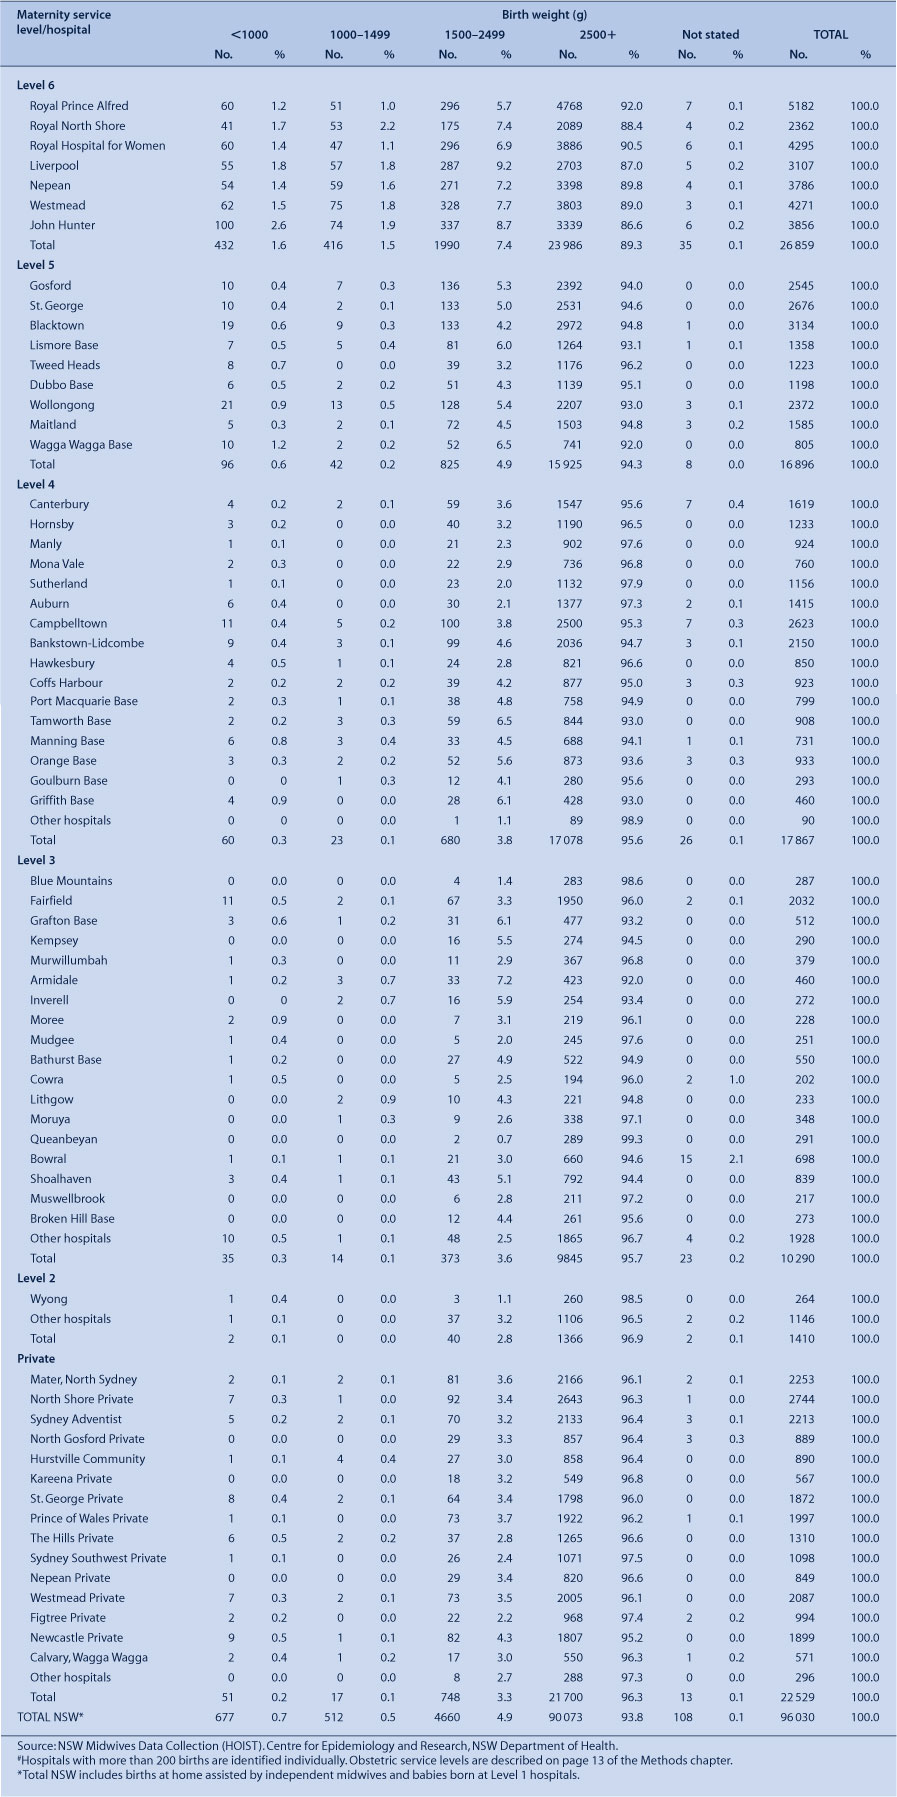
Table 41 shows the birth weight of babies for area health services, and Table 42 for individual hospitals by maternity service level where at least 200 mothers gave birth in 2007.
|
|
Gestational age
Table 43 shows the gestational age of babies for area health services, and Table 44 for individual hospitals by maternity service level where at least 200 mothers gave birth in 2007.

|

|
Neonatal resuscitation
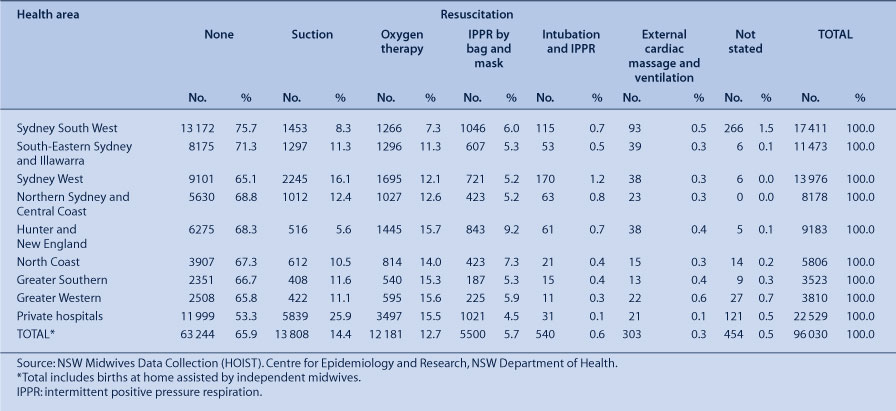
Table 45 shows the type of neonatal resuscitation for area health services, and Table 46 for individual hospitals by maternity service level where at least 200 mothers gave birth in 2007.
|

|
Admission to special care or neonatal intensive care
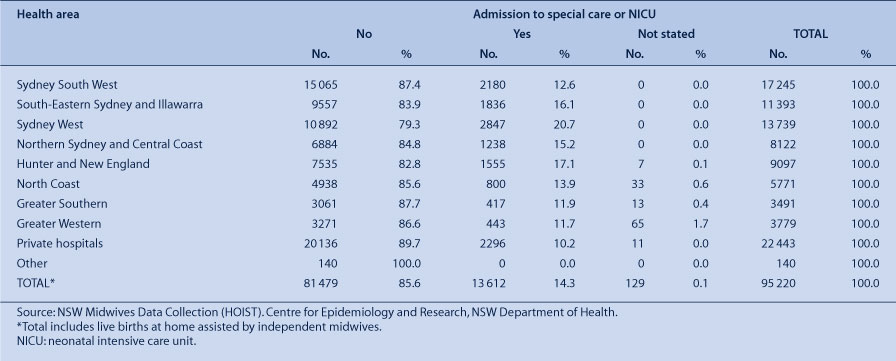
Tables 47 shows admissions of liveborn babies to special care or neonatal intensive care for area health services, and Table 48 for individual hospitals by maternity service level where at least 200 mothers gave birth in 2007.
|

|
Infant feeding
Table 49 shows infant feeding at discharge from the hospital of birth for area health services, and Table 50 for individual hospitals by maternity service level where at least 200 mothers gave birth in 2007.

|

|
Baby discharge status
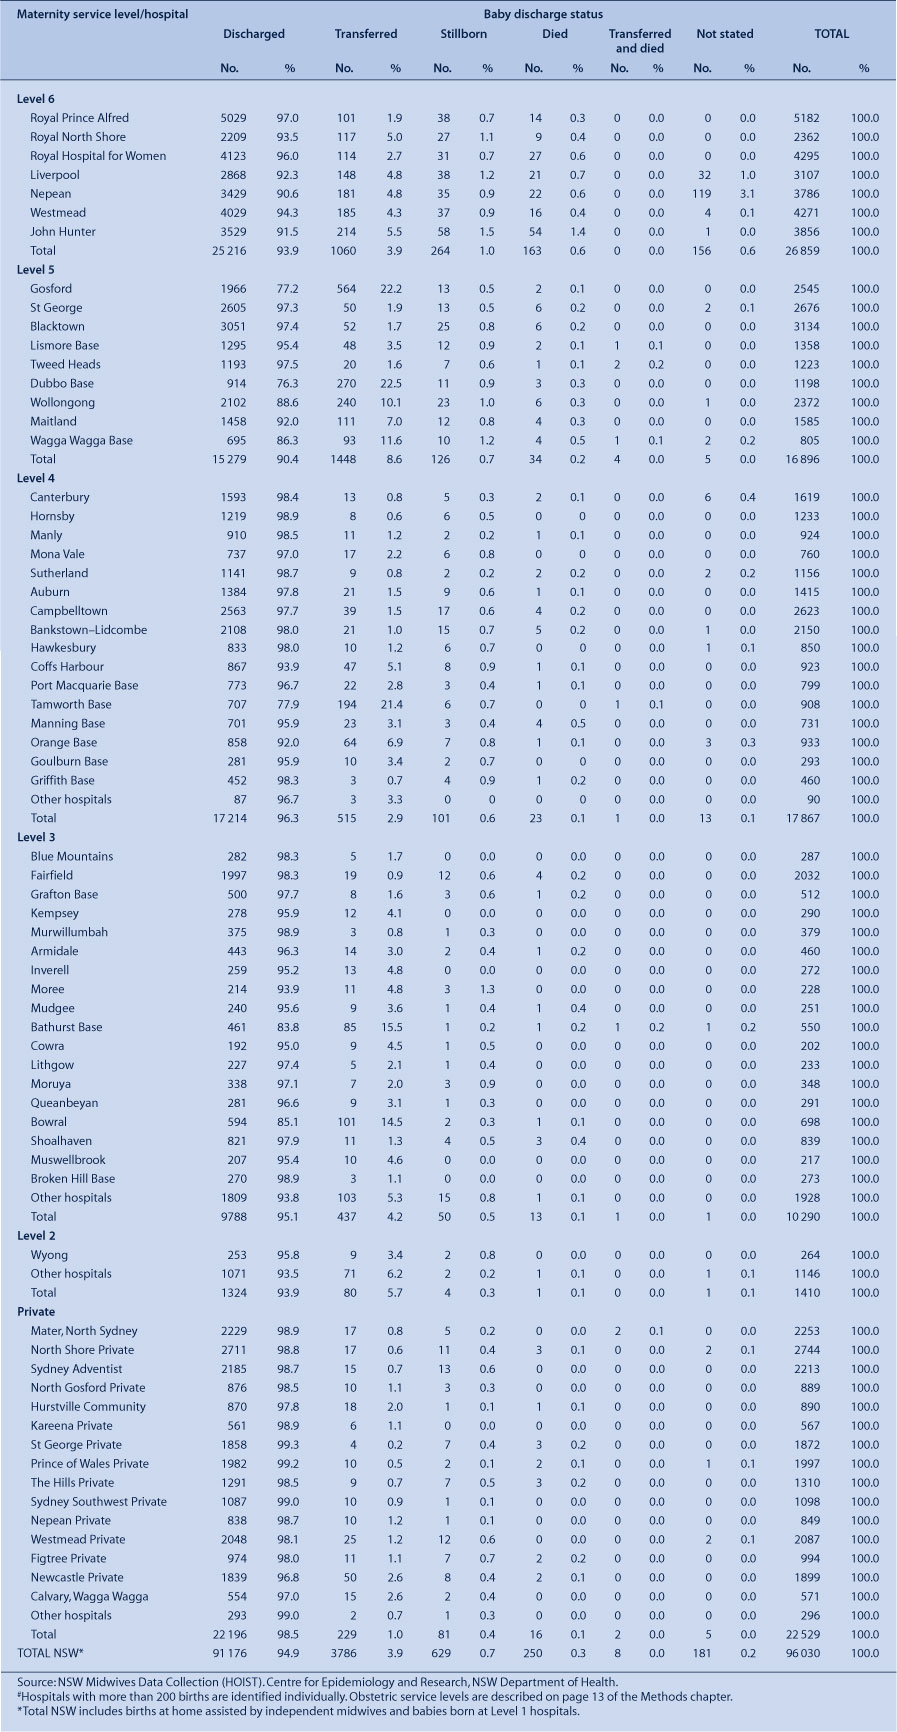
Table 51 shows the discharge status of babies for area health services, and Table 52 for individual hospitals by maternity service level where at least 200 mothers gave birth in 2007.

|
|
Postnatal length of stay
Table 53 shows the mother’s postnatal length of stay in the hospital of birth for hospitals where at least 200 mothers gave birth in 2007.

|
Clinical indicators
Selected clinical indicators for obstetrics are reported in this section. The definitions of the clinical indicators follow those described in Version 6 of the Australian Council on Healthcare Standards Clinical Indicator User’s Manual.1
Outcome of selected primipara, Indicator 1.1
Definition: the number of selected primipara who have a spontaneous vaginal birth as a percentage of the total number of selected primipara who give birth.
A selected primipara is defined as a woman who is 20–34 years of age at the time of giving birth; giving birth for the first time at greater than 20 weeks gestation; singleton pregnancy; cephalic presentation; and at 370 to 410 weeks gestation.
Table 54 shows aggregate information for hospitals where at least 200 mothers gave birth in 2007, totals for hospitals within each health area, and the NSW total.

|
Outcome of selected primipara, Indicator 1.2
Definition: the number of selected primipara who undergo induction of labour as a percentage of the total number of selected primipara who give birth.
A selected primipara is defined as a woman who is 20–34 years of age at the time of giving birth; giving birth for the first time at greater than 20 weeks gestation; singleton pregnancy; cephalic presentation; and at 370 to 410 weeks gestation.
Table 55 shows aggregate information for hospitals where at least 200 mothers gave birth in 2007, totals for hospitals within each health area, and the NSW total.

|
Outcome of selected primipara, Indicator 1.3
Definition: the number of selected primipara who undergo an instrumental vaginal birth as a percentage of the total number of selected primipara who give birth.
A selected primipara is defined as a woman who is 20–34 years of age at the time of giving birth; giving birth for the first time at greater than 20 weeks gestation; singleton pregnancy; cephalic presentation; and at 370 to 410 weeks gestation.
Table 56 shows aggregate information for hospitals where at least 200 mothers gave birth in 2007, totals for hospitals within each health area, and the NSW total.

|
Outcome of selected primipara, Indicator 1.4
Definition: the number of selected primipara undergoing caesarean section birth as a percentage of the total number of selected primipara who give birth.
A selected primipara is defined as a woman who is 20–34 years of age at the time of giving birth; giving birth for the first time at greater than 20 weeks gestation; singleton pregnancy; cephalic presentation; and at 370 to 410 weeks gestation.
Table 57 shows aggregate information for hospitals where at least 200 mothers gave birth in 2007, totals for hospitals within each health area, and the NSW total.

|
Vaginal birth following caesarean section, Indicator 2.1
Definition: total number of women delivering vaginally following a previous primary caesarean section as a percentage of the total number of women delivering who have had a previous primary caesarean section and no intervening pregnancies greater than 20 weeks gestation.
Table 58 shows aggregate information for hospitals where at least 200 mothers gave birth in 2007, totals for hospitals within each health area, and the NSW total.

|
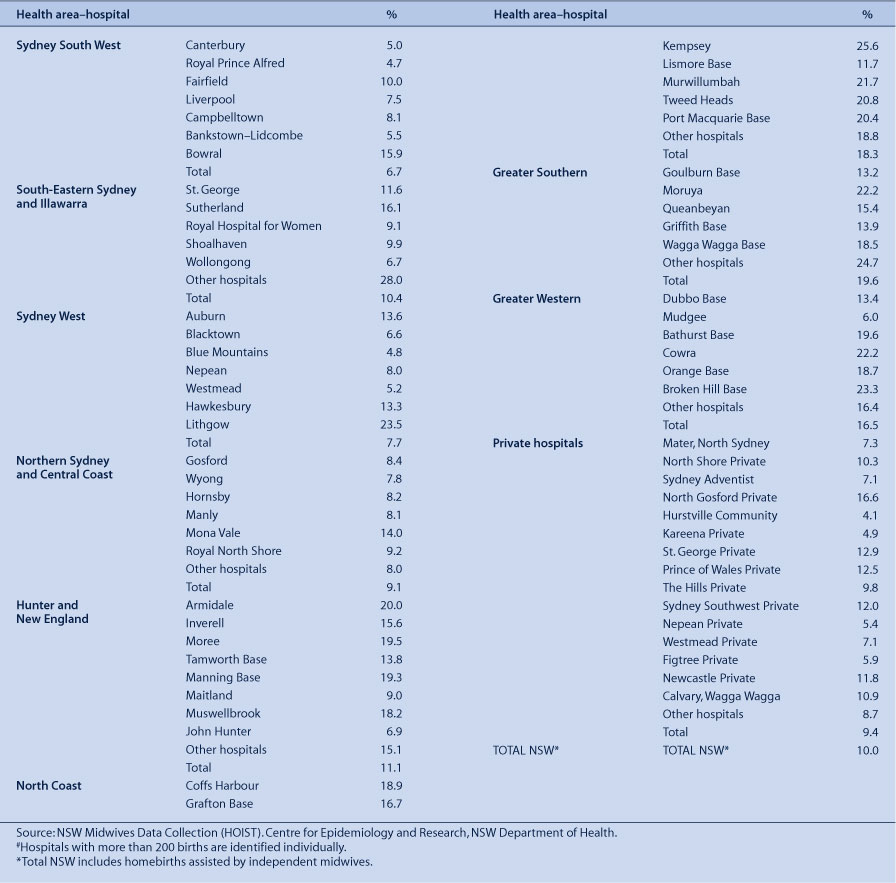
Major perineal tears and surgical repair of the perineum, Indicator 3.1
Definition: total number of selected primipara with an intact perineum as a percentage of the total number of selected primipara delivering vaginally.
A selected primipara is defined as a woman who is 20–34 years of age at the time of giving birth; giving birth for the first time at greater than 20 weeks gestation; singleton pregnancy; cephalic presentation; and at 370 to 410 weeks gestation.
Table 59 shows aggregate information for hospitals where at least 200 mothers gave birth in 2007, totals for hospitals within each health area, and the NSW total.
|
Major perineal tears and surgical repair of the perineum, Indicator 3.2
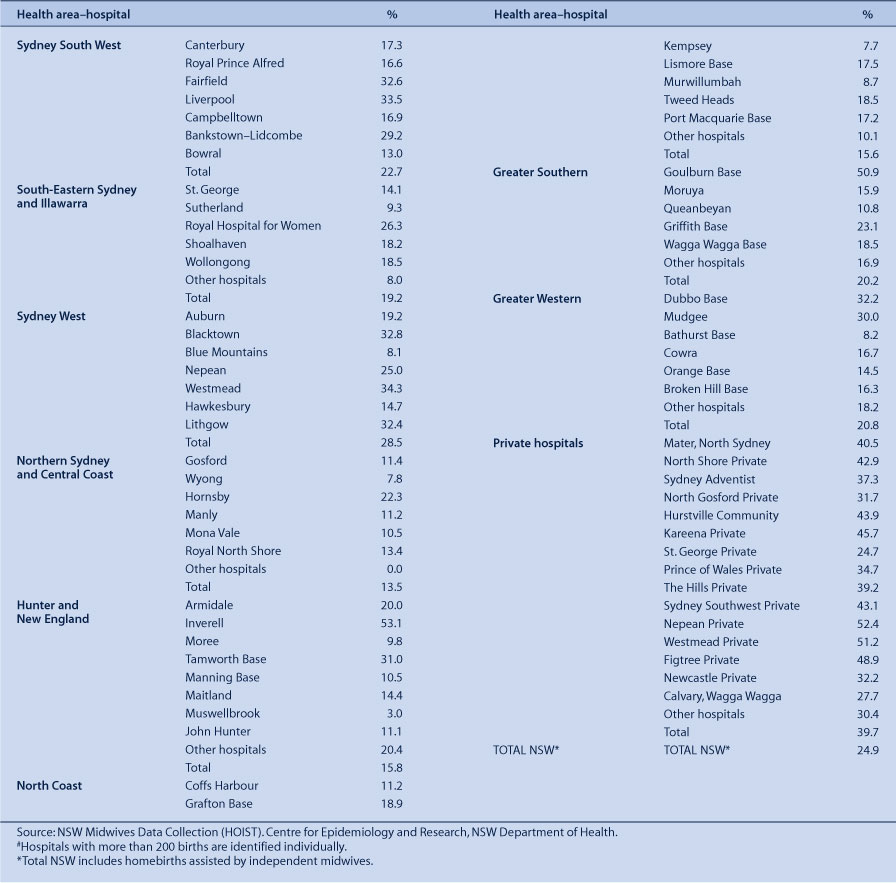
Definition: total number of selected primipara undergoing episiotomy and no perineal tear while giving birth vaginally as a percentage of the total number of selected primipara delivering vaginally.
A selected primipara is defined as a woman who is 20–34 years of age at the time of giving birth; giving birth for the first time at greater than 20 weeks gestation; singleton pregnancy; cephalic presentation; and at 370 to 410 weeks gestation.
Table 60 shows aggregate information for hospitals where at least 200 mothers gave birth in 2007, totals for hospitals within each health area, and the NSW total.
|
Major perineal tears and surgical repair of the perineum, Indicator 3.3
Definition: total number of selected primipara sustaining a perineal tear and no episiotomy as a percentage of the total number of selected primipara delivering vaginally.
A selected primipara is defined as a woman who is 20–34 years of age at the time of giving birth; giving birth for the first time at greater than 20 weeks gestation; singleton pregnancy; cephalic presentation; and at 370 to 410 weeks gestation.
Table 61 shows aggregate information for hospitals where at least 200 mothers gave birth in 2007, totals for hospitals within each health area, and the NSW total.

|
Major perineal tears and surgical repair of the perineum, Indicator 3.4
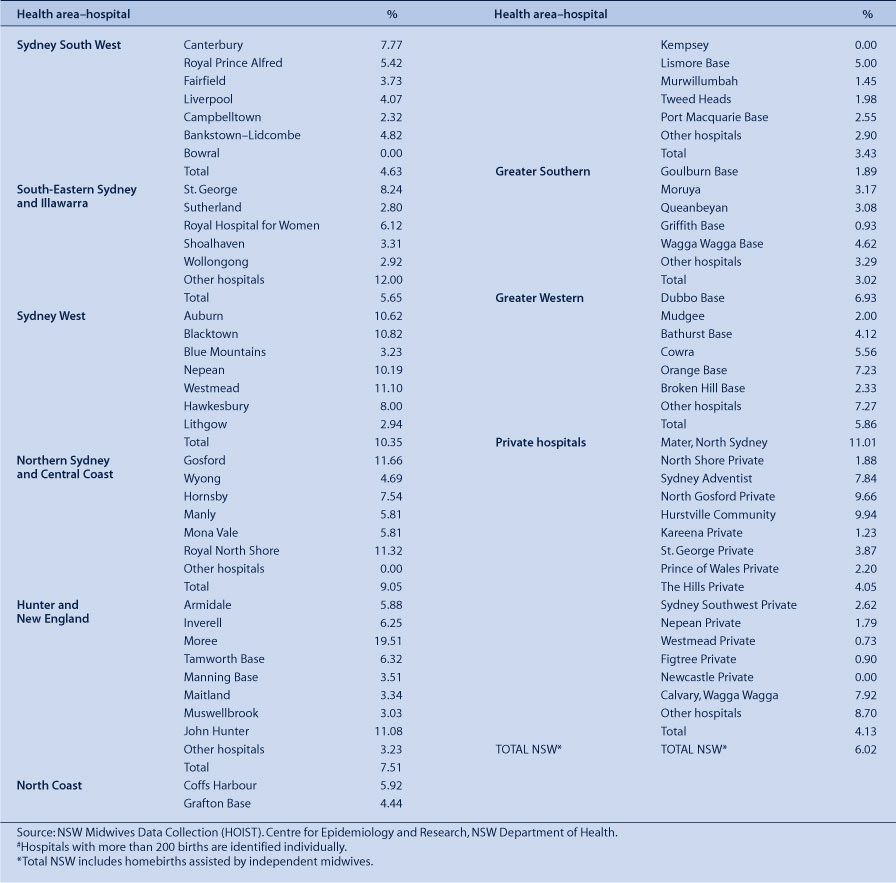
Definition: total number of selected primipara undergoing episiotomy and sustaining a perineal tear while giving birth vaginally as a percentage of the total number of selected primipara delivering vaginally.
A selected primipara is defined as a woman who is 20–34 years of age at the time of giving birth; giving birth for the first time at greater than 20 weeks gestation; singleton pregnancy; cephalic presentation; and at 370 to 410 weeks gestation.
Table 62 shows aggregate information for hospitals where at least 200 mothers gave birth in 2007, totals for hospitals within each health area, and the NSW total.
|
Major perineal tears and surgical repair of the perineum, Indicator 3.5
Definition: total number of selected primipara undergoing surgical repair of the perineum for third-degree tear as a percentage of the total number of selected primipara delivering vaginally.
A selected primipara is defined as a woman who is 20–34 years of age at the time of giving birth; giving birth for the first time at greater than 20 weeks gestation; singleton pregnancy; cephalic presentation; and at 370 to 410 weeks gestation.
Table 63 shows aggregate information for hospitals where at least 200 mothers gave birth in 2007, totals for hospitals within each health area, and the NSW total.

|
Major perineal tears and surgical repair of the perineum, Indicator 3.6
Definition: total number of selected primipara undergoing surgical repair of the perineum for fourth-degree tear as a percentage of the total number of selected primipara delivering vaginally.
A selected primipara is defined as a woman who is 20–34 years of age at the time of giving birth; giving birth for the first time at greater than 20 weeks gestation; singleton pregnancy; cephalic presentation; and at 370 to 410 weeks gestation.
Table 64 shows aggregate information for hospitals where at least 200 mothers gave birth in 2007, totals for hospitals within each health area, and the NSW total.

|
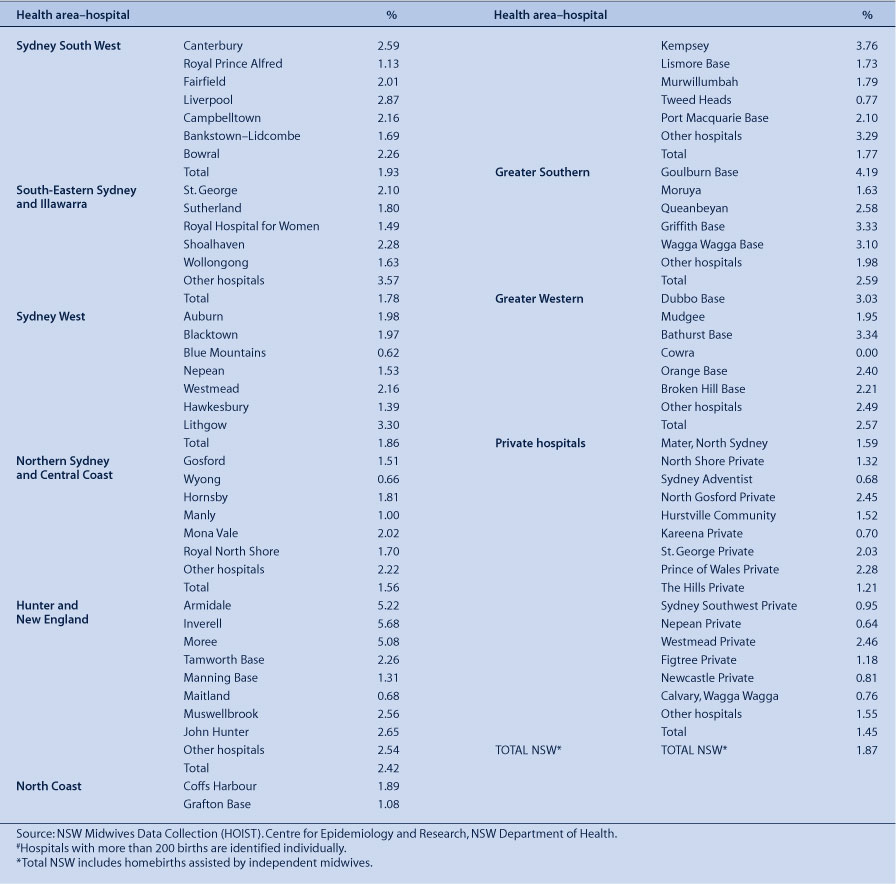
Intrauterine growth restriction, Indicator 8.1
Definition: total number of deliveries with birth weight less than 2750 g at 400 weeks gestation or beyond as a percentage of the total number of deliveries at 400 weeks gestation or beyond.
Table 65 shows aggregate information for hospitals where at least 200 babies were born in 2007, totals for hospitals within each health area, and the NSW total.
|
Apgar score, Indicator 9.1
Definition: total number of term babies born with an Apgar score of less than 7 at 5 min post delivery as a percentage of the total number of term babies born.
Table 66 shows aggregate information for hospitals where at least 200 babies were born in 2007, totals for hospitals within each health area, and the NSW total.

|


