

Radio Detection of Colliding Wind Binaries
Paula Benaglia A B E , Bärbel Koribalski C and Juan F. Albacete Colombo B DA Instituto Argentino de Radioastronomía, C.C. 5, Villa Elisa (1894), Argentina
B Facultad de Ciencias Astronómicas y Geofísicas, UNLP, 1900 La Plata, Argentina
C Australia Telescope National Facility, CSIRO, Epping NSW 1710, Australia
D Osservatorio Astronomico di Palermo, 90134 Palermo, Italy
E Corresponding author. Email: pbenaglia@fcaglp.unlp.edu.ar
Publications of the Astronomical Society of Australia 23(1) 50-63 https://doi.org/10.1071/AS05039
Submitted: 16 November 2005 Accepted: 30 January 2006 Published: 29 March 2006
Abstract
Four massive, early-type stars, three of which are confirmed binaries, have been observed with the Australia Telescope Compact Array at 1.4, 2.4, 4.8, and 8.6 GHz. The earliest star cataloged so far, HD 93129A, was also observed at 17.8 and 24.5 GHz. Here we present an analysis of the spectra as well as the structure of the stellar systems. All four spectra show clear evidence of non-thermal emission, indicative of a binary system with a colliding wind region. We discuss the magnetic field of the emitting region of HD 93129A and make predictions on the radiation at high energies. Archive X-ray observations towards the target sources are also investigated and interpreted in the light of the non-thermal emission detected.
Keywords: stars: early-type
Introduction
Through supersonic winds massive, early-type stars (OB to Wolf-Rayet) emit particles as well radiation into the circumstellar medium. Spectroscopic measurements show that stellar wind velocities reach thousands of kilometres per second. The fact that these velocities are larger than the stellar escape velocity proves that important stellar mass loss takes place, especially during and after the end of the main sequence life phase. Mass loss affects the evolution of the star.
The plasma forming the wind produces a thermal excess in flux density from the infrared to the radio range, detectable — and detected — by telescopes with high sensitivity and angular resolution (see the comprehensive observational work by Bieging, Abbott, & Churchwell 1989, for example). However, there are numerous stars that show evidence for non-thermal (NT) emission, revealing the presence of relativistic electrons tangled in the stellar magnetic fields. Local instabilities (e.g., Lucy & White 1980) or magnetic confinement (Jardine et al. 2001) can give rise to particle acceleration in single winds. In a stellar system composed of two stars with interacting winds, relativistic particles are expected to be produced in the region where both winds interact (Eichler & Usov 1993).
In general, early-type stars are X-ray emitters, with a characteristic thermal spectrum, X-ray temperatures of ≥1 keV, and X-ray luminosities of about 10–7 L bol (Berghöfer et al. 1997). In colliding wind binaries, the shock-heated gas at the colliding wind region (CWR) will bring about an enhancement of X-ray emission, which can be considered as a signature of the existence of winds interacting. However, the thermal and/or non-thermal origin of the X-ray radiation strictly depends on the physical parameters and configuration of the stellar system. In close binary systems, the CWR is embedded in the wind acceleration zone: The shocks are less energetic — compared to those in wide systems — and there is thermal radiation mostly at soft X-rays. On the contrary, wide binaries can have strongly colliding winds that produce thermal emission above 3 keV and are capable of forming the FeKα 6.7 keV emission line, as well as non-thermal emission from the inverse Compton (IC) scattering.
From an observational point of view, the existence of non-thermal X-ray emission does not imply the existence of non-thermal radio emission, because the radio emission forms deep inside the wind where it would be strongly absorbed. However, the inverse situation would be interesting to discuss.
As searches for early-type companions to early-type stars advance, there is diminishing evidence for single stars with non-thermal radio emission. An example is 9 Sgr, an O4 V((f+)) star, often used to test radio emission models of NT emission from single stars, and very recently re-discovered as a binary with an early-type companion (Rauw et al. 2005). Another rare object is HD 168112, for which radio and X-ray observations show strong evidence of a binary system whereas optical observations have been unable to discover a companion (Blomme et al. 2005; De Becker et al. 2004; Rauw et al. 2005).
In a few cases, the CWR has been identified through radio interferometric observations (e.g. WR 146, Dougherty et al. 1996; WR 147, Moran et al. 1989; Cyg OB2 no. 5, Contreras et al. 1997; WR 140, Dougherty et al. 2005). For WR 146 and WR 147, theoretical calculations of the spatial and spectral distribution of the radio emission were tested against radio data (Dougherty et al. 2003; O’Connor et al. 2005), yielding a good agreement.
For single early-type stars, theoreticians find some diffculties in reproducing the slow decrease in emissivity inside the wind, with the distance to the star, although the latest models involve layered synchrotron-emitting regions and the relevant cooling mechanisms (van Loo 2005).
As part of a survey of radio emission from massive, early-type stars, we have performed continuum observations of the brightest, nearest, and earliest undetected southern OB stars at 8.6 and 4.8 GHz (Benaglia et al. 2001; Benaglia & Koribalski 2004). Four of the observed stars displayed negative spectral indices (α < 0), suggesting a significant non-thermal contribution to their radio emission. We use S ν ∝ ν α , where S ν is the flux density at frequency v and α is the spectral index. To further study the radio emission from these stars we also observed them at lower frequencies. Here we present 2.4 and 1.4 GHz observations obtained with the Australia Telescope Compact Array (ATCA 1 ) for the stars CD-47° 4551, HD 93129A, HD 124314, and HD 150136. Preliminary results have been presented in Benaglia & Koribalski (2006). Based on the presence of non-thermal radio emission, presumably coming from the CWR of a binary star, we looked for other indicators of binarity. We complemented our analysis of the radio results with a study of all archive X-ray observations towards the stars.
Selected Stars
The stars were selected from the targets already observed at 3 and 6 cm (8.64 and 4.8 GHz, Benaglia et al. 2001; Benaglia & Koribalski 2004) that showed a non-thermal contribution to the emission. In order to investigate where the radio emission is coming from, it is fundamental to know the binary status of the stars, and the structure of the systems.
The parameters adopted for the present target stars are listed in Tables 1 and 2. The equatorial coordinates were taken as quoted in the GOS Catalogue (Maíz-Apellániz et al. 2004). The references for the spectral types and wind terminal velocities are given in Table 1. The distances to CD-47° 4551 and HD 124314 are spectro-photometric ones, derived from the apparent magnitude and (B – V) colour index quoted as in Benaglia et al. (2001), intrinsic colour indices from Wegner (1994), and absolute magnitudes from Martins, Schaerer, & Hillier (2005). The mean molecular weight of the ions (μ) was assumed 1.5 for the earliest types, and 1.3 for the later ones. For the HD 93129A system, the mass loss rate ( ) was taken from Repolust, Puls, & Herrero (2004). The
values for the rest of the stars were computed by means of the mass-loss rate recipe given by Vink, de Koter, & Lamers (2000)
2
. The effective temperatures (T
eff), stellar masses (M
*), and stellar luminosities (L
*) are from the calibration tables of Martins, Schaerer, & Hillier (2005), obtained with observational T
eff scales.
) was taken from Repolust, Puls, & Herrero (2004). The
values for the rest of the stars were computed by means of the mass-loss rate recipe given by Vink, de Koter, & Lamers (2000)
2
. The effective temperatures (T
eff), stellar masses (M
*), and stellar luminosities (L
*) are from the calibration tables of Martins, Schaerer, & Hillier (2005), obtained with observational T
eff scales.

|

|
ATCA Observations and Data Reduction
Radio continuum observations of the four stars listed in Table 1 were obtained with the Australia Telescope Compact Array at 1.4 and 2.4 GHz. The star HD 93129A was also observed at 17.8 and 24.5 GHz.
Observations at 1.4 and 2.4 GHz
The observations towards the stars CD-47° 4551, HD 93129A, HD 124314, and HD 150136 were carried out in 2003 December, in the 6A configuration, simultaneously at 1.384 GHz (20 cm), and 2.368 GHz (13 cm). The total bandwidth used at each frequency was 128 MHz. The average time on source was approximately 1 h, except for HD 93129A, which was observed for 6 h. The stars were observed during intervals of 10 to 15 min, interleaved with short observations of closeby phase calibrators. The LST ranges spanned were 11 h for HD 93129A, 8 h for CD-47° 4551 and HD 124314, and 6 h for HD 150136. The calibrator source PKS 1934-638 was used to set the flux density scale, with flux densities of 14.94 Jy at 1.384 GHz and 11.59 Jy at 2.368 GHz.
The data were reduced and analyzed with the miriad package. The calibrated visibilities were Fourier-transformed using ‘robust’ weighting, which provided the best signal-to-noise ratio combined with sidelobe suppression. The shortest baselines were excluded to avoid confusion of diffuse, extended emission.
Observations at 17.8 and 24.5 GHz
HD 93129A was recently found to be a wide binary formed by two O-type stars (Nelan et al. 2004). Its unique spectral type (O2 If*), and its radio detection at 4.8 and 8.64 GHz as a non-thermal source (Benaglia & Koribalski 2004) make it a very interesting stellar system. In order to get a radio spectrum from 1 to 25 GHz, 12 mm observations were taken in 2004 May, at 17.8 and 24.5 GHz (0.17 and 0.12 cm). Adverse weather conditions reduced the effective observing LST range time to around 4 h. We alternately observed the frequency pairs of 17.728/17.856 GHz, and 24.428/24.556 GHz with 128 MHz bandwidth each, to maximize the spectral range, sensitivity, and UV coverage. The target scans were 6 min long, inserted between shorter phase calibrator scans. The absolute flux density was calibrated against Mars and PKS B0607–15.
Emission Mechanisms
The optically thick wind of a radio star emits thermal radiation by means of the bremsstrahlung mechanism (Wright & Barlow 1975). At radio frequencies (S v T ) is related to the stellar mass loss rate by
Here ψ is the mean number of electrons per ion, Z is the rms ionic charge, and g ν is the free-free Gaunt factor. In principle, the mass loss rate of an early-type star can be derived in a straightforward manner, by measuring the thermal radio flux density.
However, since the earliest observations of these stars, evidence of a spectral index reaching lower values than the thermal regime arose (Bieging, Abbott, & Churchwell 1989). Emission characterized by such index is explained advocating the presence of energetic electrons embedded in the magnetic fields present in the winds that are involved in synchrotron emission. The total flux density will have a thermal (S ν T ∝ ν α T , with α T = 0.6 – 0.8) and a non-thermal (S ν NT ∝ ν α NT ) contribution. It is widely accepted that the relativistic electrons are accelerated by the first-order Fermi mechanism in diffusive shocks (Bell 1978), and follow a power-law distribution of the form N e(γ) ∝ γ –p , where p = 2α NT + 1 and γ is the electron Lorentz factor. The shocks can be present not only in single winds (White 1985) but, in the case of a binary system with interacting winds, at the CWR (Eichler & Usov 1993).
As a result of the interaction between the copious UV photons, supplied by the OB star, and the relativistic electrons, high-energy emission by IC scattering (Chen & White 1994) is also generated. The IC photon index Γ (N ph(E) ∝ E –Γ ) in the Thomson regime is related to p by p = 2Γ + 1 and hence with α NT. If synchrotron and IC losses become important, the electron index is expected to change to p′ = p + 1 (Longair 1997). The Lorentz factor at which the distribution changes (γ b) is a function of the average energy density of the photon field and the average time spent by the particles in the field region (Benaglia & Romero 2003). This last variable depends, in turn, on the size of the non-thermal source and the velocity of the particles, c/k, where k is a normalization parameter.
It is important to consider the effects capable of modifying the radio emission. Part of the synchrotron photons can be absorbed by the wind thermal ions (free–free absorption, FFA). The non-thermal flux can be expressed as S ν NT ∝ ν α NT exp(τ 0 ν –2.1) , where τ 0 is the optical depth at which the flux decreases in a factor of 1/e (Skinner et al. 1999). The thermal emission can also be absorbed by thermal ions in the so-called internal FFA. Synchrotron self-absorption (SSA) will affect the emission at low frequencies as S(ν) ∝ ν 5/2. The critical frequency ν SSA where this mechanism acts can be expressed as (Williams 1963)
where θ [arcsec] is the angle subtended by the emitting region, B [G] is the magnetic field at the emitting region, and S [mJy] is the non-thermal flux without absorption. The Razin–Tsytovitch effect (RTe) will be important for frequencies below ν RT = 20 n e B –1 Hz, where n e is the electron density at the emitting region (Pachlolczyk 1970).
Results
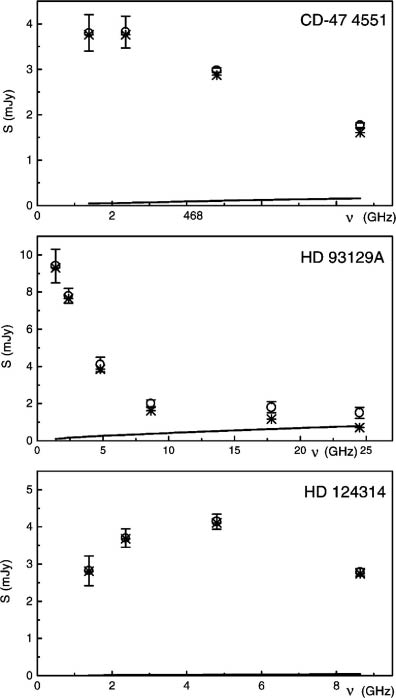
All four stellar systems were detected at both 1.4 and 2.4 GHz, while HD 93129A was also detected at 17.8 and 24.5 GHz (see Figures 1–5). The detected radio sources are, as expected, unresolved. For CD-47° 4551, HD 124314, and HD 150136 the flux densities and spectral indices measured at 1.4 and 2.4 GHz as well as previous measurements at 4.8 and 8.64 GHz are given in Table 3. The flux densities measured for HD 93129A from 1.4 to 24.5 GHz are given in Table 4. The quoted flux density uncertainties correspond to the measured 1σ rms in the corresponding ATCA image (see Figures 1–5).

|

|

|

|

|

|
The radio spectra based on the measured flux densities of all four stars show evidence for non-thermal emission suggesting that relativistic electrons are accelerated in shocks, like the ones present in wind-collision regions. The targets were selected because of their non-thermal emission at 3/6 cm, and the trend is confirmed with the 13/20 cm data. The value for the HD 124314 fluxes at 3 and 6 cm (observed three times) were taken as the average of the fluxes detected closer in time, during the year 2000 (see Benaglia & Koribalski 2004 for details).
While imaging HD 93129A at 17.8 and 24.5 GHz we discovered a new radio source (see Figure 6). Its position is (RA, Dec)J2000 = (10h43m59.99s, –59°33′09.2′′), very close to the star DETWC Tr 14 J104359.9-593309 (DeGioia-Eastwood et al. 2001). The measured flux densities are S 17.8 GHz = 2.2 ± 0.2 mJy and S 24.5 GHz = 2.6 ± 0.5 mJy. The corresponding spectral index is 0.6 ± 0.3, namely as expected for thermal bremsstrahlung emission from a stellar wind. The visual magnitudes for this star are V = 13.46 and B = 14.76. If it belongs to the Tr 14 cluster (d ≈ 2.5 kpc), the spectral type should be between B0 V and B2 V.

|
Non-Thermal Emission
The measured fluxes of CD-47° 4551, HD 124314, and HD 150136 presented turnovers along the frequency axis (see Tables 3 and 4). The flux of HD 93129A diminished with frequencies, but the slighter decrease between 1.4 and 2.4 GHz is indicative that the turnover is beginning to appear towards shorter frequencies. Processes like SSA, RTe, and FFA can contribute to the turnover. Unfortunately, due to the lack of data below 1.4 GHz, and the fact that the turnover is poorly defined, it was not possible to determine which process — and in which manner — shape the spectra at low frequencies.
The strong non-thermal emission found at the stellar spectra is not easy to isolate and characterize, as the processes mentioned above affect it severely. The emitting regions were detected as ATCA point sources, yielding no information on source sizes; additionally the observational dataset for each star, although covering an important frequency interval, is reduced to four points (six in the case of HD 93129A). Moreover, the flux from a CWR varies with time, depending on the orbit and the relative positions of the two components in a binary system.
However, a rough estimation of the non-thermal spectral index can be done under the following simplifying assumptions.
We have analyzed the simultaneity of the radio measurements. In the case of HD 93129A, on a first approximation, all the observations can be considered simultaneously taken: The interval between observations was 18 months; the interpretation of very new HST ACS/HRC data combined with the former FGS observations is consistent with a binary of period ≈50 yr (Maíz-Apellániz et al. 2006). The observations of CD-47° 4551 and HD 124314 covered a time interval of ≈3.5 yr. Optical monitoring of radial velocities is needed to test the condition for CD-47° 4551 and HD 124314. On the contrary, the work on HD 150136 by Niemela & Gamen (2005) established that the (O3.5 I + O6 V) form a close pair (period 2.7 days). That means that each of the radio flux densities presented here should be taken as a mean value, averaged over LST ranges of several hours, and precludes any non-thermal flux estimate. Thus, we have assumed that the radio flux densities for CD-47° 4551, HD 93129A, and HD 124314 are quasi-simultaneous, despite the hours interval elapsed during observation.
The search for early-type companions of OB stars has been progressing successfully (Niemela et al. 2006; Rauw et al. 2005), making the existence of single stars with detectable synchrotron radiation look doubtful. Although the binary nature of CD-47° 4551 has to be studied, and the ‘SB1?’ tag of HD 124314 has yet to be confirmed, it seems reasonable to assume that the stars are both (O+OB) binaries and the non-thermal radiation can be produced at a CWR in each system.
If the thermal contribution S T can be subtracted from the observed flux densities (S) at frequencies large enough for which the effects of absorption mechanisms minimize, an un-absorbed non-thermal flux will be obtained. We proceeded to compute α NT between fluxes at 3 and 6 cm, in the way explained below.
We assumed the mass loss rate of each star/system as listed in Table 1, and computed the values for S T from Eqn (1) at 3 cm (8.64 GHz) for γ = Z = 1. The flux values at 6/3 cm showed also, in general, lower relative errors than the rest, and they were taken simultaneously. For an average thermal spectral index of +0.7, the thermal flux at 6 cm could be derived. With the total and the thermal fluxes at 3 and 6 cm, the estimates of the respective non-thermal flux and the corresponding spectral index were performed. The resulting values are given in Table 5.

|
Figure 7 displays, besides the ATCA fluxes, the subtracted thermal contribution and the residual flux at each observed frequency. It can be appreciated that the values obtained for the thermal contribution in each case were always much smaller that the non-thermal ones: The non-thermal CWR emission seems to dominate over any thermal emission from the individual stellar winds.
|
Stellar X-ray Emission
OB stars — either single or multiple — are known as X-ray detectable emitters (Berghöfer et al. 1997; Chlebowski & Garmany 1991), with X-ray luminosities >10–7 L bol. However, some X-ray features are considered as evidence of a CWR, like larger luminosities, or the presence of the FeKα emission line, produced at wide-binaries collisions events.
Whereas low-mass flare activity produces a highly correlated behaviour between X-ray and radio emission, for OB stars in contrast such emission mechanisms remain open to different interpretations.
The four target stars have been detected as non-thermal radio emitters. They are very hot, luminous, and massive. One is cataloged as a binary with another early-type star (HD 93129A) and it was detected at radio waves despite its large distance (2.5 kpc). HD 124314 is also a binary, and presented flux variations up to 40% (Benaglia et al. 2001). HD 150136 belongs to a multiple system with other OB stars. Finally, there is no binary information about the fourth object, CD-47° 4551. We proceeded to investigate their X-ray emission from literature data, in order to check if they fulfill the L X/L bol ratio for OB stars, if in any case this ratio exceeds the canonical value (indicative of strong shocks at a CWR), and, if spectroscopic data were available, to look for the FeKα complex.
X-rays from CD-47° 4551
ROSAT archive data were found on the field of CD-47° 4551. The investigation on stellar X-rays was performed using 4 ROSAT-PSPC X-ray observations towards this star (see Table 6). The angular resolution of these data is about 45 arcsec. The image FOV is 6.32°×6.32° and the scale is 15′′ per pixel. Our analysis was carried out using the ximage and pimms software.

|
We first extracted the photon count rates over a radius of 2′, which include more that 90% of the PSF encircled energy. Due to the high pixel scale, the circle encompasses other optical (Digitized Sky Survey: DSS 3 ) sources in the field (see Figure 8a), though the resolution of the X-ray data does not allow to distinguish between emission from nearby stars. However, only two B stars were cataloged over that circle according to the SIMBAD database, enabling us to disregard their X-ray contribution, and conclude that the O4 III star dominates the observed X-ray emission.

|
According to the different ROSAT energy images (Figure 8b–8d), the observed X-ray emission appears quite hard, above 1 keV. We measured count rates in three X-ray bands — a wide band at 0.1–2.4 keV, a soft band (S) at 0.1–0.5 keV, and a hard band (H) between 0.5–2.0 keV. Furthermore, we estimated the hardness ratio, (H–S)/(H+S), yielding an average of 0.91 ± 0.09. This result implies that most (about 70%) of the emitted X-ray energy lies between 1.0 and 2.4 keV (see Table 7). The low signal-to-noise ratio of the observation prevents us from estimating count-rate error values, although we confirm that the average total count rate for CD-47° 4551 is 1.13 ± 0.08 × 10⁻³ cts s–1.

|
It was previously settled that non-thermal radio emission is produced by the synchrotron mechanism, and can be described at 3/6 cm by an index α NT = –1.0 (see ‘Results’). The X-ray emission is hard; the scattering processes are more important at several stellar radii where the UV photon density is larger. It will be expected then that inverse Compton processes are responsible for the observed hard X-ray emission, as well as that absorption processes are related to the outer layers of the stellar wind. We have assumed that X-rays originate in wind layers external enough to be almost un-affected by stellar absorption, enabling us to neglect the wind–X-ray interaction. A strong shock in the O4 III star is originated when the wind reaches velocities close to the terminal velocity, at several stellar radii. At this point, the wind density (and thus the absorption produced by the wind) is very low. We considered that only neutral absorption processes associated with the ISM are affecting the X-rays from this source, and adopt a cold absorption model.
We calculated the total Galactic Hi column density using the Web version of the N Hi -ftool software 4 , and estimated an interstellar column of neutral hydrogen N Hi of 0.92 × 1022 cm–2.
The X-ray count rate can be converted to fluxes using pimms, yielding an un-absorbed flux of 1.35 × 10⁻¹³, 0.024 × 10⁻¹³, and 0.76 × 10⁻¹³ erg cm–2 s–1 for the total, soft, and hard bands, respectively.
At a distance of 1.3 kpc, the total X-ray luminosity of CD-47° 4551 is then L X ∼ 2.73 × 1031erg s–1. From the calibration tables of Martins et al. (2005), we adopt a value log(L bol/L⊙) = 5.85, and L X/L bol is 1.2 × 10⁻⁸.
X-rays from HD 93129A
The target HD 93129A is placed at the core of the Trumpler 14 open cluster in the Carina Nebula, one of the most observed regions in X-rays. We found ten available XMM-Newton X-ray observations towards this particular stellar system. Seven of these were centered at the LBV η Carinae star, while the rest are centered at the WR 25 system (WN7+abs). At these pointing directions HD 93129A shows an offset of 11.767′′ and 10.455′′, respectively. These differences imply changes in the PSF as well as the encircled energy radii: in the most favourable situation (observations centered at WR 25, see Table 8), the 90% of encircled energy needs an extraction radius of 40′′. In order to disentangle the contamination from nearby sources in the resulting HD 93129A spectrum, we used an extraction radius of 11′′, in which the fraction of the encircled energy is only about 60%. In doing this, we favoured the extraction of an uncontaminated HD93129A spectrum against losing some X-ray photons from the external zone of the PSF (downgrading statistics). The final angular resolution of the image resulted in ≈ 6 arcsec, over a FOV of 30 arcmin.

|
Most massive stars are known to display thermal X-ray spectra with strong and broad emission lines (Kahn et al. 2001; Cohen et al. 2003), contributed by non-thermal emission arising from IC scattering of UV photons due to the presence of a population of relativistic electrons (Pollock 1987; Chen & White 1991; Eichler & Usov 1993). However, HD 93129A seems to display several emission lines from low to high energies (see Figure 9). Such emission lines can only be produced by high-temperature thermal plasma; consequently, the spectral analysis presented here was performed using solely a combination of thin thermal emission models.

|
Our spectral fits were performed using combined data from all EPIC cameras, in order to improve statistics and discard any instrumental dependence that could be produced by the different responses of the detectors. The spectral model fitted consisted of a combination of absorption and emission models. Two separate absorption columns were used: (a) one based on the wabs atomic cross section (Morrison & McCammon 1983) to account for the action of the circumstellar medium, and (b) one with the ionized absorber model absori (Done et al. 1992) to include the effect of the stellar wind absorption processes. The first absorption component is due to the neutral material and hydrogen column density, which was calculated and fixed at N H = 0.52 × E(B – V) × 1022 cm–2 = 0.286 × 1022 cm–2 (Shull & van Steemberg 1985). Here (B – V) = 0.22 (Walborn et al. 2002). Table 9 gives the results of the fits. The variable N w stands for the absorption model of ionized wind material, which was left as a free parameter along the whole fitting procedures. Given the high signal-to-noise ratio of the EPIC spectra (below 4 keV), we easily resolve single and blended spectral emission lines from Oviii, Fexvii (0.825 keV), Mgxi (1.352 keV), Sixiii (1.864 keV), Sixiv (2.006 keV), Sixiii (2.182 keV), Sxv (2.460 keV), Sxvi (2.622 keV), Arxvii (3.139 keV), and Caxx (4.107 keV). Because of the wide range of temperature (3 × 10⁶ to 6.2 × 10⁷ K) needed to form these emission lines, some of them cannot be fitted by the two-temperature model (see Figure 9). Moreover, there seems to be evidence of line excess about 4.8 keV and 6.6 keV. Unfortunately, the poor quality of the data above 4 keV does not allow us to check for the presence of the Fexxv 6.4–6.7 keV line complex that could help us to constrain the thermal and/or non-thermal emission at the hard part of the spectrum. Such detailed study can only be developed using high resolution spectroscopic data, not published at the moment.

|
Solar abundances are assumed throughout the whole fitting procedure. EPIC MOS and PN fitting results appear very consistent, and our models reveal no significant differences in the quality of the fit. Both procedures are nearly equivalent within the error bars of the models. The goodness of the fit was estimated using the χ ν 2 statistics, and values obtained for all EPIC instruments are quite similar. Adopted parameters were estimated using all EPIC spectra simultaneously.
In the 0.5–10.0 keV range, we calculated an observed X-ray flux of 5.66 × 10⁻¹³ erg cm–2 s–1, while the corrected absorbed X-ray flux is 78.0 × 10⁻¹³ erg cm–2 s–1. For a source distance of 2.5 kpc, the unabsorbed X-ray luminosity is L X = 4.51 × 1033 erg s–1. According to the spectral type of HD 93129AB, its bolometric luminosity is about 1.20 × 1040 erg s–1, then L X/L bol = 3.75 × 10⁻⁷. This value agrees with the canonical L X/L bol relationship for O type stars of the region (Albacete Colombo, Méndez, & Morrell 2003).
X-rays from HD 124314
We found just one X-ray candidate in the HEASARC master compilation of X-ray sources within 0.05° of the HD 124314 position, at (RA, Dec)J2000 = (14h15m 00s.934, –61°42′ 19.91′′). This source was detected by the ROSAT All-Sky Survey of Faint Sources Catalog (RASSFSC), and is named 1RXS J141500.1–614231, with a total exposure time of 13472 s. We estimated a total count rate of 1.82 × 10⁻³, 0.36 × 10⁻³, and 1.45 × 10⁻³ cts s–1 in the total (wide) (0.11–2.4 keV), S (0.2–0.5 keV), and H (0.5–2.4 keV) energy bands, respectively. We also estimated a hardness ratio (H–S)/(H+S) of about 0.60 ± 0.09. We expect the star emits detectable X-rays; the fact that HD 124314 is a field star, combined with the positional coincidence between the star and the X-ray source lead us to assume that the X-ray source is physically related with the star.
At a distance of 1 kpc (de Wit et al. 2004), we computed a total Galactic Hi column density of 1.84 × 1022 cm–2.
With the pimms software we calculated an un-absorbed X-ray flux of 2.67 × 10⁻¹³ erg cm–2 s–1. The estimated ratio log(L bol/L⊙) = 5.32 for this star. Then, L X/L bol is about 0.83 × 10⁻⁷.
X-rays from HD 150136
Berghöfer et al. (1997) identified a ROSAT source of L X(0.1 – 2.4 keV) = 1.12 × 1033 erg s–1, with HD 150136, although the emission came also from HD 150135. In order to both determine the precise origin of this emission, and study the emission process, Skinner et al. (2005) performed Chandra observations towards the cluster NGC 6193, over 90 000 s. They found a soft photon energy distribution from HD 150136, interpreted as indicative of the presence of shocks in the winds.
The results of their 2T model fitting (0.35 ± 0.04, and 1.00 ± 0.07 keV), assuming N Hi = 4 × 1021 cm–2, yielded an X-ray flux of 3.3 × 10⁻¹² erg cm–2 s–1 and L X = 2.45 × 1033 erg s–1 at the (0.5–6) keV band, obtaining L X/L bol = 3.98 × 10⁻⁷.
The spectrum of HD 150136 presented by Skinner et al. (2005) showed broad lines. They also reported flux variability on timescales of hours, and proposed it can be produced by occultation effects from a third, and optically unseen, companion (its existence was suggested also by the optical results from Niemela & Gamen 2005).
Table 10 lists the X-ray luminosity and luminosity ratio for the target stars, for comparison.

|
Discussion
CD-47° 4551 and HD 124314
HD 124314 is listed as a possible spectroscopic binary, and has a visual companion. To proceed with our analysis, the binarity status of this star needs to be confirmed, and the spectral classification of the companion, derived.
CD-47° 4551 is not listed as a binary and it has no visual companion. Both stars/systems are currently being monitored at optical wavelengths to study their structure.
The presence of non-thermal radio emission suggests that at least part of the X-ray emission should be non-thermal, too. We found two ROSAT sources: one over CD-47° 4551, and another over HD 124314, which can be generated by relativistic bremsstrahlung and inverse Compton processes.
The NT spectral index of CD-47° 4551 of α 3–6 cm ≈ –1 implies an electron distribution index of p ≈ –1. For HD 124314, the NT spectral index α NT≈ –0.7 and p ≈ –0.4.
The difference of the p values with the one corresponding to particle acceleration in a strong adiabatic wind (≈–2) can be found by studying the conditions present at the acceleration region, and depends also on the relevance of the radiative losses. However, the difference can also be taken as an indication that the hypothesis, that the observations presented here are quasi-simultaneous, has to be revised. Really simultaneous multifrequency observations are needed instead to perform an analysis capable of explaining the radio spectra of these hot stars.
HD 124314 lies inside the location probability contours of the EGRET source 3EG J1410-6147 (Romero, Benaglia, & Torres 1999), one of the few high-energy sources with E > 10 GeV. The counterpart of this EGRET source has been proposed to be the SNR G312.4–0.4 (Torres et al. 2003); nevertheless, a composite origin cannot be ruled out and high energy emission from the stellar system can make a contribution.
HD 93129A
From the latest optical and radio studies on the stellar system HD 93129A (Nelan et al. 2004; Benaglia & Koribalski 2004) an approximate description of the stellar and orbital parameters can be addressed. The HST data showed a binary separation of 55 mas, or 140 AU, at 2.5 kpc. A wind-momentum ratio η = (M 2 v ∞,2)/(M 1 v ∞,1) = 0.14 is derived, where ‘1’ stands for the primary star and ‘2’ for the secondary star parameters. The derivation is based on mass-loss rates of 2.3 × 10⁻⁵ M⊙ yr–1 and 0.3 × 10⁻⁵ M⊙ yr–1, and wind velocities of 3200 km s–1 and 3000 km s–1 for the two stars (Repolust, Puls, & Herrero 2004; Benaglia & Koribalski 2004). These results place the colliding-wind region 15 mas from the companion star, and lead to an estimated CWR size of π r 2 ∼ 50 mas (Eichler & Usov 1993).
The magnitude of the magnetic field as a function of distance, in wide systems, is related to the stellar surface magnetic field B * (Eichler & Usov 1993) by
where R * is the stellar radius, r A the Alfvén radius, and v rot the surface rotation velocity. For early-type stars, v rot≈ (0.1 – 0.2)v ∞ and r A ≈ (1 – 3)R *.
Only in very few cases a value of the stellar magnetic field could be derived: Donati et al. (2001, 2002) measured B * for two early-type stars, β Cephei (B1 IV) and θ1 Ori C (O4-6 V), and obtained the values 360 ± 30 G and 1100 ± 100 G, respectively. Theoretical values are about a few hundred Gauss.
Observations at the radio range can give a hint on stellar magnetic fields. When non-thermal radio emission is detected and detached from the thermal flux, an equipartition magnetic field at the CWR can be derived following Miley (1980). The following approximated expression for minimum energy conditions can be used:
Here θ is the CWR size [mas], α ′ = α NT + 0.5, d [kpc], χ is the energy ratio between heavy particles and electrons, f is the filling factor of the emitting region, S x is the flux density [mJy] of the region at frequency ν x [GHz], and ν 1 [GHz] and ν 2 [GHz] are the upper and lower cut-off frequencies presumed for the radio spectrum. We have assumed that the energy of particles and electrons is the same and a filling factor of 1.
By means of the ATCA data and a non-radio derived mass loss rate value, we determined a non-thermal spectral index α 3–6 cm NT ≈ –1.5 ≈ –1.5 (see ‘Results’). There is clear evidence from the spectrum that non-thermal emission is present at all wavelengths. For θ ≈ 50 mas, an equipartition field at the emitting region of B CWR≈10 mG is computed, using x = 8.64 GHz in Eqn (4), and Table 5 5 . A corresponding (minimum) stellar magnetic field of B * ∼ 50 G is derived, by assuming v rot = 0.2v ∞, r A = 3R *, and R * = 20 R⊙ (Martins, Schaerer, & Hillier 2005).
For this particular B-field, we can evaluate the frequencies below which the RTe and SSA are relevant. The electron density can be expressed in terms of the mass loss rate of the primary star, as n
e =
1/(4πr
1
ν
∞
μ
1
m
H)
, yielding n
e ∼ 6 × 104 cm–3 and then ν
RTe ∼ 120 MHz.
From Eqn. (2), ν SSA ∼ 25 MHz. Even if the unabsorbed flux at 1.4 GHz is considered higher than the measured flux (i.e. 5S 20 cm) ν SSA ∼ 50 MHz. With the parameters set adopted, if the turnover at 1.4 GHz is ascribed to SSA, the equipartition magnetic field at the CWR would be too high to represent a real scenario.
The non-thermal spectral index α 3–6 cm NT ≈ −1.5 implies an electron distribution with p = –4. Explanations of this high value can be found (a) if the injected spectrum is sufficiently steep or (b) if the radio emission is produced by a population of electrons with Lorentz factors above γ b. An estimate of γ b leads to compute the radio frequency at which the spectral index change from (α NT) to (α NT + 0.5) in ν b > 106 k –1 GHz. A k value to make ν b in the GHz range has no physical meaning for relativistic particles.
The maximum Lorentz factor attained by the electrons at the CWR, computed as in Benaglia & Romero (2003), is γ max = 1.6 × 10⁵. This corresponds to a maximum synchrotron frequency of ν = 1 × 10⁶ GHz, and a cutoff energy for the IC photons of E ≈ 5 GeV.
Conclusions
We measured the spectrum of HD 93129A from 1.4 to 24.5 GHz and found the flux decreases with frequency. The negative spectral indices, and the high flux values detected (up to 9.4 mJy) for an O star, are consistent with synchrotron emission from a CWR. An X-ray source coincident in position with the star was found from XMM archive data analysis, and a two temperature spectrum could be fitted which accounts for the many X-ray spectral lines present. The source shows a high L X/L bol ratio of 3.8 × 10⁻⁷, characteristic of OB binaries. The (low) quality of the data above 4 keV prevented us to explore the presence of Fe lines considered as a signature of colliding winds. The hard emission found by Evans et al. (2004) also favours a CWR origin. The intense NT radio emission suggests that the system could be, in principle, detectable with forthcoming high-sensitivity gamma ray telescopes.
CD-47° 4551 and HD 124314 are radio non-thermal emitters, and the spectra show a turnover from 1.4 to 8.64 GHz. Their detected fluxes were strongly contaminated with non-thermal emission. Precise (optical) information about the structure of their systems, lacking at the moment, is crucial to reveal the presence of close early-type companions and wind colliding regions, in order to perform a quantitative radio study towards these stars. Both stars are coincident with ROSAT sources, identified here with the stars, and for which we estimated the corresponding luminosity. The L X/L bol ratios obtained for them (∼ 10–8) appear low for strong wind collisions: We found no relevant excess when these fluxes are compared with those corresponding to single stars.
HD 150136 is in a multiple system, with at least three early-type stars. Its radio emission also shows important non-thermal contamination, up to 8.64 GHz, though HD 150136 is seen as a point source. To account for the contributions in its radio spectrum, very long-baseline, multifrequency radio observations (separated at most by a few hours) are fundamental. The extensive X-ray investigation by Skinner et al. (2005) permits to derive a high L X/L bol ratio of 4 × 10⁻⁷, characteristic of heated gas at a wind collision event.
The picture of these four interesting southern NT OB systems could benefit if at least some of the following studies are pursued: (a) simultaneous radio observations at several frequencies and at higher angular resolution to image and resolve the wind region, (b) optical studies looking for companions, both to discover the structure of the stellar systems and to classify the components, (c) dedicated high angular resolution X-ray observations including spectroscopy, and (d) high-resolution/sensitivity gamma-ray observations.
Acknowledgments
P.B. thanks G. E. Romero for useful discussions, JBR, the ATNF staff at Marsfield and Narrabri for constant help, and N. R. Walborn for a critical reading of the manuscript. J.F.A.C. acknowledges support by the Marie Curie Fellowship Contract No. MTKD-CT-2004-002769 of the project ‘The Influence of Stellar High Energy Radiation on Planetary Atmospheres’, and the host institution INAF (Osservatorio Astronomico di Palermo, OAPA). This research has been supported by the Argentine agency ANPCyT through grant PICT 03-13291.
Albacete Colombo,
J. F., Méndez,
M., & Morrel,
N. I. 2003, MNRAS, 346, 704
| Crossref | GoogleScholarGoogle Scholar |

Bell,
A. R. 1978, MNRAS, 182, 147
Benaglia,
P., Cappa,
C. E., & Koribalski,
B. S. 2001, A&A, 372, 952
| Crossref | GoogleScholarGoogle Scholar |
Benaglia,
P., & Koribalski,
B. 2004, A&A, 416, 171
Benaglia,
P., & Romero,
G. E. 2003, A&A, 399, 1121
| Crossref | GoogleScholarGoogle Scholar |
Berghofer,
T. W., Schmitt,
J. H. M. M., Danner,
R., & Cassinelli,
J. P. 1997, A&A, 322, 167
Bieging,
J. H., Abbott,
D. C., & Churchwell,
E. B. 1989, ApJ, 340, 518
| Crossref | GoogleScholarGoogle Scholar |
Blomme,
R., van Loo,
S., & De Becker,
M., et al. 2005, A&A, 436, 1033
| Crossref | GoogleScholarGoogle Scholar |
Chen,
W., & White,
R. L. 1991, ApJ, 381, L63
| Crossref | GoogleScholarGoogle Scholar |
Chen,
W., & White,
R. L. 1994, Ap&SS, 221, 259
Chlebowski,
T., & Garmany,
C. D. 1991, ApJ, 368, 241
| Crossref | GoogleScholarGoogle Scholar |
Cohen,
D. H., de Messieres,
G. E., & MacFarlane,
J. J., et al. 2003, ApJ, 586, 495
| Crossref | GoogleScholarGoogle Scholar |
Contreras,
M. E., Rodriguez,
L. F., & Tapia,
M., et al. 1997, ApJ, 488, L153
| Crossref | GoogleScholarGoogle Scholar |
De Becker,
M., Rauw,
G., & Blomme,
R., et al. 2004, A&A, 420, 1061
DeGioia-Eastwood,
K., Throop,
H., Walker,
G., & Cudworth,
K. M. 2001, ApJ, 549, 578
| Crossref | GoogleScholarGoogle Scholar |
de Wit,
W. J., Testi,
L., & Palla,
F., et al. 2004, A&A, 425, 937
| Crossref | GoogleScholarGoogle Scholar |
Donati,
J.-F., Babel,
J., & Harries,
T. J., et al. 2002, MNRAS, 333, 55
| Crossref | GoogleScholarGoogle Scholar |
Donati,
J.-F., Wade,
G. A., & Babel,
J., et al. 2001, MNRAS, 326, 1265
| Crossref | GoogleScholarGoogle Scholar |
Done,
C., Mulchaey,
J. S., Mushotzky,
R. F., & Arnaud,
K. A. 1992, ApJ, 395, 275
| Crossref | GoogleScholarGoogle Scholar |
Dougherty,
S. M., Beasley,
A. J., Coker,
R. F., & Corcoran,
M. F. 2005, ApJ, 623, 447
| Crossref | GoogleScholarGoogle Scholar |
Dougherty,
S. M., Pittard,
J. M., & Kasian,
L., et al. 2003, A&A, 409, 217
| Crossref | GoogleScholarGoogle Scholar |
Dougherty,
S. M., Williams,
P. M., & van der Hucht,
K. A., et al. 1996, MNRAS, 280, 963
Eichler,
D., & Usov,
V. 1993, ApJ, 402, 271
| Crossref | GoogleScholarGoogle Scholar |
Evans,
N. R., Schlegel,
E. M., & Waldron,
W. L., et al. 2004, ApJ, 612, 1065
| Crossref | GoogleScholarGoogle Scholar |
Evans,
N. R., Seward,
F. D., & Krauss,
M. I, et al. 2003, ApJ, 589, 509
| Crossref | GoogleScholarGoogle Scholar |
Feast,
M. W., Thackeray,
A. D., & Wesselink,
A. J. 1954, MmRAS, 67, 51
Herbst,
W., & Havlen,
R. J. 1977, A&AS, 30, 279
Howarth,
I. D., Siebert,
K. W., Hussain,
G. A. J., & Prinja,
R. K. 1997, MNRAS, 284, 265
Jardine,
M., Collier Cameron,
A., Donati,
J.-F., & Pointer,
G. R. 2001, MNRAS, 324, 201
| Crossref | GoogleScholarGoogle Scholar |
Kahn,
S. M., Leutenegger,
M. A., & Cottam,
J., et al. 2001, A&A, 365, L312
| Crossref | GoogleScholarGoogle Scholar |
Lucy,
L. B., & White,
R. L. 1980, ApJ, 241, 300
| Crossref | GoogleScholarGoogle Scholar |
Maíz-Apellániz, J. 2006, Resolved Stellar Populations, ASP Conf. Ser. in press. (ASP: San Francisco)
Maíz-Apellániz,
J., Walborn,
N. R., Galué,
H. A., & Wei,
L. H. 2004, ApJS, 151, 103
| Crossref | GoogleScholarGoogle Scholar |
Martins,
F., Schaerer,
D., & Hillier,
D. J. 2005, A&A, 436, 1049
| Crossref | GoogleScholarGoogle Scholar |
Mason,
B., Gies,
D. R., & Hartkopf,
W. I., et al. 1998, AJ, 115, 821
| Crossref | GoogleScholarGoogle Scholar |
Miley,
G. K. 1980, ARA&A, 18, 165
Moran,
J. P., Davis,
R. J., & Spencer,
R. E., et al. 1989, Nat, 340, 449
| Crossref | GoogleScholarGoogle Scholar |
Morrison,
R., & McCammon,
D. 1983, ApJ, 270, 119
| Crossref | GoogleScholarGoogle Scholar |
Nelan,
E. P., Walborn,
N. R., & Wallace,
D. J., et al. 2004, ApJ, 128, 323
Niemela,
V. S., & Gamen,
R. C. 2005, MNRAS, 356, 974
| Crossref | GoogleScholarGoogle Scholar |
Niemela,
V. S., Gamen,
R. C., Solivella,
G., & Benaglia,
P., et al. 2006, submitted,
Pachlolczyk, A. G. 1970, Radio Astrophysics (Freeman: San Francisco)
Pollock,
A. M. T. 1987, A&A, 171, 135
Prinja,
R. K., Barlow,
M. J., & Howarth,
I. D. 1990, ApJ, 361, 607
| Crossref | GoogleScholarGoogle Scholar |
Repolust,
T., Puls,
J., & Herrero,
A. 2004, A&A, 415, 349
| Crossref | GoogleScholarGoogle Scholar |
Romero,
G. E., Benaglia,
P., & Torres,
D. F. 1999, A&A, 348, 868
Shull,
J. M., & van Steenberg,
M. E. 1985, ApJ, 294, 599
| Crossref | GoogleScholarGoogle Scholar |
Skinner,
S. L., Itoh,
M., Nagase,
F., & Zhekov,
S. A. 1999, ApJ, 524, 394
| Crossref | GoogleScholarGoogle Scholar |
Skinner,
S. L., Zhekov,
S. A., Palla,
F., & Barbosa,
C. L. D. R. 2005, MNRAS, 361, 191
| Crossref | GoogleScholarGoogle Scholar |
Taresch,
G., Kudritzki,
R. P., & Hurwitz,
M., et al. 1997, A&A, 321, 531
Torres,
D. F., Romero,
G. E., Dame,
T. M., Combi,
J. A., & Butt,
Y. M. 2003, PhR, 382, 303
van Loo, S. 2005, Ph.D. Thesis (University of Leuven: Leuven)
Vink,
J. S., de Koter,
A., & Lamers,
H. J. G. L. M. 2000, A&A, 362, 295
Walborn,
N. R. 1973, ApJ, 179, 517
| Crossref | GoogleScholarGoogle Scholar |
Walborn,
N. R. 1982, AJ, 87, 1300
| Crossref | GoogleScholarGoogle Scholar |
Walborn,
N. R. 1995, RMxAA, 2, 51
Walborn,
N. R., Howarth,
I. D., & Lennon,
D. J., et al. 2002, AJ, 123, 2754
| Crossref | GoogleScholarGoogle Scholar |
Wegner,
W. 1994, MNRAS, 270, 229
White,
R. L. 1985, ApJ, 289, 698
| Crossref | GoogleScholarGoogle Scholar |
Williams,
P. J. S. 1963, Nat, 200, 56
Wright,
A. E., & Barlow,
M. J. 1975, MNRAS, 170, 41
Yamaguchi,
N., Mizuno,
N., & Moriguchi,
Y., et al. 1999, PASJ, 51, 765
1 The Australia Telescope is funded by the Commonwealth of Australia for operation as a National Facility managed by CSIRO.
2 astro.ic.ac.uk/jvink
3 The Digitized Sky Survey was produced at the Space Telescope Science Institute under the US Government grant NAG W-2166.
4 heasarc.gsfc.nasa.gov/cgi-bin/Tools/w3nh/w3nh.pl
5 We note that the last value is relevant as an order of magnitude. A different filling factor of, say, f = 0.1, or a CWR size value halved, would double the value of B CWR.