

Tuberculosis in NSW, 2009–2011
Chris Lowbridge A B , Amanda Christensen A and Jeremy M. McAnulty AA Health Protection NSW
B Corresponding author. Email: clowb@moh.health.nsw.gov.au
NSW Public Health Bulletin 24(1) 3-9 https://doi.org/10.1071/NB12115
Published: 15 July 2013
Abstract
Aim: To describe the epidemiology of tuberculosis in NSW between 2009 and 2011 and compare with previous years. Methods: Data from all cases of tuberculosis notified in NSW during this period were extracted from the Notifiable Conditions Information Management System. Descriptive analyses of notification data were undertaken. Incidence rates were calculated per 100 000 population. Results: Between 2009 and 2011, there were 1548 cases of tuberculosis notified in NSW, translating to an average annual notification rate of 7.2 per 100 000 population for this period. A total of 89% (n = 1371) of notified cases were overseas-born, and 1.6% (n = 24) of cases were recorded as Aboriginal persons. The most common site of infection was the lung (60% of cases). Of notified cases, 68% were reported as having been tested for HIV, of which 3% (n = 28) of cases had HIV/tuberculosis co-infection. There were 20 cases of multidrug-resistant tuberculosis, including one case of extensively drug-resistant tuberculosis. Conclusion: The notification rate of tuberculosis in NSW has remained relatively stable over the past two decades, though small incremental increases since 2003 are evident. Endemic transmission of tuberculosis within sub-groups of the NSW population, as well as the ongoing high endemnicity for tuberculosis in neighbouring countries, highlight the importance of tuberculosis control as a continued strategic priority for disease control in NSW.
Tuberculosis (TB) remains a disease of global public health significance. The World Health Organization (WHO) estimates that in 2011 there were 8.7 million incident cases of TB and 1.4 million TB-related deaths, as well as an additional 430 000 deaths as a result of TB and human immunodeficiency virus (HIV) co-infection.1 In Australia the incidence of TB is low: in 2010 it was reported by WHO to be 6.1 cases per 100 000 population. Mortality from TB, excluding HIV-positive cases, was less than one TB-related death per 100 000 population in Australia in 2010.1
Despite Australia’s low incidence, TB control remains a challenge as the epidemiology of this disease must be considered in a global context given the frequency of international travel and migration from high-incidence countries.2 The incidence and prevalence of TB in many of Australia’s international neighbours remains high. Twenty-two countries account for 80% of the global burden of TB; nine of these countries are within the South-East Asian and Western Pacific Regions. These two regions also account for approximately 18% of multidrug-resistant TB (MDR-TB) cases.1
Given the global context of TB epidemiology, elimination of disease within any given country is not considered feasible. The key goals and strategies of the New South Wales (NSW) TB Control Program therefore focus on case finding, early diagnoses and effective treatment in order to minimise and eliminate local transmission.3 NSW has a strong surveillance system in place, whereby all patients diagnosed with TB are notified to a public health unit or chest clinic in accordance with the NSW Public Health Act 2010. Case details are then entered into a central registry, the Notifiable Conditions Information Management System.
The aim of this report is to describe the epidemiology of TB in NSW between 2009 and 2011 by examining the demographic and clinical characteristics, and risk factors for infection, of notified cases. We report on the public health follow-up of cases and the extent of contact tracing activities undertaken by public health and clinical services. We also compare incidence data with data from previous years. Understanding the epidemiology of TB in NSW is critical for informing and evaluating disease control strategies.
Methods
Data sources
TB notification data were extracted from the Notifiable Conditions Information Management System. Data were included in the study when the year of diagnosis was between 2009 and 2011 (inclusive). Population data including NSW mid-year population estimates, estimated populations by country of birth and population estimates by Local Health District (LHD) were obtained from the Australian Bureau of Statistics (ABS) via the Secure Analytics for Population Health Research and Intelligence system. Results for the 2009–2011 period were compared with the two most recently published NSW TB EpiReviews for the periods 2008 and 2003–2007.2,4
Definitions
For the purpose of this report TB was defined as active infection with Mycobacterium tuberculosis. Cases of latent TB are not included. Pulmonary TB was defined as disease occurring within the patient’s lung, excluding the pleura. Extrapulmonary TB was defined as disease affecting any other region of the body including the pleura. A case of TB was defined as ‘new’ when there was no record of previous TB treatment of more than 1 month duration.
TB notification data were analysed by year of diagnosis. Each case of TB is assigned a year of diagnosis, which is the year in which the majority of clinical and public health action, including diagnosis, treatment, isolation and contact tracing, occurred.
High-risk countries were defined as per the WHO definition of countries in which the incidence of TB is greater than or equal to 60 cases per 100 000 population per year.5
Cases were defined as having MDR-TB when their isolates demonstrated resistance to at least isoniazid and rifampicin. Extensively drug-resistant TB (XDR-TB) was defined as cases in which isolates demonstrated resistance to isoniazid and rifampicin, as well as additional resistance to any fluoroquinolone, and to at least one injectable second-line drug (capreomycin, kanamycin or amikacin).6
Statistical analyses
Descriptive analyses of notification data were undertaken. Cases were categorised as overseas-born, non-Indigenous Australian-born, or Aboriginal and/or Torres Strait Islander Australian-born. Overseas-born cases were categorised into regions of birth using ABS standards.7 Incidence rates per 100 000 population were calculated for the whole of NSW using select fields from demographic, clinical, risk factor and contact management data categories. Incidence rates for TB by LHD of residence were calculated and mapped. Data were analysed using SAS® Enterprise Guide® (version 4.3, SAS Institute, Cary, NC, USA).
Results
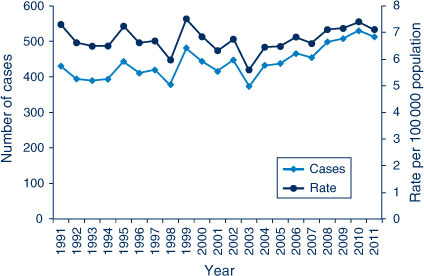
There were 1548 notifications of TB received in NSW between 2009 and 2011 inclusive (507–529 notifications per year), equating to an annualised rate of 7.2 cases per 100 000 population for the period (range 7.1–7.4 per 100 000 population). The rate of TB notification in NSW has remained relatively stable over the past two decades (Figure 1) however there have been small incremental increases since 2003.
|
Demographic characteristics
Males accounted for 56% of tuberculosis cases diagnosed between 2009 and 2011. The mean age of cases was 41 years (range: 6 months–94 years). Adults aged 25–34 years accounted for the largest proportion (30%) of cases (Table 1). There were 24 cases of TB in Aboriginal persons (1.6% of all cases) in NSW between 2009 and 2011, equating to a crude incidence rate of 4.9 cases per 100 000 population per year. The highest annual crude rate of infection in Aboriginal persons was 6.8 cases per 100 000 population (n = 11) in 2010. The rate of infection in non-Indigenous Australian-born persons in 2010 was 1.0 per 100 000 population (9.5% of cases). In 2009, Aboriginal persons were three times more likely to be notified with TB than non-Indigenous Australian-born persons (Incident Rate Ratio (IRR) 3.3, 95% CI: 1.3–8.2), increasing to six times more likely in 2010 (IRR 6.3, 95% CI: 3.3–12.0). Of Aboriginal or Torres Strait Islander persons notified with TB between 2009 and 2011, 50% were residents of the Northern NSW or Mid North Coast LHDs.

|
The majority of cases of TB between 2009 and 2011 (85%) resided within the Sydney metropolitan area, giving an annualised incidence rate of 11.2 per 100 000 population per year. The rate of infection in outer metropolitan, and regional and rural areas was 2.8 and 2.1 cases per 100 000 population respectively (Table 2). Within the Sydney metropolitan area, Sydney LHD and Western Sydney LHD had the highest overall rates and accounted for 41% of all TB notifications in NSW between 2009 and 2011. Of the regional and rural LHDs, Murrumbidgee had the highest rate (3.1 cases per 100 000 population per year).

|
Country of birth
The incidence rate of TB in overseas-born persons in 2010 was 23.2 per 100 000 population, compared to 1.3 cases per 100 000 population for Australian-born persons. Population estimates by country of birth were not available for 2011. Between 2009 and 2011, 89% (n = 1371) of cases were overseas-born. Of overseas-born cases, 45% (n = 613) were born in South-East Asia and 39% (n = 534) were born in the Western Pacific Region.
Site of infection
Between 2009 and 2011, pulmonary only disease (defined as site of infection including the lung but excluding the pleura) accounted for 50% (n = 780) of TB cases (Table 3). Extrapulmonary disease accounted for 40% (n = 623) and cases with both pulmonary and extrapulmonary disease accounted for 9% of cases (n = 145). Lymph nodes were the second most common site of infection after the lung and were recorded as a site of infection in 25% of all cases and 51% of cases with extrapulmonary involvement.

|
Case identification and laboratory confirmation
Of cases between 2009 and 2011, 76% were laboratory confirmed. Laboratory confirmation was made by isolation of M. tuberculosis by culture in 72% (n = 1111) of cases and by polymerase chain reaction alone in 4% (n = 61) of cases. In the remaining 24% of cases, diagnosis was made on clinical grounds with or without laboratory-suggestive evidence. Of pulmonary cases, 62% (n = 575) had M. tuberculosis isolated from a respiratory sample; 30% (n = 274) of pulmonary cases were direct sputum smear‐positive.
Of cases where the nature of identification was reported (n = 1529), the majority (78%) were identified through investigation of symptomatic disease. This was followed by screening for TB (13%); that is, post-migration screening, then contact tracing (6%).
Case classification
Case classification remained stable over the 3-year period from 2009 to 2011, with new active cases making up 94% of all reported cases (Table 3). Previously treated cases made up the remainder, with 3% of cases having received partial or complete treatment overseas and 2% having received partial or complete treatment in Australia.
HIV co-infection
The proportion of cases that were tested for HIV has increased since 2009, with 68% of cases being tested overall for this period. Of those tested for HIV, 28 cases had HIV co-infection (3%) (Table 3). Of HIV co-infected cases, 74% were male and all were aged between 20 and 59 years. Five (18%) were Australian-born, while the remaining cases were born primarily in South and South-East Asian and African countries.
Clinical outcomes
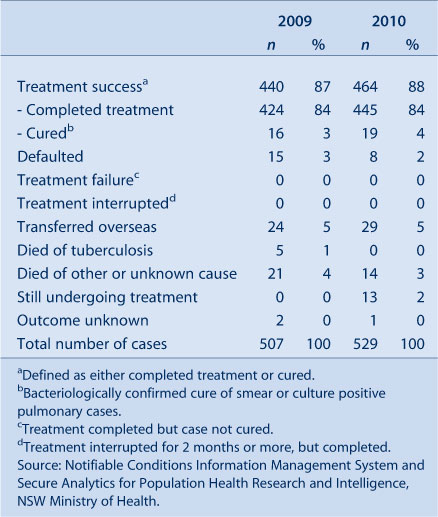
Known clinical outcome was recorded for 1033 cases in 2009 and 2010 (Table 4). A total of 87% (n = 904) of cases were successfully treated, consisting of 84% (n = 869) who completed treatment and 3% (n = 35) who were considered cured (culture positive prior to treatment and culture negative after completion of treatment). There were five TB-related deaths reported, all in 2009. Twenty-three cases (2%) defaulted from treatment; the remainder were either transferred overseas, died of a non-TB related cause, or were continuing on treatment at the time of analysis.
|
Drug resistance
Between 2009 and 2011 there were 20 cases of MDR-TB reported (including one case with XDR-TB). All but two cases of MDR-TB were overseas-born, including seven born in the Western Pacific Region and eight born in South-East Asia. Of the two Australian-born MDR-TB cases, one had travelled to a high-risk country for more than 3 months, while the other had travelled to several high-risk countries on multiple occasions but never for more than 3 months.
The proportion of cases with mono-resistance to rifampicin has remained stable at 1–2% of cases. However, the proportion of cases with mono-resistance to isoniazid has decreased from 9.3% of cases in 2009 to 5.3% of cases in 2011. This trend was found to be statistically significant when tested using the Chi-square test for trend (χ2 = 5.8, P = 0.02). However, when a longer period is observed (2007–2011) there is no statistically significant trend.
Risk factors
The most commonly identified risk factor for TB in notified cases between 2009 and 2011 was being born in a high-risk country, with 80% of all cases reporting this risk factor. Past residence of more than 3 months in a high-risk country was reported by 47% of all cases. Other reported risk factors are presented in Table 5.

|
There was variation in the reported risk factors between Australian- and overseas-born cases. In Australian-born cases, the most frequently reported risk factor was past residence of more than 3 months in a high-risk country (28% of Australian-born cases), followed by having a household member or close contact with TB (25% of Australian-born cases). Of overseas-born cases, 90% were born in a high-risk country and 50% had resided in a high-risk country for more than 3 months. Amongst cases born in a high-risk country, the median length of stay in Australia prior to onset of disease was 4 years (Inter-quartile Range 2–12 years).
Contact tracing
A total of 7338 contacts of TB cases were identified between 2009 and 2011. Of these, 6027 (82%) received contact screening. Of contacts screened, 48 (1%) were determined to have active TB disease. A further 186 (3%) contacts screened had a tuberculin skin test (TST) conversion. On initial TST screening, 33% of contacts who received screening were TST positive. Of contacts screened, 412 (7%) received prophylactic treatment. Further breakdown of contact screening data by year is presented in Table 6.

|
Discussion
Between 2003 and 2011 there was a small but steady increase in the number of notifications of TB in NSW. This increase is consistent with recent national trends8 and is an indicator of the need for continued TB control measures. As the majority of TB notifications in NSW are in persons who were born in or have lived in a country with a high incidence of TB, the epidemiology of TB notifications in NSW can be expected to broadly reflect global TB trends. The notification rate for TB continues to remain highest in the Sydney metropolitan area, particularly within Sydney’s inner city and western suburbs. This has previously been suggested to be a reflection of migrant settlement patterns within NSW.2 Between 2009 and 2011 there were 24 cases of TB reported in Aboriginal people in NSW; this is double the number of cases reported for the 3 years prior (2006–2008).2
Drug resistance is one of the most significant emerging issues in TB control globally.1 In NSW the proportion of MDR-TB cases continues to remain low (1.3%). This is lower than the national proportion of cases with MDR-TB in 2008 (2.4%).9 WHO estimates that 3.7% of new TB cases globally are MDR-TB.1 Despite the low proportion of cases with MDR-TB in NSW, the number of MDR-TB cases notified appears to be increasing. Between 2009 and 2011 the average annual number of MDR-TB cases was 6.7 per year, an increase from 3.8 cases per year between 2003 and 2007.4 Due to the small numbers of MDR-TB cases, it is difficult to be certain whether this is a true increase or natural variation.
The proportion of cases tested for HIV co-infection has increased from 54% of cases in 2008 to 70% of cases in 2011.2 Despite this increase NSW remains behind the national level of 81% of cases tested for HIV in 2009.8 Further work is needed to reach the national performance indicator of 100% of TB cases assessed for HIV. Despite increased testing, the proportion of cases with HIV co-infection remains low (3%). This is consistent with the proportion of HIV co-infected TB cases nationally.8
Conclusion
The effectiveness of TB control services in NSW is evidenced by low mortality from TB, the high proportion of cases successfully treated, minimal local transmission of TB and extensive screening of contacts. Incremental increases in the overall notification rate of TB in the last 8 years, an increase in the average annual number of MDR-TB cases and ongoing local transmission within sub-groups of the population highlight the need for continued vigilance in TB control.
Acknowledgments
The authors wish to acknowledge staff from the network of Chest Clinics and Public Health Units in NSW who collected the data. We also acknowledge Dr Vitali Sintchenko, Peter Jelfs and staff of the NSW Mycobacterium Reference Laboratory at the Institute for Clinical Pathology and Medical Research, Westmead Hospital.
References
[1] World Health Organization. Global tuberculosis report 2012. Geneva: World Health Organization; 2012.[2] Roberts-Witteveen AR, Christensen AJ, McAnulty JM. EpiReview: Tuberculosis in NSW, 2008. N S W Public Health Bull 2010; 21 174–82.
| EpiReview: Tuberculosis in NSW, 2008.Crossref | GoogleScholarGoogle Scholar | 20883656PubMed |
[3] Communicable Diseases Branch. GL2005_030 Tuberculosis prevention and control services: the role of chest clinics in NSW. Sydney: NSW Department of Health; 2005.
[4] O'Connor BA, Fritsche LL, Christensen AJ, McAnulty JM. EpiReview: Tuberculosis in NSW, 2003–2007. N S W Public Health Bull 2009; 20 59–68.
| EpiReview: Tuberculosis in NSW, 2003–2007.Crossref | GoogleScholarGoogle Scholar |
[5] World Health Organization. Global tuberculosis control 2011. Geneva: World Health Organization; 2011.
[6] National Tuberculosis Advisory Committee Multi-drug resistant tuberculosis. Commun Dis Intell 2007; 31 406–9.
[7] Australian Bureau of Statistics. Standard Australian Classification of Countries (SACC). Canberra: Australian Bureau of Statistics; 2011.
[8] Barry C, Waring J, Stapledon R, Konstantinos A. National Tuberculosis Advisory Committee, for the Communicable Diseases Network Australia. Tuberculosis notifications in Australia, 2008 and 2009. Commun Dis Intell 2012; 36 82–94.
[9] Lumb R, Bastian I, Carter R, Jelfs P, Keehner T, Sievers A. Tuberculosis in Australia: bacteriologically confirmed cases and drug resistance, 2008 and 2009. A report of the Australian Mycobacterium Reference Laboratory Network. Commun Dis Intell Q Rep 2011; 35 154–61.
| 22010508PubMed |