Exploring the measure of potentially avoidable general practitioner-type presentations to the emergency department in regional Queensland using linked, patient-perspective data
Mary O’Loughlin A D , Jane Mills
  B , Robyn McDermott A C and Linton R Harriss
  A
A
A Australian Institute of Tropical Health and Medicine, College of Public Health, Medical and Veterinary Sciences, James Cook University, PO Box 6811, Cairns, Qld 4870, Australia. Email: robyn.mcdermott@jcu.edu.au; linton.harriss@jcu.edu.au
B La Trobe Rural Health School, Bendigo Campus, Edwards Road, Flora Hill, Bendigo , Vic. 3552. Email: jane.mills@latrobe.edu.au
C School of Health Sciences, University of South Australia, GPO Box 2471, Adelaide, SA 5001, Australia.
D Corresponding author. Email: mary.oloughlin@my.jcu.edu.au
Australian Health Review - https://doi.org/10.1071/AH19210
Submitted: 13 September 2019 Accepted: 12 May 2020 Published online: 30 October 2020
Journal Compilation © AHHA 2020 Open Access CC BY-NC-ND
Abstract
Objective To explore measures of potentially avoidable general practitioner (PAGP)-type presentations to the emergency department (ED) of a large regional hospital in northern Queensland.
Methods Linkage of an ED administrative dataset to a face-to-face patient survey of local residents (n = 1000); calculation of Australian Institute of Health and Welfare (AIHW) and Australasian College of Emergency Medicine (ACEM) measures of PAGP-type presentations to the ED; and exploration of these measures with patient-perspective linked data.
Results PAGP-type presenters to the ED were younger in age (median age in years: total cohort: 49; AIHW 38, P < 0.001; ACEM 36, P < 0.001); with the odds of having a chronic condition being less likely for AIHW PAGP-type presenters than other ED presenters (OR (95% CI) 0.54 (0.38–0.77): P = 0.001)) after adjustment for age. PAGP-type presenters nominated reasons of convenience rather than urgency as their rationale for attending the ED, irrespective of measure. The number of PAGP-type presentations to the ED identified by the AIHW measure was more than three-fold higher than the ACEM measure (AIHW: n = 227; ACEM: n = 67). Influencing factors include the low proportion of ED attendees who had a medical consultation time of <1 h at this hospital site (1-month survey period: 17.8%); and differences between the patient self-report and ED administrative record for ‘self-referral to the ED’ (Self-referred: Survey 71% vs EDIS 93%, P < 0.001).
Conclusions Identification of PAGP-type presentations to the ED could be enhanced with improvements to the quality of administrative processes when recording patient ‘self-referral to the ED’, along with further consideration of hospital site variation for the length of medical consultation time.
What is known about the topic? PAGP-type presentations to the ED are an Australian National Healthcare Agreement progress indicator. Methods of measuring this indicator have been under review since 2012 and debate remains on how to accurately determine the measure.
What does this paper add? By using patient perspective-linked data to explore different measures of PAGP-type presentations to EDs, this paper identifies issues with measure elements and suggests ways to improve these measures.
What are the implications for practitioners? Measure elements of patient ‘self-referral to the ED’ and ‘medical consultation time’ require further consideration if they are to be used to measure PAGP-type presentations to the ED.
Introduction
Of interest to Australian health service providers and policymakers is the measure of potentially avoidable general practitioner (PAGP)-type presentations to the emergency department (ED). This indicator of health service effectiveness1 estimates the number of presentations to the ED that could have potentially been treated in primary care.2,3 In 2017–18, 2.9 million PAGP-type presentations were recorded in Australian public hospital EDs.4 Although not a measure of hospital performance, the number of PAGP-type presentations is used to indicate the accessibility and affordability of primary health care.3 Debate remains on how to accurately define PAGP-type presentations to the ED.5 This debate is particularly important to resolve in regional and remote areas for planning appropriate health service delivery. In these areas, the relative scarcity of diagnostic and primary care services generally results in public hospitals becoming the default provider,6 with subsequently higher rates of PAGP-type emergency presentations in regional and remote hospitals compared with hospitals in metropolitan areas.7
Australian Institute of Health and Welfare measure
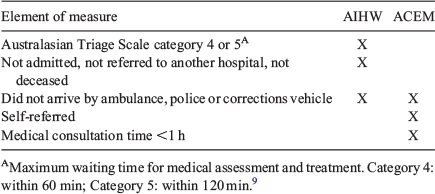
Methods of measuring PAGP-type presentations to the ED have been under review by the Australian Institute of Health and Welfare (AIHW) since 2012.8 After several years of reporting as an interim indicator, recent AIHW publications have chosen to exclude selected PAGP-type presentations due to limitations in the existing methodology.9,10 As a progress measure of the Australian public healthcare system, this indicator is currently described as needing significant work to improve accountability,1 with the main criticism being that the current AIHW measure (Table 1) overestimates the proportion of true PAGP-type presentations to the ED.11 One element of the AIHW’s measure is the Australasian Triage Scale category,12 and some authors have argued that it is a scale of perceived urgency, not complexity, and consequently is not useful to inform on PAGP-type presentations to the ED.5

|
Alternate measures
Alternate measures of PAGP-type presentations to the ED have been developed by others; for example, the Australasian College of Emergency Medicine (ACEM) measure (Table 1) is commonly used5 and may provide a more useful estimate of PAGP-type presentations in rural13 and metropolitan populations.11 However, a recent study found several models, including the ACEM measure, to be inaccurate in a specialised paediatric cohort.14 Other proposed measures include the Sprivulis method which uses discharge rates;15 and the Diagnosis method that relies on a list of defined diagnoses that are suitable for GP management.11 Although demonstrating general consistency with the ACEM approach,11 these other measures involve increased complexity and are challenging to use when compared with the AIHW and ACEM measures.
Study objectives
The study aimed to explore elements of the AIHW and ACEM measures of PAGP-type presentations to the ED and to inform on ways to improve these measures using person-perspective data linked to hospital administrative records.
Methods
Approvals
Far North Queensland Human Research Ethics Committee Research (FNQHREC) approval was obtained for The Patients’ Psychological and Practical Reasons for Attending the Cairns Hospital Emergency Department (P3ED) patient survey (HREC/14/QCH/9–887 LR). This approval included the requirement for informed consent to be obtained from survey participants for the completion of the questionnaire and to access their medical record. Additional ethics approvals were obtained from the FNQHREC for the Far North Queensland Hospital Avoidance Trial (FNQHAT) administrative Emergency Department Information System (EDIS) dataset (HREC/13/QCH/131–880); and for the linkage and analysis of the patient survey and administrative dataset (HREC/16/QCH/81–1068).
Study population and setting
The setting was a large, regional, public hospital in north Queensland over a 1-month period in 2014 (13 March to 11 April). Recruitment was undertaken in the ED 24 h per day, 7 days per week for the study period. Potential participants were identified by hospital staff as suitable for approach. Research assistants obtained informed consent and facilitated the face-to-face survey, which was undertaken using iPad tablets. The 28-question instrument explored factors associated with ED attendance. Analyses of this patient survey have been reported elsewhere.16
In the study period, 3229 individual adults (aged ≥18 years) attended the ED including international, inter-state and intra-state visitors. For this present study, only adults who agreed to participate in the survey and self-identified as residing locally were included in the data linkage (n = 1014). The exclusion of non-local people from the study was due to a high transient population in the region; with our research focus for PAGP-type presenters being local-dwelling individuals.
Data linkage
Responses from adults who completed the survey were linked to the EDIS dataset for a 2-year period (July 2012 to June 2014). Linkage was undertaken using Medical Record Numbers, with removal of those unable to be linked (n = 14). Datasets were merged using Stata 13.1 (Stata Corp, College Station, TX, USA). The final study sample for analysis comprises all local resident, adult survey respondents who were able to be linked to their own administrative data record (n = 1000).
Analysis
PAGP-type presentations to the ED were estimated using two approaches: the AIHW and ACEM measures (Table 1). Characteristics were independently compared between AIHW and non-AIHW PAGP-type presenters; and ACEM and non-ACEM PAGP-type presenters. Analyses were conducted using Pearson’s Chi-squared (χ2) statistic for categorical variables, with Fisher’s exact test used for small-sized cells (n < 5); and Wilcoxon rank-sum (Mann–Whitney U-test) for non-parametric variables.
The association between having a chronic condition and being an AIHW or ACEM PAGP-type presenter was explored using logistic regression. Odds ratios (ORs) with 95% confidence intervals (OR (95%CI)) were calculated using logistic regression to explore the association between having a chronic condition and each PAGP-type. Model 1 used univariate logistic regression with chronic condition as the independent variable and Model 2 used multivariate logistic regression with further adjustment for age, gender, Indigenous status, arrival out-of-hours and having a regular GP. Two-sided P values of <0.05 were regarded as significant. Model estimates of goodness-of-fit were calculated using the Hosmer–Lemeshow test, with Stata 13.1 being used for all analyses.
Results
Characteristics of PAGP-type presenters
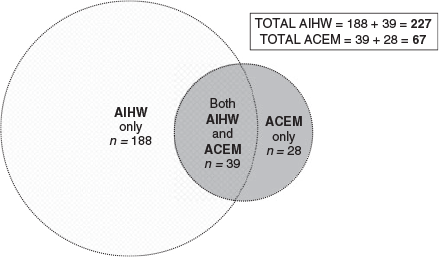
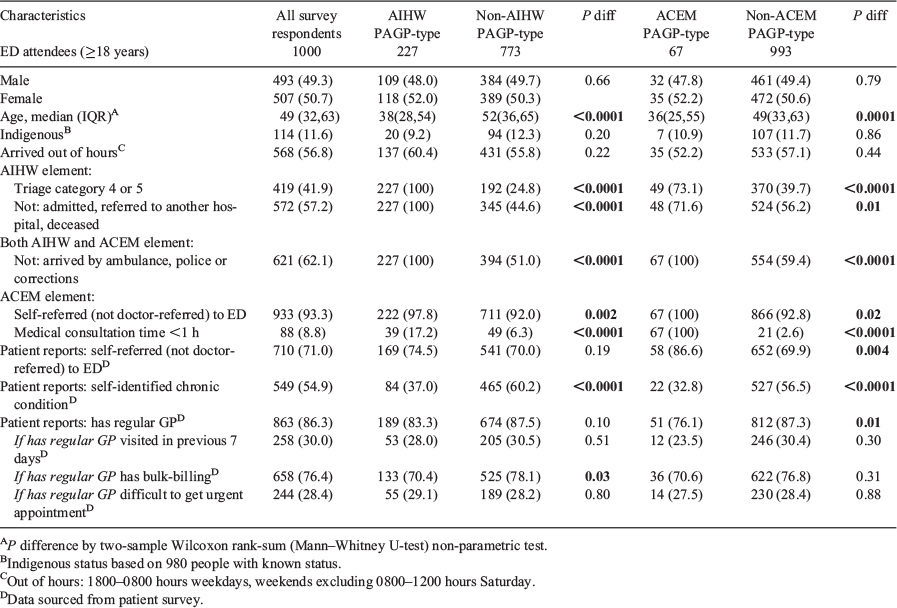
The AIHW measure classified significantly more PAGP-type presenters than the ACEM measure (n = 227 vs 67, χ2 = 51.6, d.f. = 1, P < 0.001), with 39 individuals being identified by both measures (Fig. 1, Table 2). Compared with all other survey respondents, both the AIHW and ACEM PAGP-type presenters were significantly younger (Mann–Whitney U-test: median age: AIHW 38 vs 52 years, z = 6.515, P < 0.001; ACEM 36 vs 49 years, z = 3.931, P = 0.001).

|
Comparison of existing measures of PAGP-type presentations to the ED
Nearly three-quarters of those identified by the ACEM measure had the mandatory AIHW elements ‘Australasian Triage Scale 4 or 5’ (n = 49, 73%) and ‘Not admitted, not referred to another hospital, not deceased’ (n = 48, 72%). Seventeen percent (n = 39) of those identified by the AIHW measure had the mandatory ACEM element ‘Medical consultation time less than 1 h’ (Table 2).
Comparison of EDIS and self-reported referral to the ED
EDIS records indicated that 93% (n = 933) of the cohort were self-referred to the ED, compared with only 71% (n = 710) of survey participants who reported that they were self-referred (χ2 = 21.332, d.f. = 1, P < 0.001) (Table 2).
Reasons PAGP-type presenters attend the ED
Survey respondents were asked to nominate their main reason for attending the ED. Across the study sample, the most common reason was that their problem was urgent, or that the ED was the best place for their problem (n = 320, 32%). Irrespective of measure, PAGP-type presenters were less likely to nominate this reason (AIHW: χ2 = 15.901, d.f. = 1, P < 0.0001; ACEM: χ2 = 5.237, d.f. = 1, P = 0.022). The second most common reason was the self-report of being sent to the ED by a doctor or specialist (n = 290, 29%), with ACEM PAGP-type presenters being less likely to identify this reason (ACEM: χ2 = 8.452, d.f. = 1, P = 0.004). When compared with the wider survey cohort, both measures of PAGP-type presenters nominated that they were more likely to attend the ED because: the service was open 24 h (AIHW: χ2 = 7.418, d.f. = 1, P = 0.006; ACEM: χ2 = 8.817, d.f. = 1, P = 0.003); and it was quicker than getting a GP appointment (AIHW: χ2 = 11.010, d.f. = 1, P = 0.001; ACEM: χ2 = 7.679, d.f. = 1, P = 0.006). AIHW PAGP-type presenters were more likely to attend the ED because services such as pathology and radiography were co-located (χ2 = 7.566, d.f. = 1, P = 0.006); whereas the convenient location of the ED increased the likelihood of ED attendance by ACEM PAGP-type presenters (χ2 = 6.705, d.f. = 1, P = 0.01) (Table 3).
Patient factors that influence PAGP-type presentation measures
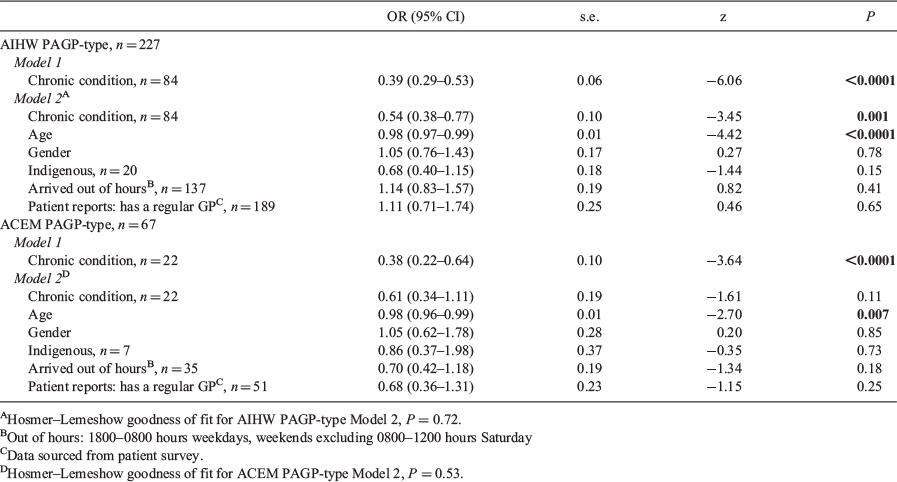
The odds of having a self-reported chronic condition was ~60% less for both AIHW and ACEM PAGP-type presentations than for other ED presentations (OR (95% CI)); AIHW: 0.39 (0.29–0.53: P < 0.001); ACEM: 0.38 (0.22–0.64: P < 0.001). After adjusting for age and other potential confounders, the association between chronic conditions and both PAGP-type presentations weakened slightly and lost statistical significance with the ACEM presentations, possibly due to a smaller sample size (AIHW: n = 227; ACEM: n = 67) (Table 4).
Multivariable analysis demonstrated a consistent, slight association between younger age and PAGP-type presentation across both measures (AIHW: 0.98 (0.97–0.99: P < 0.001); ACEM: 0.98 (0.96–0.99: P = 0.007)). Gender, Indigenous status, arrival to the ED out of hours and having a regular GP did not affect the likelihood of being an AIHW or ACEM PAGP-type presenter (Table 4).
Discussion
In our study, the AIHW measure identified more than three-times the number of PAGP-type presentations to the ED than the ACEM measure. Nearly three-quarters of those identified by the ACEM measure were consistent with the AIHW model elements of triage category (ACEM 73%) and non-admission/referral/deceased (ACEM 72%); the other AIHW model element of non-arrival by ambulance/police/corrections was common to both measures. The ACEM measure element of self-referral to the ED was consistent for those identified by the AIHW measure (AIHW 98%); however, there was a notable difference between a person’s self-report of being referred to the ED and their administrative data record. Having a medical consultation of <1 h in the ED, part of the ACEM measure, was not common for those identified by the AIHW measure (17%) (Table 2).
Consistent with previous studies, both AIHW and ACEM PAGP-type presenters were younger than other ED survey respondents.17 Irrespective of measure, PAGP-type presenters nominated reasons of convenience rather than urgency as their rationale for attending the ED (Table 3). Although over half of all survey respondents (n = 549, 55%) identified that they had one or more chronic conditions, AIHW PAGP-type presenters were less likely to have a chronic condition when influencing factors, such as age, were considered (Table 4).
Self-referral to the ED
Our study identified differences between the patient report of self-referral to the ED and the ED administrative dataset (Patient survey self-referred: 71% vs EDIS self-referred: 93%) (Table 2). Other patient perspective studies have identified a similar proportion of self-referrals to the ED as those reported in our study (~30% referred by healthcare practitioner).18,19 A notable strength of our study design was the data linkage that enabled a direct comparison between individual patient report and their own hospital record. Given that the ACEM measure of PAGP-type presentations and other proposed alternate measures, such as the Sprivulis and Diagnosis methods, use self-referral as a key data element,11 the difference between patient report and hospital record of ‘self-referral to the ED’ warrants further consideration.
The difference between patient report and their administrative record may indicate inadequacy in mechanisms to facilitate information sharing between health professionals, including primary care providers, to the ED. In addition to medical practitioners, participants in our study reported being referred to the ED by other health professionals such as a dentist or pharmacist (n = 22, 2.2%), the Australian Government’s 13HEALTH telephone advice service (n = 4, 0.4%); and other organisational requirements to attend an ED (n = 2, 0.2%) (Table 3). These referral pathways are consistent with other studies that have reported an even greater effect of non-medical (doctor or specialist) health professionals referring patients to the ED than found in our study.18,19
There is an opportunity for policymakers and service providers to enhance our understanding of health system functioning by identifying pathways taken by patients to attend the ED. Systems could be strengthened with improved mechanisms to record the patient’s nominated health professional who referred them to the ED; to establish routine recording of presentations that are an organisational requirement to attend the ED; and to develop a mechanism to link a person’s 13HEALTH consultation with their ED presentation. These approaches could provide the currently missing detail that helps to explain why people attend EDs.
Medical consultation time in the ED
In previous studies, the ACEM measure of PAGP-type presentations estimated approximately half the number of PAGP-type presentations as the AIHW measure,11,17 whereas in our study, it was less than one-third. An influencing factor is the small proportion of survey respondents who had a medical consultation time of <1 h (All survey respondents: n = 88, 8.8%) (Table 2). Additional analysis of the total ED cohort (n = 3229) for the month-long survey period demonstrated that 17.8% (n = 575) of the entire ED cohort had a medical consultation time <1 h (data not shown), indicating that this may be a characteristic of our hospital site.
A recent New South Wales study found an increased proportion of PAGP-type presentations to the ED for regional and remote centres when compared with major Australian cities, irrespective of the measure used (AIHW, ACEM or Sprivulis) or the length of consultation time used in the ACEM measure (15, 30, 60 or unlimited minutes).17 This previous study estimated that for inner-regional hospitals, ~30% of all presentations to the ED were PAGP-type, using the ACEM measure with a 1-h medical consultation time.17 Our study was conducted in a regional hospital setting with considerably longer medical consultation times in the ED, indicating variation between hospital sites. Accordingly, if the element of medical consultation time is to be used in the measure of PAGP-type presentations to the ED, then further consideration of hospital site variability is warranted.
Limitations
Our study was limited in several ways; the study sample was sourced from the ED waiting room; when compared with the wider ED cohort, earlier research indicated that this sample was typical for gender but slightly older in age;16 study respondents were more likely to have arrived by ambulance and to be discharged home;16 the patient survey was a piloted, but non-validated tool that had previously been used by health services;16 and our study involved one hospital and further investigation is indicated to inform on other sites.
Data inaccuracies within the EDIS dataset have been previously documented by Queensland Health20 and have the potential to bias study results, although this is likely to be non-differential misclassification. Ongoing efforts to improve ED administrative data quality are supported by the findings of this study.
Conclusion
Our study linked patient-reported experience from a face-to-face survey with an administrative EDIS dataset from a large regional emergency department in northern Queensland. Our main results demonstrated some consistency between the AIHW and ACEM measures of PAGP-type presentations, with the ACEM model element of length of medical consultation time in the ED being a notable exception. Further, the current recording of a patient’s ‘self-referral to the ED’ in the administrative dataset does not accurately reflect the actual person-reported experience. This finding, in addition to longer medical consultation times in our dataset, affected the measures of PAGP-type presentation to the ED. As such, we recommend improving clerical methods on the ground to record ‘self-referral to the ED’ and propose further consideration of the length of medical consultation time, to more accurately determine measures of PAGP-type presentations to the ED.
Competing interests
The authors declare they have no competing interests.
Acknowledgements
This present research was conducted with the support of the Australian Institute of Tropical Health and Medicine (AITHM), James Cook University, Australia and an Australian Government Research Training Program Scholarship; but did not receive any specific funding. The original P3ED study was funded by Far North Queensland Medicare Local and the Cairns and Hinterland Hospital and Health Service. The authors thank members of the original P3ED study team; members of the original FNQHAT study team; and patients and staff of the Cairns Hospital for their support of this project.
References
[1] Council of Australian Governments. National Healthcare Agreement: PI 19–Selected potentially avoidable GP-type presentations to emergency departments, 2018. Canberra: COAG; 2018.[2] National Health Performance Authority. Healthy Communities: potentially preventable hospitalisations in 2013–14. Sydney, Australia: National Health Performance Authority; 2015.
[3] Australian Institute of Health and Welfare. Australia’s health 2014. Australia’s health series no. 14. Canberra: AIHW; 2014.
[4] SCRGSP (Steering Committee for the Review of Government Service Provision). Report on Government Services 2019. Canberra: Productivity Commission, Commonwealth of Australia; 2019. Available at https://www.pc.gov.au/research/ongoing/report-on-government-services [Verified 9 September 2020]
[5] Nagree Y, Gosbell A, McCarthy S, Moore K, Mountain D. Determining the true burden of general practice patients in the emergency department: getting closer. Emerg Med Australas 2013; 25 487–90.
| Determining the true burden of general practice patients in the emergency department: getting closer.Crossref | GoogleScholarGoogle Scholar | 24308612PubMed |
[6] Standing Council on Health. National Strategic Framework for Rural and Remote Health. Canberra: Australian Government; 2011.
[7] Cheek C, Allen P, Shires L, Parry D, Ruigrok M. Low-acuity presentations to regional emergency departments: what is the issue? Emerg Med Australas 2016; 28 145–52.
| Low-acuity presentations to regional emergency departments: what is the issue?Crossref | GoogleScholarGoogle Scholar | 26708775PubMed |
[8] Australian Institute of Health and Welfare. Australian hospital statistics 2012–13: emergency department care. Canberra: AIHW; 2013.
[9] Australian Institute of Health and Welfare. Emergency department care 2016–17: Australian hospital statistics. Health services series no. 80. Cat. no. HSE 194. Canberra: AIHW; 2017.
[10] Australian Institute of Health and Welfare. Australia’s health 2018. Australia’s health series no. 16. AUS 221. Canberra: AIHW; 2018.
[11] Nagree Y, Camarda VJ, Fatovich DM, Cameeron PA. Quantifying the proportion of general practice and low-acuity patients in the emergency department. Med J Aust 2013; 198 612–15.
| Quantifying the proportion of general practice and low-acuity patients in the emergency department.Crossref | GoogleScholarGoogle Scholar | 23919709PubMed |
[12] Australasian College for Emergency Medicine. ACEM policy on the Australasian triage scale. Melbourne: Australasian College for Emergency Medicine.; 2013.
[13] Allen P, Cheek C, Foster S, Ruigrok M, Wilson D, Shires L. Low acuity and general practice-type presentations to emergency departments: a rural perspective. Emerg Med Australas 2015; 27 113–8.
| Low acuity and general practice-type presentations to emergency departments: a rural perspective.Crossref | GoogleScholarGoogle Scholar | 25720647PubMed |
[14] Borland M, Skarin D, Nagree Y. Comparison of methods used to quantify general practice-type patients in the emergency department: a tertiary paediatric perspective. Emerg Med Australas 2017; 29 77–82.
| Comparison of methods used to quantify general practice-type patients in the emergency department: a tertiary paediatric perspective.Crossref | GoogleScholarGoogle Scholar | 27681837PubMed |
[15] Sprivulis P. Estimation of the general practice workload of a metropolitan teaching hospital emergency department. Emerg Med 2003; 15 32–7.
| Estimation of the general practice workload of a metropolitan teaching hospital emergency department.Crossref | GoogleScholarGoogle Scholar |
[16] O’Loughlin M, Harriss L, Thompson F, McDermott R, Mills J. Exploring factors that influence adult presentation to an emergency department in regional Queensland: a linked, cross-sectional, patient perspective study. Emerg Med Australas 2019; 31 67–75.
| Exploring factors that influence adult presentation to an emergency department in regional Queensland: a linked, cross-sectional, patient perspective study.Crossref | GoogleScholarGoogle Scholar | 29851305PubMed |
[17] Stephens AS, Broome RA. Patterns of low acuity patient presentations to emergency departments in New South Wales, Australia. Emerg Med Australas 2017; 29 283–90.
| Patterns of low acuity patient presentations to emergency departments in New South Wales, Australia.Crossref | GoogleScholarGoogle Scholar | 28320067PubMed |
[18] Unwin M, Kinsman L, Rigby S. Why are we waiting? Patients’ perspectives for accessing emergency department services with non-urgent complaints. Int Emerg Nurs 2016; 29 3–8.
| Why are we waiting? Patients’ perspectives for accessing emergency department services with non-urgent complaints.Crossref | GoogleScholarGoogle Scholar | 27776980PubMed |
[19] FitzGerald G, Toloo G, Aitken P, Keijzers G, Scuffham P. Public use and perceptions of emergency departments: a population survey. Emerg Med Australas 2015; 27 336–42.
| Public use and perceptions of emergency departments: a population survey.Crossref | GoogleScholarGoogle Scholar | 26095210PubMed |
[20] Queensland Audit Office. Emergency department performance reporting. Report 3: 2014–15. Brisbane, Qld: The State of Queensland; 2014.


