

Prevalence and characteristics of potentially avoidable unplanned readmissions: a retrospective cohort study
Yogesh Sharma A B * , Arduino A. Mangoni B , Sudhir Rao A , Isuru Kariyawasam Batuwaththagamage A , Billingsley Kaambwa B , Richard Woodman B , Chris Horwood A and Campbell Thompson C
A
B
C
Abstract
Unplanned readmissions are key indicators of hospital care quality, yet research on potentially avoidable unplanned readmissions (PAURs) remains limited. This study aimed to assess the prevalence, causes, and predictors of PAURs in an Australian tertiary hospital.
This retrospective cohort study included all unplanned readmissions to a general medicine unit between 1 July and 30 September 2022, in South Australia. Patients aged ≥18 years readmitted within 30 days of discharge were included. A panel of senior clinicians assessed the preventability of each readmission using predefined criteria. Data on demographics, comorbidities, frailty, inflammatory markers, and discharge factors were collected. Predictors of PAURs were examined using multivariable logistic regression and LASSO (least absolute shrinkage and selection operator) regression for sensitivity analysis.
Among 381 readmissions, 80 (21%) were classified as potentially avoidable. The mean age was 68.7 years (s.d. 18.2), and 58.3% were female. The most common cause of PAURs was relapse of the condition treated during the index admission (43%), followed by treatment-related complications (22.8%). Contributing factors included suboptimal care during the index admission (43.8%) and inadequate post-discharge follow-up (30%). Compared to non-avoidable readmissions, PAUR patients were older, more frequently readmitted within 7 days, and had higher rates of coronary artery disease and congestive heart failure (CHF). They also had higher neutrophil-to-lymphocyte ratios (NLR) on admission. Multivariable analysis identified CHF (aOR 2.46, 95% CI 1.28–4.71) and elevated NLR (aOR 1.05, 95% CI 1.02–1.08) as independent predictors.
Over one in five readmissions were potentially avoidable, and only a few patient characteristics can predict avoidable readmissions.
Keywords: congestive heart failure, discharge planning, discharge summary quality, health service quality, post-discharge follow-up, potentially avoidable readmissions, readmission predictors, unplanned hospital readmission.
Introduction
Unplanned hospital readmission rates are used to assess the quality of hospital care because they are costly and some may be avoidable. Each year 18.2% of patients are readmitted in US hospitals, with an estimated cost of between US$15 and 17 billion.1,2 Similar figures (18%) have been reported in an Australian study3 investigating readmissions within 30 days across all major hospitals in Adelaide, South Australia, between 2012 and 2016. The total annual cost of unplanned hospital readmissions in Australia was estimated at A$1.5 billion in the 2010–2011 period.4
The main issue in using unplanned readmissions as a quality indicator is the lack of a proper definition of avoidability because not all hospital readmissions may be avoidable. Emerging evidence suggests that medical readmissions may result from natural disease progression, decompensation of associated comorbidities, or socio-economic and environmental factors that are usually beyond the control of hospital teams and not solely the result of inadequate hospital care.5–8 Additionally, research so far has not been able to determine uniform factors that could be related to potentially avoidable unplanned readmissions (PAURs).9 Previous studies1,10 in the US and Europe have reported a wide variability (5–79%) in terms of the prevalence of PAURs. While several Australian studies have examined factors contributing to PAURs in specific patient populations, the extent and characteristics of avoidable readmissions in general medical patients remain underexplored.11–13
One way forward is to identify the avoidability of a readmission by using a measure that identifies those readmissions that are directly influenced by hospital-related factors such as physicians’ decision-making, procedures occurring during inpatient care, and discharge planning processes.2,14 The factors that distinguish an avoidable from an unavoidable readmission and the consequences of that readmission in terms of patient outcomes are all important but under-explored areas of clinical research. Therefore, we sought to determine what proportion of 30-day medical readmissions at a major Australian metropolitan hospital were avoidable and to determine the predictors of PAURs.
Methods
This was a retrospective cohort study with a structured case review conducted at a tertiary teaching hospital in South Australia serving a population of 340,000 residents in the metropolitan region. The study aimed to estimate the prevalence of PAURs and identify associated patient and clinical factors.
We obtained data on all general medical patients who were discharged alive and readmitted within 30 days between 1 July 2022 and 30 June 2023 from a central computer database.
Inclusion and exclusion criteria
The inclusion criteria were all adult (≥18 years) unplanned admissions within 30 days of discharge from an earlier index admission (IA). If a patient had multiple readmissions, then only the first readmission was included. Patients were also excluded if they were transferred to another hospital during their IA or if they left hospital against medical advice.
Data collection and variable definitions
Readmissions to all public hospitals in South Australia were captured, as 10–15% of patients may be readmitted to non-index hospitals.3 We recorded demographic data from electronic medical records. The number of comorbidities was assessed using the Charlson comorbidity index (CCI).15 The socioeconomic status was determined using the index of relative socio-economic disadvantage (IRSD).16 The frailty status was determined using the Hospital Frailty Risk Score (HFRS), and patients with a HFRS ≥5 were classified as frail.17 Nutrition status was determined using the Malnutrition Universal Screening Tool (MUST), and patients with a MUST score >1 were classified as malnourished.18 The number of usual medications at the time of admission was recorded, and polypharmacy was defined as the use of five or more medications. We also collected data on routine laboratory tests during IA, including admission haemoglobin, white cell count, neutrophil count, lymphocyte count, platelet count, creatinine, albumin, and C-reactive protein (CRP). The neutrophil-to-lymphocyte ratio (NLR), an inflammatory haematological index increasingly recognised as a predictor of adverse clinical outcomes,19,20 was determined by dividing the absolute neutrophil count by the absolute lymphocyte count at admission.
HOSPITAL score
The HOSPITAL score was calculated for each hospital discharge using seven variables: last available Haemoglobin before discharge (positive if <120 g/L), discharge from an Oncology service, last available Sodium concentrations (positive if <135 mmol/L), any ICD-10 AM (International Statistical Classification of Diseases and Related Health Problems, Tenth Revision, Australian Modification) coded procedure performed during hospitalisation, IA type (emergent or urgent vs elective), number of admissions in the previous 12 months, and Length of stay (LOS, positive if ≥5 days).21 The HOSPITAL score ranges from 0 to a maximum of 13 points, with higher scores associated with a greater risk of 30-day PAURs.22 The risk categories were defined as low (0–4), intermediate (5–6), and high (≥7).
LACE index
The LACE index23 was determined from the following variables: LOS, Acute or urgent admission, CCI, and emergency department visits in the previous 6 months and can be used to quantify the risk of death or unplanned readmission within 30 days of hospital discharge. The LACE index can range from 0 to 19, and a score of ≥10 has been shown to indicate a high risk of readmission (expected probability of readmission of 12.2–47%) as per previous research.24
Ethics
This study was deemed exempt from ethical approval by the Southern Adelaide Human Clinical Research Ethics Committee (SAH REC).
Determination of avoidability of a readmission
All readmitted patients over the 3 months from 1 July to 30 September 2022 were assessed for avoidability by two senior consultant physicians. The physicians independently reviewed the IA and readmission by thoroughly examining the electronic medical records of each patient. In case of disagreement regarding the classification of a readmission as a PAUR, a third physician independently reviewed the records to resolve the discordance. The inter-rater reliability of the classification of the two reviewers was determined using the Cohen’s kappa.
A readmission was defined as a PAUR if two conditions were fulfilled (Fig. 1) according to previously published literature.2
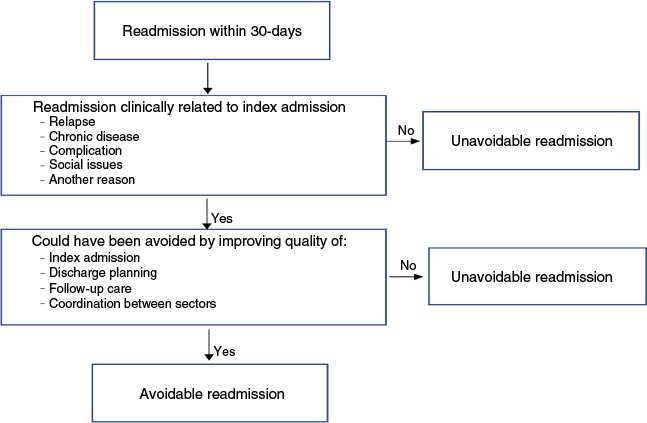
The readmission was clinically related to the IA. This was specified in five categories: (a) a relapse of a condition treated during the IA; (b) a decompensation of chronic disease caused by a condition treated during the IA; (c) a complication of a disease/treatment received during the IA; (d) a social issue which could have been foreseen during the IA; and (e) any other clinical relation to the IA (e.g. need of surgical intervention)
Statistical analysis
Summary descriptive statistics were generated for clinical and demographic characteristics and compared between potentially avoidable and non-avoidable unplanned readmissions. Continuous variables were assessed for normality using the Shapiro–Wilk test and then assessed for differences between groups using either an independent t-test or the rank sum test as appropriate. Categorical variables were compared using the chi-squared statistics or the Fisher’s exact test. Univariate logistic regression was used to identify potential factors associated with PAURs with variables significant at P ≤ 0.25 considered for inclusion in a backwards stepwise multivariate logistic regression model, and variables significant at P < 0.05 were retained in the final model. To account for multiple testing in the multivariable model, we applied a Bonferroni correction. Given that 14 predictors were included, the adjusted significance threshold was set at P < 0.0036 (0.05/14). This correction was used to determine statistical significance in the context of multiple comparisons.
Model discrimination was assessed using the area under the receiver operating characteristic curve. The predictive ability of the model was determined using the Brier score (Brier score <0.25 indicating good prediction).25 As a sensitivity analysis, we also performed regularised logistic regression using a LASSO (least absolute shrinkage and selection operator) model26 as an alternative method of variable selection to stepwise regression. To assess the robustness of the observed associations to unobserved confounding, we calculated the E-values27 to estimate the magnitude of confounding required to overcome the observed associations. All tests were two-sided, and a P-value <0.05 was regarded as statistically significant. All statistical analyses were performed using STATA software version 18.0 and Python 3.10.8, utilising the scikit-learn library version 1.5.1 for machine learning and data analysis.
Results
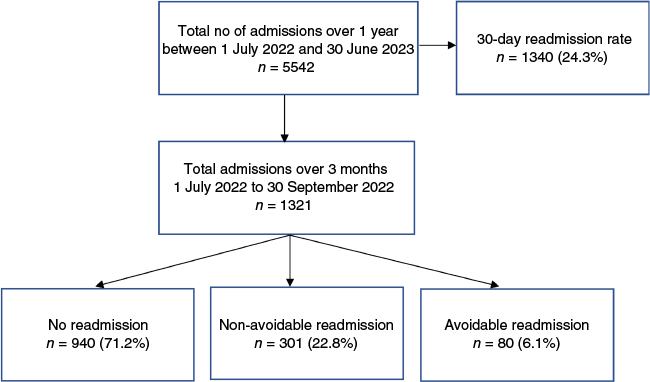
Between 1 July and 30 September 2022, 381 patients discharged from general medicine were readmitted within 30 days (Fig. 2). Of these, 80 (21%) were identified as PAURs. The study cohort included adults aged 19–98 years, with a mean age of 68.7 years (s.d. 18.2). Over half the cohort (58.3%) were female.
Avoidable unplanned readmissions
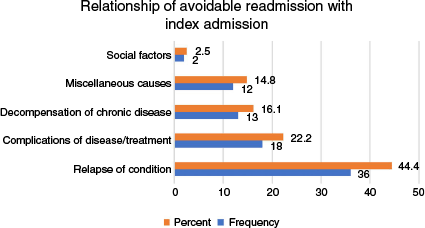
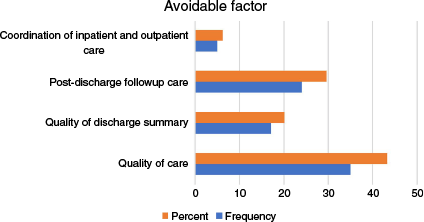
The most common reason for a PAUR was a relapse of the condition treated during the IA, which accounted for 44.4% of cases. This was followed by complications related to the disease or its treatment, observed in 22.2% patients (Fig. 3). The most frequent avoidable factor was the quality of care received during the IA in 43.8% of cases, followed by issues with post-discharge follow-up care in 30% cases (Fig. 4). The inter-rater reliability for the classification of readmission showed substantial agreement (k = 0.76, 95% confidence interval (CI) 0.63–0.85, P < 0.001).
Comparison between avoidable and non-avoidable unplanned readmissions
Table 1 compares the characteristics of patients with potentially avoidable and non-avoidable unplanned readmissions. Patients with a PAUR were significantly older, more likely to be readmitted within a week of discharge, and had a higher prevalence of coronary artery disease (CAD) and congestive heart failure (CHF) compared to those who had a non-avoidable readmission (P < 0.05). Additionally, patients with a PAUR had significant elevations in inflammatory markers, including neutrophil count, CRP, and NLR during their IA, and lower platelet counts and albumin levels (P < 0.05) when compared to those who had a non-avoidable unplanned readmission. There were no significant differences in the HOSPITAL score, the LACE index, or other characteristics between the two groups (P > 0.05) (Tables 1, 2).
| Variable | Non-avoidable readmission | Avoidable readmission | P-value | |
|---|---|---|---|---|
| No (%) | 301 (79) | 80 (21) | ||
| Age years, mean (s.d.) (95% CI) | 67.6 (19.1) (65.4–69.7) | 73.3 (12.9) (70.4–76.2) | 0.012 | |
| Age years, median (IQR) (95% CI) | 73 (58, 82) (69.0–74.0) | 76 (66.5, 82) (74.0–79.3) | 0.03 | |
| Age group (years) n (%) (95% CI) | 0.039 | |||
| <40 | 35 (11.6) (8.2–15.8) | 1 (1.3) (0.0–6.8) | ||
| 40–59 | 44 (14.6) (10.8–19.9) | 13 (16.3) (8.9–26.2) | ||
| 60–79 | 127 (42.2) (36.5–48.0) | 35 (43.8) (32.7–55.3) | ||
| >80 | 95 (31.6) (26.3–37.1) | 31 (38.8) (28.1–50.3) | ||
| Sex male n (%) (95% CI) | 126 (41.9) (36.2–47.7) | 33 (41.3) (30.4–52.8) | 1.00 | |
| Race Indigenous n (%) (95% CI) | 4 (1.3) (0.3–3.5) | 1 (1.2) (0.03–6.8) | 0.992 | |
| Usual residence home n (%) (95% CI) | 249 (83.3) (78.6–87.3) | 72 (90.0) (81.2–95.6) | 0.323 | |
| Charlson index mean (s.d.) (95% CI) | 2.7 (3.4) (2.3–3.1) | 2.2 (2.6) (1.6–2.7) | 0.156 | |
| HFRS mean (s.d.) (95% CI) | 5.5 (4.6) (4.9–6.0) | 5.8 (4.2) (4.8–6.8) | 0.568 | |
| Frail n (%) (95% CI) | 115 (44.9) (38.7–51.2) | 32 (46.4) (34.3–58.5) | 0.829 | |
| MUST score mean (s.d.) (95% CI) | 0.6 (1.1) (0.41–0.83) | 0.5 (0.8) (0.19–0.80) | 0.538 | |
| Malnourished n (%) (95% CI) | 30 (32.9) (23.4–43.6) | 10 (33.3) (17.9–52.8) | 0.970 | |
| LOS median (IQR) (95% CI) | 3 (1.9, 5.2) (2.8–3.5) | 3.7 (1.9, 6.2) (2.5–4.9) | 0.413 | |
| IRSD median (IQR) (95% CI) | 986 (961, 1041) (978–986) | 985 (948, 1041) (977–1002) | 0.945 | |
| IRSD lowest quintile n (%) (95% CI) | 66 (22.0) (17–27) | 20 (25.0) (15–25) | 0.716 | |
| ED visits previous 6 months mean (s.d.) (95% CI) | 3.4 (4.5) (2.9–3.9) | 2.8 (3.2) (2.0–3.4) | 0.210 | |
| Hospital admissions previous 1 year mean (s.d.) (95% CI) | 2.8 (3.4) (2.3–3.1) | 2.2 (2.6) (1.6–2.7) | 0.156 | |
| No of days to next admission mean (s.d.) (95% CI) | 12.2 (8.1) (11.2–13.1) | 9.8 (0.9) (7.9–11.6) | 0.021 | |
| Readmitted within 7 days of discharge n (%) (95% CI) | 108 (35.9) (30–41) | 40 (50.0%) (38–61) | 0.021 | |
| Chronic lung disease n (%) (95% CI) | 87 (28.9) (23.8–34.3) | 29 (36.3) (25.7–47.7) | 0.204 | |
| CAD n (%) (95% CI) | 23 (7.6) (0.4–11.2) | 12 (15.0) (8.0–24.7) | 0.043 | |
| Diabetes n (%) (95% CI) | 97 (32.2) (26.9–37.8) | 30 (37.5) (26.9–49.0) | 0.374 | |
| Hypertension n (%) (95% CI) | 37 (12.3) (8.8–16.5) | 10 (12.5) (6.1–21.7) | 0.960 | |
| CHF n (%) (95% CI) | 79 (26.3) (21.3–31.6) | 34 (42.5) (31.5–54.0) | <0.005 | |
| CKD n (%) (95% CI) | 41 (13.6) (9.9–18.0) | 13 (16.3) (8.9–26.1) | 0.549 | |
| Cancer n (%) (95% CI) | 51 (16.9) (12.8–21.6) | 10 (12.5) (6.1–21.7) | 0.335 | |
| Smoking n (%) (95% CI) | 38 (12.6) (9.0–6.9) | 9 (11.3) (5.2–20.2) | 0.850 | |
| Alcohol abuse n (%) (95% CI) | 66 (21.9) (17.3–27.0) | 10 (12.5) (6.1–21.7) | <0.080 | |
| Discharged over the weekend n (%) (95% CI) | 51 (17.0) (12.8–21.7) | 18 (22.5) (13.9–33.2) | 0.257 | |
| Discharged after hours n (%) (95% CI) | 43 (14.3) (10.5–18.7) | 11 (13.8) (7.0–23.2) | 0.903 | |
| Haemoglobin at discharge mean (s.d.) (95% CI) | 117.8 (18.1) (115.8–119.9) | 118.4 (17.0) (114.5–122.2) | <0.840 | |
| Sodium at discharge mean (s.d.) (95% CI) | 138.0 (4.2) (137.5–138.5) | 137.8 (3.9) (136.9–138.7) | 0.721 | |
| CRP median (IQR) (95% CI) | 12.9 (2.3, 41.2) (9.6–16.4) | 20.4 (6.5, 102.8) (11.6–37.5) | 0.010 | |
| Creatinine mean (s.d.) (95% CI) | 88.8 (59.7) (82.1–95.6) | 105.6 (76.1) (88.6–122.6) | 0.037 | |
| Albumin mean (s.d.) (95% CI) | 32.5 (5.8) (31.8–33.2) | 30.9 (5.2) (29.7–32.1) | <0.028 | |
| Polypharmacy n (%) (95% CI) | 196 (65.3) (59.4–70.4) | 48 (60.0) (48.4–70.7) | 0.377 | |
| WBC count mean (s.d.) (95% CI) | 9.2 (4.7) (8.6–9.7) | 10.1 (4.3) (9.2–11.1) | 0.090 | |
| Neutrophil count mean (s.d.) (95% CI) | 70.4 (13.9) (68.8–71.9) | 77.5 (11.6) (74.8–80.1) | <0.001 | |
| Platelet count mean (s.d.) (95% CI) | 256.6 (114.7) (243.4–269.7) | 219.2 (92.0) (199.3–240.5) | 0.009 | |
| NLR, mean (s.d.) (95% CI) | 7.2 (8.8) (6.2–8.2) | 12.1 (13.8) (9.0–15.2) | <0.001 | |
| LACE index mean (s.d.) (95% CI) | 10.4 (2.9) (10.1–10.7) | 10.6 (3.1) (9.9–11.3) | 0.646 | |
| High risk LACE (≥10) n (%) (95% CI) | 181 (60.5) (54.7–66.1) | 49 (61.3) (49.6–71.9) | 0.907 | |
| HOSPITAL score mean (s.d.) (95% CI) | 5.0 (2.3) (4.7–5.3) | 5.0 (2.4) (4.5–5.6) | 0.986 | |
| High risk HOSPITAL (≥7), n (%) (95% CI) | 86 (28.7) (23.5–34.0) | 20 (25.0) (15.9–35.9) | 0.516 |
s.d., standard deviation; CI, confidence interval; IQR, interquartile range; HFRS, Hospital Frailty Risk Score; MUST, Malnutrition Universal Screening Tool; LOS, length of hospital stay; IRSD, index of relative socio-economic disadvantage; ED, emergency department; CAD, coronary artery disease; CHF, congestive heart failure; CKD, chronic kidney disease; CRP, C-reactive protein; WBC, white blood cell; NLR, neutrophil-lymphocyte ratio; LACE determined from the following variables: LOS, Acute or urgent admission, CCI and emergency department visits in the previous 6 months; HOSPITAL, determined from the following variables (last available Haemoglobin before discharge (positive if <120 g/L), discharge from Oncology service, last available Sodium levels (positive if <135 mmol/L), any ICD-10 AM coded procedure performed during hospitalisation, Index admission type (emergent or urgent vs elective), number of Admissions in the previous 12 months, and LOS (positive if ≥5 days).
| Variable | ORs | 95% CI interval | P-value | |
|---|---|---|---|---|
| Age per year | 1.06 | 1.03–1.09 | <0.001 | |
| Sex male vs female | 0.97 | 0.59–1.60 | 0.922 | |
| Ethnicity, Indigenous vs non-Indigenous | 0.92 | 0.10–8.43 | 0.948 | |
| Home vs nursing home | 1.62 | 0.65–4.00 | 0.294 | |
| Charlson index | 0.99 | 0.89–1.10 | 0.902 | |
| HFRS | 1.12 | 0.82–1.53 | 0.448 | |
| Frail vs non-frail | 1.06 | 0.62–1.80 | 0.829 | |
| MUST score mean (s.d.) | 0.27 | 0.04–1.64 | 0.158 | |
| Malnourished vs nourished | 1.02 | 0.42–2.44 | 0.970 | |
| LOS index admission | 0.96 | 0.86–1.08 | 0.514 | |
| IRSD | 1.00 | 0.99–1.01 | 0.573 | |
| IRSD highest quintile vs lowest quintile | 1.21 | 0.55–2.68 | 0.628 | |
| ED visits previous 6 months | 1.31 | 0.73–2.35 | 0.354 | |
| Hospital admissions previous 1 year | 0.87 | 0.51–1.48 | 0.624 | |
| No of days to next admission | 0.80 | 0.74–0.86 | <0.001 | |
| Readmitted within 7 days of discharge vs not readmitted | 1.78 | 1.08–2.93 | 0.022 | |
| Chronic lung disease | 1.39 | 0.83–2.35 | 0.206 | |
| CAD | 2.13 | 1.01–4.50 | 0.047 | |
| Diabetes | 1.26 | 0.75–2.10 | 0.374 | |
| Hypertension | 1.01 | 0.48–1.15 | 0.960 | |
| CHF | 2.07 | 1.24–3.46 | 0.005 | |
| CKD | 1.23 | 0.62–2.42 | 0.550 | |
| Cancer | 0.70 | 0.33–1.44 | 0.337 | |
| Smoking | 0.87 | 0.40–1.89 | 0.7400 | |
| Alcohol abuse | 0.50 | 0.24–1.04 | 0.064 | |
| Discharged over the weekend | 0.70 | 0.38–1.29 | 0.258 | |
| Discharged after hours | 0.95 | 0.46–1.95 | 0.903 | |
| Haemoglobin at discharge | 1.23 | 0.24–6.16 | 0.797 | |
| Sodium at discharge | 0.99 | 0.93–1.05 | 0.720 | |
| CRP | 1.22 | 1.05–1.42 | 0.007 | |
| Creatinine | 1.77 | 1.11–2.83 | <0.016 | |
| Albumin | 0.95 | 0.91–0.99 | 0.030 | |
| Polypharmacy | 0.79 | 0.47–1.32 | 0.377 | |
| WBC count (s.d.) | 1.88 | 1.06–3.32 | 0.030 | |
| Neutrophil count | 20.27 | 4.21–98.41 | <0.001 | |
| Platelet count | 0.56 | 0.34–0.92 | 0.024 | |
| NLR | 1.04 | 1.02–1.06 | 0.001 | |
| LACE index | 1.16 | 0.51–2.63 | 0.709 | |
| High risk LACE (≥10) n (%) | 1.03 | 0.62–1.70 | 0.907 | |
| HOSPITAL score | 0.99 | 0.89–1.10 | 0.986 | |
| High risk HOSPITAL category (≥7) | 0.89 | 0.48–1.63 | 0.713 |
OR, odds ratio; CI, confidence interval; HFRS, Hospital Frailty Risk Score; MUST, Malnutrition Universal Screening Tool; LOS, length of hospital stay; IRSD, index of relative socio-economic disadvantage; ED, emergency department; CAD, coronary artery disease; CHF, congestive heart failure; CKD, chronic kidney disease; CRP, C-reactive protein; WBC, white blood cell; NLR, neutrophil-lymphocyte ratio; LACE determined from the following variables: LOS, Acute or urgent admission, CCI and emergency department visits in the previous 6 months; HOSPITAL, determined from the following variables (last available Haemoglobin before discharge (positive if <120 g/L), discharge from Oncology service, last available Sodium levels (positive if <135 mmol/L), any ICD-10 AM coded procedure performed during hospitalisation, Index admission type (emergent or urgent vs elective), number of Admissions in the previous 12 months, and LOS (positive if ≥5 days).
Multivariable logistic regression
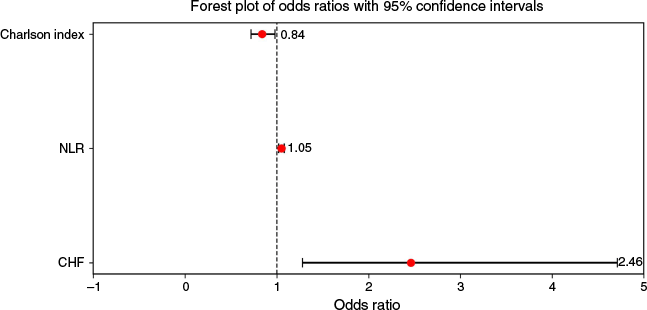
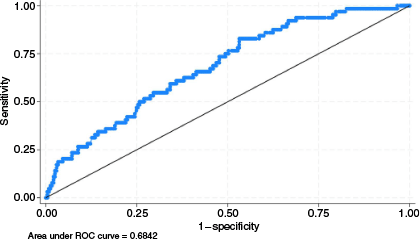
In multivariable logistic regression, after applying the Bonferroni correction, CHF (adjusted odds ratio (aOR) 2.46, 95% CI 1.28–4.71, P = 0.002), a high NLR on admission (aOR 1.05, 95% CI 1.02–1.08, P < 0.001), and a low CCI (aOR 0.84, 95% CI 0.72–0.98, P = 0.001) were independently associated with PAURs (Table 3 and Fig. 5). The model demonstrated modest discriminative ability with an area under the curve of 0.68 (95% CI 0.62–0.75) (Fig. 6) and a Brier score of 0.15, indicative of accurate prediction. In sensitivity analysis, the LASSO regression identified only CHF and NLR as being significantly associated with PAURs.
| Variable | aORs | 95% CI interval | P-value | |
|---|---|---|---|---|
| Congestive heart failure | 2.46 | 1.28–4.71 | 0.002 | |
| NLR | 1.05 | 1.02–1.08 | <0.001 | |
| Charlson index | 0.84 | 0.72–0.98 | 0.001 |
aOR, adjusted odds ratio; CI confidence interval; NLR, neutrophil-lymphocyte ratio.
E-value
The calculated E-value was 1.54 for CHF (1.17 for lower 95% CI) and 1.09 for NLR (1.03 for lower 95% CI), suggesting that unmeasured binary confounding variables with effects at least this large would be required to completely remove the observed association between these variables and PAURs.
Discussion
We observed that 24.3% of medical patients in a South Australian metropolitan hospital had an unplanned readmission within 30 days of discharge, of which 21% were classified as PAURs. Although several demographic and clinical factors were evaluated, few strong predictors were identified, highlighting the complexity of readmission risk.
The most common reason for a PAUR was a relapse of a condition treated during the IA. The most common avoidable factor was a deficiency in the quality of care received during the IA. Patients with a PAUR were significantly older, with CAD and CHF, and had significantly higher inflammatory indices during their IA when compared to those without an avoidable readmission. Only a few predictors, namely a history of CHF, high NLR on admission, and a lower CCI, were independently associated with PAURs.
Previous studies have shown variable PAUR rates (5–79%), and a systematic review of 34 studies reported a median rate of 27.1%.28 A Dutch study29 investigating 455 medical readmissions reported that 28.5% were PAURs. This study also found significant discrepancies when classifying readmissions based on a review of medical records compared to using administrative data (28.5% vs 44.1%), with only a slight agreement between the two methods (k = 0.08, 95% CI 0.02–0.15, P < 0.05). This indicates that there remain potential difficulties in identifying PAURs, which can vary depending on the criteria used to define avoidability. Although inter-rater reliability for avoidability assessment in this study was good (k = 0.76), it is important to acknowledge that classification of readmissions as avoidable remains partly subjective. Previous studies have shown that judgments about avoidability can vary significantly between reviewers, sometimes being described as ‘in the eye of the beholder’.30,31 This underscores the need for standardised criteria and multi-reviewer consensus to enhance consistency in such evaluations.
In our study, the most common reason for PAURs was the relapse of a disease treated during the IA, and the most common avoidable factor was a deficiency in the quality of care received during the IA, including issues pertaining to post-discharge follow-up care. These findings are in line with a US study of 1000 general medical patients readmitted within 30 days, reporting that premature discharge (aOR 3.88, 95% CI 2.44–6.17) and failure to communicate information to outpatient care professionals (aOR 4.19, 95% CI 2.17–8.09) were strongly associated with PAURs. Premature discharge is a growing concern, often driven by increasing demand for hospital beds and targets aimed at reducing LOS.32 Such pressures can inadvertently heighten the risk of readmission.33 Additionally, poor quality of discharge summaries and delays in communicating follow-up care to patients’ general practitioners have been identified as significant risk factors for PAURs.34,35 These issues highlight the importance of effective discharge planning and communication to minimise the likelihood of readmission and ensure continuity of care.
Our study found a limited number of predictors for PAURs, which might limit the capacity to accurately identify cohorts for targeted interventions. A history of CHF and a higher NLR were found to be significantly associated with PAURs, however, the number of comorbidities as assessed by CCI was not associated with the studied endpoint. These results align with another study1 of 1120 readmissions of which 11% were potentially avoidable, which reported that the CCI was not associated with PPRs. However, unlike our study, increasing age, higher socioeconomic status, fewer prior hospitalisations, and no outpatient visit prior to readmission were more likely to be associated with PAURs. These results highlight that predictors of PAURs are not uniform and may vary in different countries with different healthcare systems. However, similar to our study, earlier readmissions (within a week of discharge) were more likely avoidable than late readmissions (54% vs 44%, P = 0.03).
Readmissions are a complex phenomenon that is influenced not only by medical factors but also by social and political drivers.36 Predicting a PAUR is even more difficult because of the lack of consensus on the definition of ‘avoidability’. A Dutch study37 that surveyed senior physicians to determine potentially avoidable readmissions by presenting case scenarios found only moderate agreement among physicians about the predictability of readmissions (intraclass correlation coefficient (ICC) = 0.67) but poor agreement about avoidability (ICC = 0.13). This indicates that even senior clinicians struggle to determine whether a readmission is avoidable, which raises questions regarding the appropriateness of including readmissions as a robust quality metric of hospitals’ performance. These findings are, however, in contrast to our study, which reported a good inter-rater agreement regarding PAURs. It is important to note that Australia defines unplanned readmissions based on a 30-day window, whereas some other countries use slightly different periods (e.g. 28 or 31 days). These differences in measurement windows should be considered when comparing prevalence and outcomes across studies internationally.38,39
Implications for practitioners
While improving discharge summaries is one important strategy, previous research has highlighted the broader need for a multifaceted approach to reduce PAURs. Future studies and quality improvement initiatives should consider assessing patient and family readiness for discharge, the availability and coordination of community and post-discharge support, the timing of discharge, and the use of patient education strategies such as teach-back methods.40–42 Integrating these elements into routine discharge planning may help address modifiable factors contributing to avoidable readmissions.
Limitations
While reviewing medical records is regarded as the gold standard in judging the cause of a readmission, reviewer bias can occur as clinicians may adjudicate a complication to decompensation of a patient’s illness rather than issues with the quality of care received during the IA.43 We were unable to determine the influence of functional state or cognition of patients, which have been identified as significant risk factors for readmissions.44 This study was limited by the relatively short 3 month sampling period, which may restrict the generalisability of findings. However, this timeframe was intentionally selected to facilitate detailed, clinician-led adjudication of each readmission’s avoidability – a labour-intensive process requiring in-depth chart review and consensus. While this approach reduced the sample size compared to studies using administrative data over longer durations, it enhanced the clinical validity and specificity of the findings. Another strength of this study was capturing readmissions to all public hospitals rather than limiting the analysis to the index hospital.
Conclusion
Our study found that one-fifth of general medical readmissions are avoidable, with a limited number of predicting factors. There is a need for larger multicentre studies to confirm our findings, along with targeted interventions to focus on improving quality of care, such as discharge summaries, to determine whether any intervention can reduce the number of PAURs.
Data availability
Data may be obtained from the corresponding author on reasonable request and only if permission is granted by the ethics committee.
Declaration of funding
This research was supported by the Flinders Foundation Grant (Grant no. 64945659).
References
1 Meurs E, Siegert CEH, Uitvlugt E, Morabet NE, Stoffels RJ, Schölvinck DW, et al. Clinical characteristics and risk factors of preventable hospital readmissions within 30 days. Sci Rep 2021; 11(1): 20172.
| Crossref | Google Scholar | PubMed |
2 Lavenberg JG, Leas B, Umscheid CA, Williams K, Goldmann DR, Kripalani S. Assessing preventability in the quest to reduce hospital readmissions. J Hosp Med 2014; 9(9): 598-603.
| Crossref | Google Scholar | PubMed |
3 Sharma Y, Horwood C, Hakendorf P, Au J, Thompson C. Char-acteristics and clinical outcomes of index versus non-index hospital readmissions in Australian hospitals: a cohort study. Aust Health Rev 2020; 44(1): 153-9.
| Crossref | Google Scholar | PubMed |
4 Considine J, Fox K, Plunkett D, Mecner M, O’Reilly M, Darzins P. Factors associated with unplanned readmissions in a major Australian health service. Aust Health Rev 2019; 43: 1-9.
| Crossref | Google Scholar |
5 Donzé J, Aujesky D, Williams D, Schnipper JL. Potentially avoidable 30-day hospital readmissions in medical patients: derivation and validation of a prediction model. JAMA Intern Med 2013; 173(8): 632-8.
| Crossref | Google Scholar | PubMed |
6 Cooksley T, Merten H, Kellett J, Brabrand M, Kidney R, Nickel CH, et al. PRISMA Analysis of 30 Day Readmissions to a Tertiary Cancer Hospital. Acute Med 2015; 14(2): 53-6.
| Google Scholar | PubMed |
7 Rico F, Liu Y, Martinez DA, Huang S, Zayas-Castro JL, Fabri PJ. Preventable Readmission Risk Factors for Patients With Chronic Conditions. J Healthc Qual 2016; 38(3): 127-42.
| Crossref | Google Scholar | PubMed |
8 Anderson MA, Helms LB, Hanson KS, DeVilder NW. Unplanned hospital readmissions: a home care perspective. Nurs Res 1999; 48(6): 299-307.
| Crossref | Google Scholar | PubMed |
9 Jackson AH, Fireman E, Feigenbaum P, Neuwirth E, Kipnis P, Bellows J. Manual and automated methods for identifying potentially preventable readmissions: a comparison in a large healthcare system. BMC Med Inform Decis Mak 2014; 14: 28.
| Crossref | Google Scholar | PubMed |
10 van Walraven C, Bennett C, Jennings A, Austin PC, Forster AJ. Proportion of hospital readmissions deemed avoidable: a systematic review. CMAJ 2011; 183(7): E391-402.
| Google Scholar |
11 Feo R, Urry K, Conroy T, Kitson AL. Why reducing avoidable hospital readmissions is a ‘wicked’ problem for leaders: A qualitative exploration of nursing and allied health perceptions. J Adv Nurs 2023; 79(3): 1031-43.
| Crossref | Google Scholar | PubMed |
12 Harvey G, Pham CT, Inacio MC, Laver K, Lynch EA, Jorissen RN, et al. An integrated knowledge translation approach to address avoidable rehospitalisations and unplanned admissions for older people in South Australia: implementation and evaluation program plan. Implement Sci Commun 2021; 2(1): 36.
| Crossref | Google Scholar | PubMed |
13 Jayakody A, Carey M, Bryant J, Ella S, Hussein P, Warren E, et al. Exploring experiences and perceptions of Aboriginal and Torres Strait Islander peoples readmitted to hospital with chronic disease in New South Wales, Australia: a qualitative study. Aust Health Rev 2021; 45(4): 411-7.
| Crossref | Google Scholar | PubMed |
14 Graham KL, Auerbach AD, Schnipper JL, Flanders SA, Kim CS, Robinson EJ, et al. Preventability of Early Versus Late Hospital Readmissions in a National Cohort of General Medicine Patients. Ann Intern Med 2018; 168(11): 766-74.
| Crossref | Google Scholar | PubMed |
15 Shebeshi DS, Dolja-Gore X, Byles J. Charlson Comorbidity Index as a predictor of repeated hospital admission and mortality among older women diagnosed with cardiovascular disease. Aging Clin Exp Res 2021; 33(10): 2873-8.
| Crossref | Google Scholar | PubMed |
16 Adams RJ, Howard N, Tucker G, Appleton S, Taylor AW, Chittleborough C, et al. Effects of area deprivation on health risks and outcomes: a multilevel, cross-sectional, Australian population study. Int J Public Health 2009; 54(3): 183-92.
| Crossref | Google Scholar | PubMed |
17 Sharma Y, Horwood C, Hakendorf P, Shahi R, Thompson C. External Validation of the Hospital Frailty-Risk Score in Predicting Clinical Outcomes in Older Heart-Failure Patients in Australia. J Clin Med 2022; 11(8): 2193.
| Crossref | Google Scholar | PubMed |
18 Frank M, Sivagnanaratnam A, Bernstein J. Nutritional assessment in elderly care: a MUST! BMJ Qual Improv Rep 2015; 4(1): u204810.w2031.
| Crossref | Google Scholar |
19 Chebl RB, Assaf M, Kattouf N, Haidar S, Khamis M, Abdeldaem K, et al. The association between the neutrophil to lymphocyte ratio and in-hospital mortality among sepsis patients: A prospective study. Medicine 2022; 101(30): e29343.
| Crossref | Google Scholar | PubMed |
20 Wu X, Luo Q, Su Z, Li Y, Wang H, Liu Q, et al. Neutrophil-to-lymphocyte ratio as a predictor of mortality in intensive care unit patients: a retrospective analysis of the Medical Information Mart for Intensive Care III Database. BMJ Open 2021; 11(11): e053548.
| Crossref | Google Scholar | PubMed |
21 Aubert CE, Folly A, Mancinetti M, Hayoz D, Donzé J. Prospective validation and adaptation of the HOSPITAL score to predict high risk of unplanned readmission of medical patients. Swiss Med Wkly 2016; 146: w14335.
| Crossref | Google Scholar |
22 Donzé JD, Williams MV, Robinson EJ, Zimlichman E, Aujesky D, Vasilevskis EE, et al. International Validity of the HOSPITAL Score to Predict 30-Day Potentially Avoidable Hospital Readmissions. JAMA Intern Med 2016; 176(4): 496-502.
| Crossref | Google Scholar | PubMed |
23 van Walraven C, Dhalla IA, Bell C, Etchells E, Stiell IG, Zarnke K, et al. Derivation and validation of an index to predict early death or unplanned readmission after discharge from hospital to the community. CMAJ 2010; 182(6): 551-7.
| Crossref | Google Scholar | PubMed |
24 Robinson R, Hudali T. The HOSPITAL score and LACE index as predictors of 30 day readmission in a retrospective study at a university-affiliated community hospital. PeerJ 2017; 5: e3137.
| Crossref | Google Scholar | PubMed |
25 Steyerberg EW, Vickers AJ, Cook NR, Gerds T, Gonen M, Obuchowski N, et al. Assessing the performance of prediction models: a framework for traditional and novel measures. Epidemiology 2010; 21(1): 128-38.
| Crossref | Google Scholar | PubMed |
26 Alhamzawi R, Ali HTM. The Bayesian adaptive lasso regression. Math Biosci 2018; 303: 75-82.
| Crossref | Google Scholar | PubMed |
27 Linden A, Mathur MB, VanderWeele TJ. Conducting sensitivity analysis for unmeasured confounding in observational studies using E-values: The evalue package. Stata J 2020; 20(1): 162-75.
| Crossref | Google Scholar |
28 van Walraven C, Jennings A, Forster AJ. A meta-analysis of hospital 30-day avoidable readmission rates. J Eval Clin Pract 2012; 18(6): 1211-8.
| Crossref | Google Scholar | PubMed |
29 Hekkert K, van der Brug F, Borghans I, Cihangir S, Zimmerman C, Westert G, et al. How to identify potentially preventable readmissions by classifying them using a national administrative database. Int J Qual Health Care 2017; 29(6): 826-32.
| Crossref | Google Scholar | PubMed |
30 van Walraven C, Jennings A, Taljaard M, Dhalla I, English S, Mulpuru S, Blecker S, Forster AJ. Incidence of potentially avoidable urgent readmissions and their relation to all-cause urgent readmissions. CMAJ 2011; 183(14): E1067-72.
| Crossref | Google Scholar | PubMed |
31 Halfon P, Eggli Y, Prêtre-Rohrbach I, Meylan D, Marazzi A, Burnand B. Validation of the potentially avoidable hospital readmission rate as a routine indicator of the quality of hospital care. Med Care 2006; 44(11): 972-81.
| Crossref | Google Scholar | PubMed |
32 Blom MC, Erwander K, Gustafsson L, Landin-Olsson M, Jonsson F, Ivarsson K. The probability of readmission within 30 days of hospital discharge is positively associated with inpatient bed occupancy at discharge--a retrospective cohort study. BMC Emerg Med 2015; 15: 37.
| Crossref | Google Scholar | PubMed |
33 Dagan E, Novack V, Porath A. Adverse outcomes in patients with community acquired pneumonia discharged with clinical instability from Internal Medicine Department. Scand J Infect Dis 2006; 38(10): 860-6.
| Crossref | Google Scholar | PubMed |
34 Lewis P, Braddock K, Tolaymat L, Haga C, Gillis M, Yin M, et al. Discharge Summary Completion Timeliness and the Association of 30-Day Readmission. South Med J 2021; 114(5): 319-21.
| Crossref | Google Scholar | PubMed |
35 Salim Al-Damluji M, Dzara K, Hodshon B, Punnanithinont N, Krumholz HM, Chaudhry SI, et al. Association of discharge summary quality with readmission risk for patients hospitalized with heart failure exacerbation. Circ Cardiovasc Qual Outcomes 2015; 8(1): 109-11.
| Crossref | Google Scholar | PubMed |
36 Cooksley T, Nanayakkara PW, Nickel CH, Subbe CP, Kellett J, Kidney R, et al. Readmissions of medical patients: an external validation of two existing prediction scores. QJM 2016; 109(4): 245-8.
| Crossref | Google Scholar | PubMed |
37 van Galen LS, Cooksley T, Merten H, Brabrand M, Terwee CB, Nickel CH, et al. Physician consensus on preventability and predictability of readmissions based on standard case scenarios. Neth J Med 2016; 74(10): 434-42.
| Google Scholar | PubMed |
38 Cullen C, Johnson DS, Cook G. Re-admission rates within 28 days of total hip replacement. Ann R Coll Surg Engl 2006; 88(5): 475-8.
| Crossref | Google Scholar | PubMed |
39 Qu N, Li T, Zhang L, Liu X, Cui L. Risk factors for unplanned 31-day readmission after surgery for colorectal cancer patients: a meta-analysis. BMC Gastroenterol 2025; 25(1): 285.
| Crossref | Google Scholar | PubMed |
40 Weiss ME, Costa LL, Yakusheva O, Bobay KL. Validation of patient and nurse short forms of the Readiness for Hospital Discharge Scale and their relationship to return to the hospital. Health Serv Res 2014; 49(1): 304-17.
| Crossref | Google Scholar | PubMed |
41 Choudhury J, Perrio S, Scobell M, Bertram T, Gray A. Proactive care post-discharge to reduce 30 day readmissions to hospital. Int J Risk Saf Med 2022; 33(S1): S41-5.
| Google Scholar |
42 Oh EG, Lee HJ, Yang YL, Kim YM. Effectiveness of Discharge Education With the Teach-Back Method on 30-Day Readmission: A Systematic Review. J Patient Saf 2021; 17(4): 305-10.
| Crossref | Google Scholar | PubMed |
43 Halfon P, Eggli Y, van Melle G, Chevalier J, Wasserfallen JB, Burnand B. Measuring potentially avoidable hospital readmissions. J Clin Epidemiol 2002; 55(6): 573-87.
| Crossref | Google Scholar | PubMed |
44 Li CY, Haas A, Pritchard KT, Karmarkar A, Kuo YF, Hreha K, et al. Functional Status Across Post-Acute Settings is Associated With 30-Day and 90-Day Hospital Readmissions. J Am Med Dir Assoc 2021; 22(12): 2447-53 e5.
| Crossref | Google Scholar | PubMed |