

Using Australian genomics to predict dairy cattle performance in New Zealand
Craig Mckimmie A , Majid Khansefid B C and Hamed Amirpour-Najafabadi A *
A Samen NZ Ltd, Morrinsville, Hamilton, 3340, New Zealand.
B Agriculture Victoria Research, AgriBio, Centre for AgriBioscience, 5 Ring Road, Bundoora, Vic. 3083, Australia.
C School of Applied Systems Biology, La Trobe University, Bundoora, Vic. 3083, Australia.
Animal Production Science 63(11) 1068-1073 https://doi.org/10.1071/AN22448
Submitted: 12 December 2022 Accepted: 10 April 2023 Published: 1 May 2023
© 2023 The Author(s) (or their employer(s)). Published by CSIRO Publishing. This is an open access article distributed under the Creative Commons Attribution-NonCommercial-NoDerivatives 4.0 International License (CC BY-NC-ND)
Abstract
Context: The national breeding objective in New Zealand (NZ) was designed with the intention to breed dairy cows that efficiently convert feed into profit. The breeding worth index (BW) is used to rank bulls and cows according to their ability to meet this objective. The Australian equivalent to BW is the balanced performance index (BPI). These selection indexes represent national economic weights for important traits in dairy industry in each country. The introduction of Australian genomics has allowed the selection and ranking of young sires from around the world on BPI.
Aims: This study aims to demonstrate the relationship between different traits and selection indexes in Australia (AU) and NZ by comparing sires with daughter proofs in both countries and the validity of predicting BW for NZ sires using Australian genomic predictions and regression equations.
Methods: Data files for sires with daughters in both AU and NZ were merged to identify common bulls used in both countries. An analysis was conducted to determine whether Australian breeding values (ABVs) for sires could be used to predict the performance of the sires that have no progeny in NZ. ABVs for nine traits in BW were converted to their equivalent NZ breeding values (NBVs) and used to calculate an index equivalent to BW.
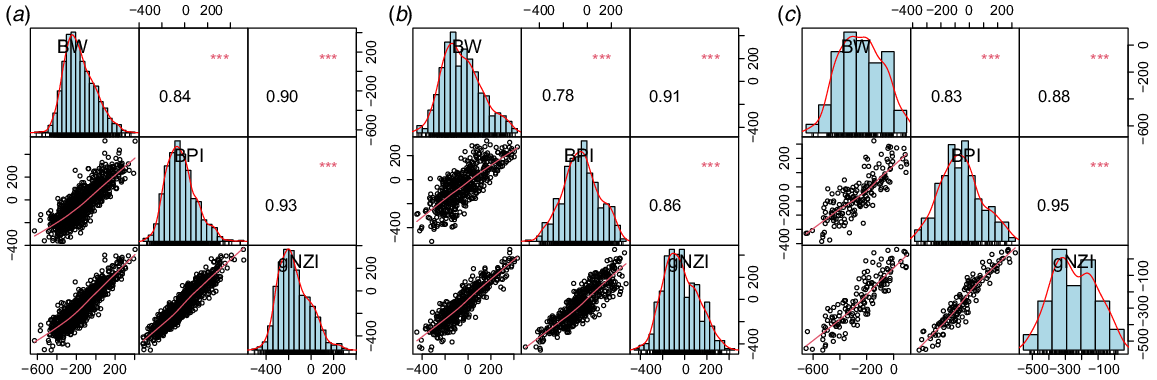
Key results: On the basis of a regression equation, a new index called genomic New Zealand index (gNZI) for selecting sires for NZ dairy herds was developed. The correlation coefficients between gNZI and BW in Holstein Friesian (HF), Jersey, and Red breeds were 0.90, 0.91, and 0.88 respectively.
Conclusions: The regression equation from genomic ABVs to produce gNZI was a reliable genomic predictor of future BW for sires with insufficient ancestry information in NZ and to enhance the ancestry proofs and increase the reliability of selecting young NZ-born bulls.
Implications: The high correlations between traits in AU and NZ and the simple proposed conversion method can build industry confidence when selecting young bulls using gNZI, as genomic prediction of BW through New Zealand Animal Evaluation (NZAEL) is not currently available.
Keywords: Australia, balanced performance index, breeding objectives, breeding worth, dairy breeding index, genomic selection, gNZI, New Zealand.
Introduction
Ranking and selecting dairy cattle according to one trait is easy, but most farmers want to select for and improve more than one trait. Using selection index enables changing the relative importance of traits and adding breeding values for new traits with increasing availability of relevant data records into breeding objectives will ensure optimum genetic progress. Breeding values (BVs) for the traits in a breeding objective are given weights to translate them into an index that could be used to rank and select animals for multiple traits. Hence, assigning economic values to the traits allows dairy producers to determine which bulls will have the most economically efficient daughters. Bulls, cows, and herds can be compared according to the index. However, the weights assigned to each trait are based on the national breeding objectives. Traditionally, weights were calculated solely based on economics, but more recently, the desires of farmers to select specific traits have been considered to adjust the weights (Martin-Collado et al. 2015; Pryce and de Haas 2017). National breeding indexes including breeding worth (BW) in New Zealand (NZ), net merit (NM) in the United States, profitable lifetime index (PLI) in the United Kingdom, economic breeding index (EBI) in Ireland, and balanced performance index (BPI), sustainability index (SI), and health weighted index (HWI) in Australia (AU), provide the means to include relevant (measured) traits for selecting profitable dairy cows in their respective countries (Cole and VanRaden 2017). The implementation of agreed indexes and a national breeding goal has proven highly effective in countries with established dairy industries, to focus breeding programs and on-farm breeding decisions so that high genetic gain rates can be achieved (van der Werf and Pryce 2020). Breed associations and genetic companies have the option of adding new traits into their customised selection indexes to make specific indexes, especially for minor breeds. Hence, in practice, the indexes simplify the selection process. The best bulls can be selected on one number rather than BVs for multiple traits. In addition, economic selection indexes ensure that there is increased emphasis on the traits that are considered most likely to improve the profitability of dairy farms.
Animals with a high genetic merit as prescribed by the national breeding objective can be identified using the BPI, SI or HWI in AU, and BW in NZ, which are published by DataGene (www.datagene.com.au) and NZAEL (www.dairynz.co.nz/animal/animal-evaluation/) respectively. In NZ, BW is used to select dairy cattle on the basis of an optimal combination of economic traits, which is very similar to the logic behind the BPI in AU. Many traits have been incorporated into BPI, including production, health, fertility, type, and feed efficiency (Byrne et al. 2016). In AU, choosing one of the BPI, SI or HWI, allows breeders and commercial farmers to focus their breeding efforts on specific market outcomes or key aspects of their farming systems (Santos et al. 2015).
Our study investigated the common bulls used in AU and NZ to see whether genomic ABVs can be used for ranking bulls in NZ. Consequently, if the genetic correlations between the same traits in AU and NZ were high, the ABVs of the bulls with no BW could be converted to NZ scale and then combined to genomic NZ breeding eorth index (gNZI) for ranking bulls.
Materials and methods
Two publicly available databases were accessed in this study. One from DataVat (DataGene 2022) and the other from the NZAEL animal evaluation website (DairyNZ 2022). There were 30 877 bulls in the NASIS file that were used in AU, whereas there were 26 926 bulls in the NZAEL file.
Both data files were merged using RStudio (RStudio Team 2020), and 3313 common bulls were detected in both files. Subsequently, the common bulls were divided into three separate groups on the basis of breed. In this study, we excluded the bulls with fewer than five daughters. The final file contained 1309 Holstein Friesian (HF), 537 Jersey, and 174 Aussie Red (Red) bulls.
RStudio was employed to convert Australian breeding values (ABVs) to their equivalent NZ breeding values (NBVs) by using a regression model. First, we simply regressed the ABVs on NBVs for the bulls that were evaluated and had daughters in both countries, so as to find the slope and intercept of the regression line. We also calculated the correlation between ABVs and NBVs to make sure that they were highly correlated. Then, we used the calculated breeding values in NZ scale and BW economic values to calculate gNZI. The traits in the BW represent either production efficiency (milk fat yield, milk protein yield, milk volume and liveweight) or robustness (somatic cell, fertility, functional survival, body condition score (BCS) and udder overall) of the cows. Finally, we calculated the correlation between BW and gNZI in different breeds to ensure accurate calculation of gNZI by using ABVs. Using the estimated regression coefficients and intercepts, NBVs and gNZI can be calculated for bulls that have only ABVs.
Results
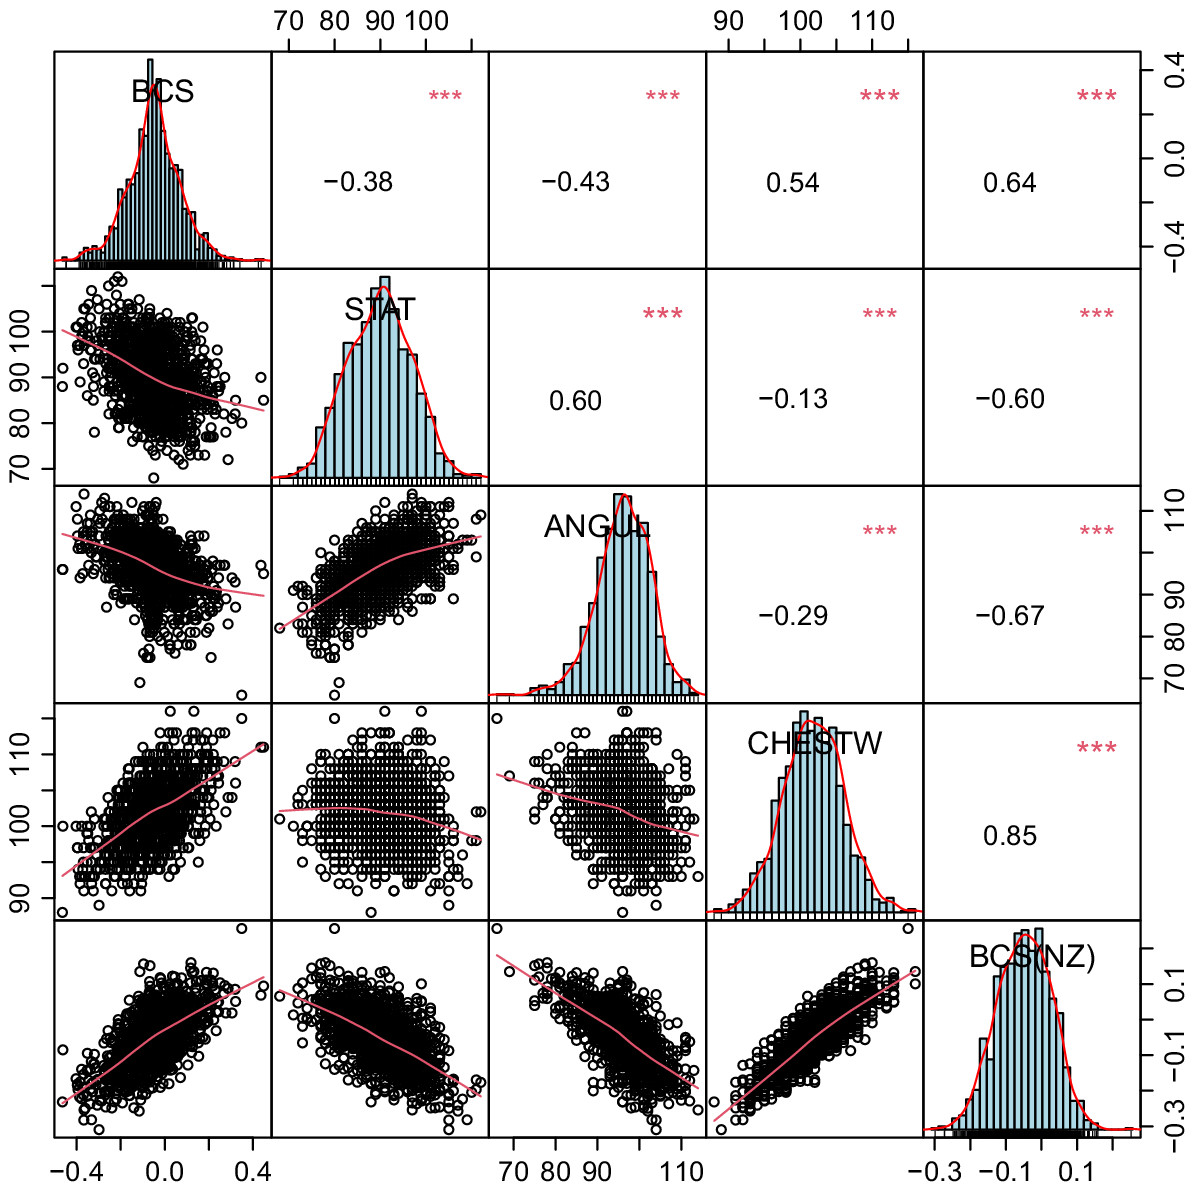
Most of the economic traits are common between BPI and BW. However, the relative weights of the traits could be different. For example, BCS is heavily weighted in the BW. Since this trait is not often measured in AU, we had no ABVs for BCS in most AU bulls (Fig. 1). Angularity, stature, and chest width were highly correlated with BCS, and we used them in a multiple regression model to predict BCS. However, for Jersey and Red breeds, only angularity and chest width traits were significantly correlated with BCS (P < 0.01). Hence, stature was excluded from the model for predicting BCS in these two breeds. For the rest of the traits common in BPI and BW, the calculated regression coefficients by regressing the ABVs on breeding values in NZ could be used to convert ABVs to their equivalent NBVs. The NBVs were weighted and combined into gNZI that was equivalent to BW (Table 1).
The correlation coefficients between body condition score (BCS), and calculated body condition score (BCS(NZ)) from correlated traits (chest width (CHESTW), angularity (ANGUL), and stature (STAT)) in AU, according to the common HF bulls evaluated in both countries.
| Trait | Breed | ||
|---|---|---|---|
| HF | Jersey | Red | |
| Fat BV | 3.41 | 4.25 | 3.45 |
| Protein BV | 7.60 | 6.99 | 6.54 |
| Milk BV | −0.15 | −0.18 | −0.15 |
| Liveweight | −0.82 | −0.49 | −1.04 |
| Somatic cell BV | −41.07 | −38.70 | −34.89 |
| Fertility BV | 7.31 | 8.30 | 8.59 |
| Body condition score | −160.28 | 265.37 | 634.09 |
| Udder overall | 0.84 | 1.55 | 0.72 |
| Survival | 27.41 | 6.14 | 35.82 |
As can be seen in Fig. 2, the correlation coefficients between calculated gNZI and BW in HF, Jersey, and Red breeds are 0.90, 0.91, and 0.88 respectively. The BPI was highly correlated with gNZI in HF and Red compared with the Jersey breed. Therefore, gNZI was highly correlated with BW (which was expected) as well as BPI in all breeds. Given the correlation between gNZI and BW was higher than that between BPI and BW, gNZI could be a suitable alternative to BPI for ranking and selecting the bulls that do not have BW.
The genetic correlations between the same traits in NZ and AU are shown in Tables 2, 3 and 4 for HF, Jersey and the Red breeds respectively. In HF, the highest genetic correlation between the same traits in NZ and AU was 0.9 for protein (Table 2).
| AU | NZ | |||||||
|---|---|---|---|---|---|---|---|---|
| Fat | Protein | Milk | Liveweight | Fertility | SCC | Functional survival | Udder overall | |
| Fat | 0.86 | 0.63 | 0.51 | 0.17 | −0.21 | 0.06 | 0.03 | 0.33 |
| Protein | 0.71 | 0.90 | 0.80 | 0.23 | −0.33 | 0.11 | −0.06 | 0.47 |
| Milk | 0.41 | 0.63 | 0.86 | 0.38 | −0.48 | 0.01 | −0.29 | 0.50 |
| Liveweight | 0.24 | 0.32 | 0.49 | 0.67 | −0.44 | −0.06 | −0.29 | 0.57 |
| Fertility | −0.11 | −0.20 | −0.39 | −0.28 | 0.75 | −0.14 | 0.57 | −0.35 |
| SCC | 0.11 | 0.06 | 0.13 | 0.22 | 0.08 | −0.84 | 0.22 | 0.27 |
| Survival | 0.54 | 0.52 | 0.51 | 0.26 | −0.05 | −0.24 | 0.33 | 0.60 |
| Udder overall | 0.38 | 0.48 | 0.61 | 0.44 | −0.48 | −0.067 | −0.21 | 0.86 |
| AU | NZ | |||||||
|---|---|---|---|---|---|---|---|---|
| Fat | Protein | Milk | Liveweight | Fertility | SCC | Functional survival | Udder overall | |
| Fat | 0.90 | 0.81 | 0.67 | 0.51 | −0.19 | 0.14 | 0.37 | 0.12 |
| Protein | 0.71 | 0.88 | 0.87 | 0.50 | −0.31 | 0.18 | 0.16 | 0.13 |
| Milk | 0.29 | 0.56 | 0.80 | 0.21 | −0.35 | 0.15 | −0.17 | 0.02 |
| Liveweight | 0.47 | 0.51 | 0.43 | 0.68 | −0.21 | 0.28 | 0.23 | 0.25 |
| Fertility | −0.05 | −0.06 | −0.09 | −0.05 | 0.53 | −0.05 | 0.21 | −0.05 |
| SCC | −0.10 | −0.16 | −0.18 | −0.22 | 0.05 | −0.82 | 0.04 | 0.08 |
| Survival | 0.55 | 0.62 | 0.66 | 0.32 | −0.25 | 0.15 | 0.21 | 0.34 |
| Udder overall | 0.20 | 0.30 | 0.37 | 0.15 | −0.38 | 0.091 | −0.05 | 0.71 |
| AU | NZ | |||||||
|---|---|---|---|---|---|---|---|---|
| Fat | Protein | Milk | Liveweight | Fertility | SCC | Functional survival | Udder overall | |
| Fat | 0.89 | 0.79 | 0.76 | 0.32 | −0.08 | 0.10 | 0.18 | 0.29 |
| Protein | 0.76 | 0.89 | 0.84 | 0.32 | 0.00 | 0.04 | 0.23 | 0.29 |
| Milk | 0.58 | 0.72 | 0.85 | 0.33 | −0.17 | 0.11 | 0.04 | 0.25 |
| Liveweight | 0.05 | 0.10 | 0.15 | 0.55 | −0.20 | −0.04 | −0.13 | 0.33 |
| Fertility | 0.12 | 0.07 | −0.10 | −0.20 | 0.73 | −0.26 | 0.40 | −0.23 |
| SCC | 0.07 | 0.09 | 0.05 | 0.05 | 0.17 | −0.81 | 0.17 | 0.24 |
| Survival | 0.64 | 0.63 | 0.61 | 0.35 | −0.03 | −0.13 | 0.40 | 0.52 |
| Udder overall | −0.10 | −0.10 | −0.03 | 0.28 | −0.38 | −0.095 | 0.10 | 0.71 |
The genetic correlations between the countries were 0.80 for milk and 0.90 for fat in Jersey (Table 3). The genetic correlation between milk and fat in NZ was 0.69, while in AU it was 0.45. The highest genetic correlation was 0.9 for fat between AU and NZ in Jersey. This coincides with the fact that Jersey has been selected for fat production, whereas HF has been selected for milk yield and protein production.
Somatic cell count (SCC) is reported in different scales in NZ and AU. In AU, ABVs greater than the base of 100 represent lower SCC, but in NZ a lower SCC is represented as a negative NBV. Lower SCC is associated with decreased clinical mastitis costs, lower bulk milk somatic cell penalties, and improved survival. The genetic correlations between the two countries for SCC in HF, Jersey, and Red breeds were −0.84, −0.82 and −0.81 respectively.
For the Red breed, the correlation for both fat and protein was 0.89 between AU and NZ (Table 4). The functional survival was less correlated (0.33 for HF, 0.40 for Red, and 0.21 for Jersey) between the two countries than were other traits. Fertility in Jersey (0.53) was less correlated between the two countries than it was in HF (0.75) and Red (0.73) breeds.
According to this study, 219 genomic bulls have better gNZI (>297.10) than the top 10 bulls with daughter proofs in both countries (BW > 292.56). The average of the top 10 gNZI bulls was 379.2. Hence, gNZI could be useful in selecting the top genomic sires. Generally, breeding programs using genomic selection achieve better genetic gains than do progeny testing programs (Thomasen et al. 2020) because of greater selection intensity and accuracy, as well as reduced generation interval.
Discussion
Artificial insemination has played an important role in gene flow, resulting in an increased rate of genetic gain on dairy farms, facilitating the use of the best sires from all around the world. For NZ dairy industry, selecting the best international sires that suit the NZ environment could lead to a greater increase in genetic gain, particularly on traits that NZ has had little or no selection on. This could also improve productivity and profits by allowing farmers to control inbreeding by optimal mate allocation strategies.
Economic value assigned to traits is used to determine which bulls will produce economically efficient daughters in given production conditions. The dairy production system in NZ is the most comparable to that in AU (Wales and Kolver 2017). Therefore, the gNZI that, which is highly correlated with BW and BPI, could be used in NZ for the bulls without BW to assist farmers in selecting semen from young overseas sires.
In a study by (Costa et al. 2000), the genetic correlation between traits in Brazil and the United States was investigated. A bivariate sire model was used to estimate the genetic correlation between the same trait in two countries or different traits within a country. Across countries, genetic correlations were 0.85 for milk and 0.88 for fat. In Brazil, the genetic correlation between milk and fat was 0.79, while in the United States, it was 0.62. In our study, the genetic correlation for fat and milk yield was the same 0.86 across the countries. The genetic correlation between milk and fat yields in NZ was 0.51, while in AU it was 0.41 in HF. It is important to note that the correlations between traits in different countries can be influenced by differences in feed and other environmental factors as well as genotype × environment (G × E) interaction effects. Therefore, further research is required to investigate the underlying reasons for variation in genetic correlations between same traits in different countries.
In this study, we investigated the potential use of the gNZI in NZ for selecting young overseas sires. The gNZI was calculated using breed-specific regression equations that converted ABVs to NBVs to account for differences in traits and economic values between the two countries. The gNZI was found to be highly correlated with BW and BPI in HF, Jersey and Red breeds. However, recalibration of regression coefficients is required for every official release of ABVs to ensure accurate conversion of BPI to gNZI.
The genetic correlations between the traits in NZ and AU were highest for protein in HF and for fat in Jersey. The correlation between SCC in NZ and AU was negative because the trait definition was different in the two countries. However, SCC was highly correlated between the two countries in all three breeds, which indicates that the aim of selection is to reduce SCC. Fertility in AU and NZ was less correlated in Jersey than in HF and Red breeds. The genetic correlation between functional survival trait was the lowest between the two countries for all breeds. This could be associated with the differences in definition of traits in two countries.
We found that, compared with the other two breeds, Jersey liveweight was highly correlated with fat and protein. This might be associated with lower liveweight variation in Jersey than in HF and Red breeds.
Overall, our study suggests that using gNZI in NZ for selecting young overseas sires can significantly increase the size and variation of the selection pool and has the potential to lead to significant genetic gain advancements in New Zealand. However, developing gNZI from ABVs required AN investigating the correlations between the traits in AU and NZ to ensure the reasonable reliability of calculated NBVs for the traits in BW.
Conclusions
According to our study, breeding programs in NZ could benefit from Australian genomic predictions. The high correlation between the ABVs and NBVs indicated that Australian genomic predictions are useful and reliable for evaluating potential international sires for the NZ dairy industry. Higher correlation between BW and gNZI than BW and BPI also indicates that our developed gNZI could be a better index for selecting international bulls than is BPI for NZ conditions, because it is more similar to BW. Utilising bulls from other countries increases the number of candidates and selection intensity, which could increase the rate of genetic gain in NZ. Furthermore, it offers the opportunity to introduce more genetic diversity, resulting in a decrease in inbreeding.
Data availability
The data that support this study will be shared upon reasonable request to the corresponding author.
Acknowledgements
The authors acknowledge the use of public data files that are available on the NZAEL and DataGene websites.
References
Byrne TJ, Santos BFS, Amer PR, Martin-Collado D, Pryce JE, Axford M (2016) New breeding objectives and selection indices for the Australian dairy industry. Journal of Dairy Science 99, 8146-8167.
| Crossref | Google Scholar |
Cole JB, VanRaden PM (2017) Possibilities in an age of genomics: The future of selection indices. Journal of Dairy Science 101, 3686-3701.
| Crossref | Google Scholar |
Costa CN, Blake RW, Pollak EJ, Oltenacu PA, Quaas RL, Searle SR (2000) Genetic analysis of Holstein cattle populations in Brazil and the United States. Journal of Dairy Science 83(12), 2963-2974.
| Crossref | Google Scholar |
DairyNZ (2022) The aim of Animal Evaluation is to identify animals whose progeny will be the most efficient converters of feed into farmer profit, NZAEL: New Zealand Animal Evaluation Limited. Available at https://www.dairynz.co.nz/animal/animal-evaluation/ [accessed 18 November 2022]
DataGene (2022) DataVat. Available at https://www.datavat.com.au/abv-list-reports [accessed 18 November 2022]
Martin-Collado D, Byrne TJ, Amer PR, Santos BFS, Axford M, Pryce JE (2015) Analyzing the heterogeneity of farmers’ preferences for improvements in dairy cow traits using farmer typologies. Journal of Dairy Science 98(6), 4148-4161.
| Crossref | Google Scholar |
RStudio Team (2020) RStudio: integrated development for R. RStudio, PBC, Boston, MA, USA. Available at http://www.rstudio.com/
Santos BFS, McHugh N, Byrne TJ, Berry DP, Amer PR (2015) Comparison of breeding objectives across countries with application to sheep indexes in New Zealand and Ireland. Journal of Animal Breeding and Genetics 132(2), 144-154.
| Crossref | Google Scholar |
Thomasen JR, Liu H, Sørensen AC (2020) Genotyping more cows increases genetic gain and reduces rate of true inbreeding in a dairy cattle breeding scheme using female reproductive technologies. Journal of Dairy Science 103, 597-606.
| Crossref | Google Scholar |
Wales WJ, Kolver ES (2017) Challenges of feeding dairy cows in Australia and New Zealand. Animal Production Science 57(7), 1366-1383.
| Crossref | Google Scholar |