

Application of machine-learning algorithms to predict calving difficulty in Holstein dairy cattle
Mahdieh Avizheh A , Mohammad Dadpasand A , Elena Dehnavi B and Hamideh Keshavarzi C *
A Department of Animal Science, School of Agriculture, Shiraz University, Shiraz, Iran.
B AGBU, a Joint Venture of NSW Department of Primary Industries and University of New England, Armidale, NSW 2351, Australia.
C Agriculture and Food, Commonwealth Scientific and Industrial Research Organisation (CSIRO), Armidale, NSW 2350, Australia.
Animal Production Science 63(11) 1095-1104 https://doi.org/10.1071/AN22461
Submitted: 14 December 2022 Accepted: 24 April 2023 Published: 15 May 2023
© 2023 The Author(s) (or their employer(s)). Published by CSIRO Publishing. This is an open access article distributed under the Creative Commons Attribution-NonCommercial-NoDerivatives 4.0 International License (CC BY-NC-ND)
Abstract
Context: An ability to predict calving difficulty could help farmers make better farm-management decisions, thereby improving dairy farm profitability and welfare.
Aims: This study aimed to predict calving difficulty in Iranian dairy herds using machine-learning (ML) algorithms and to evaluate sampling methods to deal with imbalanced datasets.
Methods: For this purpose, the history records of cows that calved between 2011 and 2021 on two commercial dairy farms were used. Using WEKA software, four commonly used ML algorithms, namely naïve Bayes, random forest, decision trees, and logistic regression, were applied to the dataset. The calving difficulty was considered as a binary trait with 0, normal or unassisted calving, and 1, difficult calving, i.e. receiving any help during parturition from farm personnel involvement to surgical intervention. The average rate of difficult calving was 18.7%, representing an imbalanced dataset. Therefore, down-sampling and cost-sensitive techniques were implemented to tackle this problem. Different models were evaluated on the basis of F-measure and the area under the curve.
Key results: The results showed that sampling techniques improved the predictive model (P = 0.07, and P = 0.03, for down-sampling and cost-sensitive techniques respectively). F-measure ranged from 0.387 (decision tree) to 0.426 (logistic regression) with the balanced dataset. However, when applied to the original imbalanced dataset, naïve Bayes had the best performance of up to 0.388 in terms of F-measure.
Conclusions: Overall, sampling techniques improved the prediction model compared with original imbalanced dataset. Although prediction models performed worse than expected (due to an imbalanced dataset, and missing values), the implementation of ML algorithms can still lead to an effective method of predicting calving difficulty.
Implications: This research indicated the capability of ML algorithms to predict the incidence of calving difficulty within a balanced dataset, but that more explanatory variables (e.g. genetic information) are required to improve the prediction based on an unbalanced original dataset.
Keywords: cost-sensitive technique, dairy cow, difficult calving, down-sampling, herd–cow factors, imbalanced dataset, machine-learning algorithms, predictive models.
Introduction
Difficult calving, also known as dystocia, is one of the most important reproductive traits to influence dairy farm profitability and animal welfare. Difficult calving leads to longer birth interval (Deka and Das 2021) and increased open days (Montazeri-Najafabadi and Ghaderi-Zefrehei 2021), decrease in longevity (Ghavi Hossein-Zadeh 2016), a decline in milk lactose (Antanaitis et al. 2021), and an increase in the number of inseminations per conception (López de Maturana et al. 2007). Higher veterinary costs, premature culling and replacement costs are also related to difficult calving (López de Maturana et al. 2007; McGuirk et al. 2007). After excluding culling, veterinary, and other management costs, Mee (2004) has reported that reduced production (41%) is the most crucial factor of all losses due to difficult calving, with lower fertility (34%), and cow and calf morbidity and mortality (25%) following in importance.
Cows that experienced difficult calving are also more likely to suffer from other diseases such as mastitis (Juozaitienė et al. 2017), lameness (Malašauskienė et al. 2022), and delayed uterine repair (Hiew et al. 2016), and overall wellbeing of both calf and cow is at risk (Mee 2004). The annual wastage cost was estimated at up to NZ$10 286 per 100 cows in a New Zealand pasture-based system attributed to calving trouble apart from non-pregnancy, mastitis, udder problems, and injury or accident (Kerslake et al. 2018). Sadeghi-sefidmazgi et al. (2012) estimated an economic weight (economic values multiplied by gene expressions) of –US$1.35 and –US$0.28 per unit of trait per calf born in a time horizon of 20 years for the percentage of direct and maternal calving difficulties per calf born in Iranian Holstein dairy cattle.
Despite the economic and welfare importance being generally well understood, and relative emphasis of including calving difficulty in selection indices (Mee 2008), a significant percentage of dairy cattle in different countries still requires assistance during partition, ranging from moderate (e.g. 20.5% in Italian Holstein cows (Probo et al. 2022) and 19.9% in Irish dairy herds (Fenlon et al. 2017)) to considerable assistance (5.9% in Ireland; Fenlon et al. 2017). A possible solution to overcoming the difficult calving problem might be to predict its probability on the basis of the associated factors. The prediction of calving difficulty would help farmers to introduce better breeding, calving, and culling management. Furthermore, according to the high correlation between difficult calving and stillbirth (Eriksson et al. 2004), calf loss might be reduced if difficult calving is predicted in advance.
Several factors have been identified as risk factors for difficult calving. They can be grouped into (1) maternal factors including parity (De Amicis et al. 2018), difficult calving experience at previous calving (Mee et al. 2011), body condition score (BCS), age of dam at birth, milk production, calving interval (Zaborski et al. 2014) and length of gestation (De Amicis et al. 2018), (2) factors related to the calf, including birth type (Weldeyohanes and Fesseha 2020), calf sex, and weight (De Amicis et al. 2018), and (3) factors related to the sire such as the type of inseminated sperm (Norman et al. 2010).
Season of birth, year of birth, and herd are other factors affecting calving difficulty according to Atashi et al. (2012). All these herd–cow parameters can be used to predict the likelihood of calving difficulty. Numerous methods, mostly based on logistic models (Johanson and Berger 2003; Bureš et al. 2008; Mee et al. 2011), have been developed to predict calving difficulty. Machine-learning (ML) algorithms are other useful tools to predict complex traits such as calving difficulty. The recent widespread use of these algorithms has been attributed to their ability to successfully classify unknown samples, modify and handle large datasets with missing values, and their robustness and flexibility in classification and prediction, particularly in non-linear systems (Sampson et al. 2011; Shahinfar et al. 2014). The maximum coefficient of determination for ML methods was 0.92 and for regression methods it was 0.77, which indicates that machine learning has been able to obtain a better relationship between independent and dependent variables (Baaken and Hess 2021).
Although ML algorithms have been widely used for livestock research such as prediction of abortion (Keshavarzi et al. 2020), insemination outcomes (Shahinfar et al. 2014; Hempstalk et al. 2015), and milk yield and composition (Dallago et al. 2022), there have been few attempts to evaluate the predictive ability of calving-difficulty models by using ML algorithms (Fenlon et al. 2017). A series of studies identified unassisted and difficult calving for Polish Holstein-Friesians with classification trees, support vector machines, neural networks, and generalised linear models (Zaborski and Grzesiak 2011; Zaborski et al. 2014, 2016). However, there is no study predicting calving difficulty in Iranian dairy cows by using ML algorithms. Overall, the incidence rate of calving difficulty ranges from 1.5% to 22.0% worldwide (Mee 2008; Vincze et al. 2018), indicating a level of imbalance for this trait. This is where most ML algorithms would be expected to work best when there are approximately equal numbers of samples in each class. That is because most algorithms aim to maximise accuracy and minimise errors (Fernández et al. 2018). Therefore, this study was conducted to employ a range of ML algorithms to predict the likelihood of calving difficulty in Iranian dairy herds and to assess the performance of sampling techniques to deal with an imbalanced dataset.
Materials and methods
Data collection and trait definition
The cow-history records of two commercial dairy farms that calved between 2011 and 2021 were collected. Independent variables related to calving difficulty, including herd, parity number, milk yield, calving date, dry period, calving interval, calving status, birth type, gestation length, BCS, calf sex, calf bodyweight, and calving season were recorded. Data were edited using R (R Core Team 2022) and SQL Server Management Studio (Microsoft 2012). Cows with missing parity number, calving dates, or calving status were removed from the original dataset. Only cows of parity of 2 to ≤6 (cows in parity >6 were considered as 6) were used. The final edited data included 14 543 records. Calving difficulty was considered as binary trait, with 0 representing normal or unassisted calving, and 1 representing difficult calving, i.e. receiving any help during parturition, from farm-personnel involvement to surgical intervention. The average rate of difficult calving was 18.7%. The definition of all used traits is presented in Supplementary material Table S1. The explanatory variables used to predict the calving difficulty in this study are presented in Table 1.
| No. | Feature | Type | Level | Minimum | Maximum | Mean ± s.d. | Missing value (%) |
|---|---|---|---|---|---|---|---|
| 1 | Calving difficulty | Binary | 2 | 0 | 1 | – | 0 |
| 2 | Calving status | Binary | 2 | 0 | 1 | – | 0 |
| 3 | Birth type | Binary | 2 | 0 | 1 | – | 0 |
| 4 | Previous difficult calving | Binary | 2 | 0 | 1 | – | 1.95 |
| 5 | Herd | Nominal | 2 | 1 | 2 | – | 0 |
| 6 | Parity number | Nominal | 5 | 2 | 6 | – | 0 |
| 7 | Calf sex | Nominal | 3 | 1 | 3 | – | 2.67 |
| 8 | Calving season | Nominal | 4 | 1 | 4 | – | 0 |
| 9 | Gestation length (days) | Numeric | – | 261 | 294 | 276.20 ± 4.90 | 0 |
| 10 | Calving interval (days) | Numeric | – | 305 | 700 | 407.40 ± 73.77 | 0 |
| 11 | Milk yield (305 days) | Numeric | – | 5389 | 19 501 | 12630.0 ± 2054.90 | 0.06 |
| 12 | Dry period (days) | Numeric | – | 4 | 200 | 63.93 ± 26.30 | 0 |
| 13 | Calf bodyweight (kg) | Numeric | – | 22 | 60 | 41.39 ± 3.35 | 2.99 |
| 14 | Body condition score | Numeric | – | 1.5 | 5 | 3.38 ± 0.44 | 17.32 |
s.d., standard deviation.
Machine-learning algorithms
Four distinctly different machine-learning algorithms were used to predict the likelihood of calving difficulty. These were decision trees (DT), naïve Bayes (NB), random forest (RF), and logistic regression (LR). A summary of the performance characteristics of these algorithms is given below.
DT is a decision support tool with tree-shaped structures that chooses features on the basis of their level of information. Selection and testing of features is first undertaken at the root of the trees, while testing for other attributes is conducted in the subordinate nodes. The criteria for choosing which attribute to test at each node is based on the information-theoretic heuristic of minimising entropy (McQueen et al. 1995).
NB is one of the simplest machine-learning algorithms following Bayes’ rule, assuming that all features are independent (Friedman et al. 1997). The posterior probability for a variable C is based on the features f1,.., fn, where n is the number of features that can be calculated by multiplying the probabilities of every feature in each class (Murty and Devi 2011).
A random forest is a type of ensemble method where multiple classifiers are trained using bootstrap samples from the training set and a random subset of features is used for generating each of these classifiers (Breiman 2001). In contrast to bagged decision trees, which also use randomly selected subsets for each tree, the RF algorithm selects a random subset of features from the available pool for each split in the tree during the training phase (Hempstalk et al. 2015).
LR relates the independent variables to the probability of each category in the dependent variable. Despite the limitations of linear regression being unable to produce a probability between 0 and 1, as well as violating the assumption of independence and normal distribution of errors when dealing with categorical and binary variables, LR handles this by transforming the target variable, which is then approximated using weights, much as linear regression does. Maximising the log-likelihood determines the optimal weights for the model (Hempstalk et al. 2015; Witten et al. 2017).
Prediction model
The analysis was performed using WEKA Machine Learning Workbench (Witten et al. 2017) to predict the likelihood of calving difficulty. A percentage method was used to randomly divide the original dataset into two subsets, namely, a training and a test dataset (at a ratio of 70:30), so that the rate of difficult calving in each subset was equal to the original one, i.e. 18.7%. In this study, two methods of down-sampling and cost-sensitive techniques were used to balance the original dataset and to improve the prediction method. SpreedSunSample of the filter group in WEKA (Witten et al. 2017) was used for down-sampling the majority class of the response variable. The cost-sensitive method moves the threshold towards the lower or minor classes to increase the error cost for the lower class in which less error occurs (Jabeur et al. 2020). In this study, false negative on the cost was considered for false negative on the higher score (difficulty calving). Finally, three datasets, namely (1) original, including herd–cow information, (2) down-sampled dataset based on the original dataset, and (3) cost-sensitive dataset based on the original dataset, were available for the prediction model.
Model evaluation
So as to identify the best predictive model for calving difficulty, each model was evaluated in terms of its own specific predictive ability. Performance comparisons have commonly been based on graphical performance assessments (i.e. receiver operating characteristic (ROC) curve and prediction-recall curve), which have also been applied to imbalanced datasets in recent years (Saito and Rehmsmeier 2015). Other parameters that have been recommended for the evaluation of the performance of predictive models for imbalanced datasets are the F-measure, weighted area under the curve (AUC), and Matthews correlation coefficient (Bekkar et al. 2013). Statistically, accuracy is not an appropriate measure of the performance of a prediction model when the dataset is imbalanced (Bekkar et al. 2013). In this study, the AUC, F-measure, and graphical performance assessments were used to evaluate the performance of different models, and algorithms. The AUC was also examined because it is still widely used despite reports that it does not always perform well for imbalanced datasets (Briggs and Zaretzki 2008). Comparisons were presented on the basis of the original scales as means ± s.d., with an acceptable significant difference when P < 0.05. Plots were drawn in the R environment (R Core Team 2022).
F-measure is a measure of the accuracy of a test. It is calculated from the precision or positive predictive value and recall or true positive rate, as follows:
where and , where, TP = true positive, FN = false negative, FP = false positive and TN = true negative.
Results
Prediction model of calving difficulty based on herd–cow factors
The incidence rate of difficult calving was 18.7%, presenting an imbalanced dataset. For instance, using the RF algorithm in this study, calf bodyweight and calving interval emerged as the highest rankings for predicting the incidence of calving difficulty (Table 2).
| Rank | Impurity decrease | Feature |
|---|---|---|
| 1 | 0.38 | Calf bodyweight |
| 2 | 0.38 | Calving interval |
| 3 | 0.34 | Calf sex |
| 4 | 0.34 | Gestation length |
| 5 | 0.34 | Dry period |
| 6 | 0.33 | Milk yield (305 days) |
| 7 | 0.30 | Parity number |
| 8 | 0.28 | Calving season |
| 9 | 0.25 | Body condition score |
| 10 | 0.25 | Previous difficult calving |
| 11 | 0.23 | Herd |
| 12 | 0.13 | Birth type |
| 13 | 0.12 | Calving status |
Results before data processing to counter imbalance
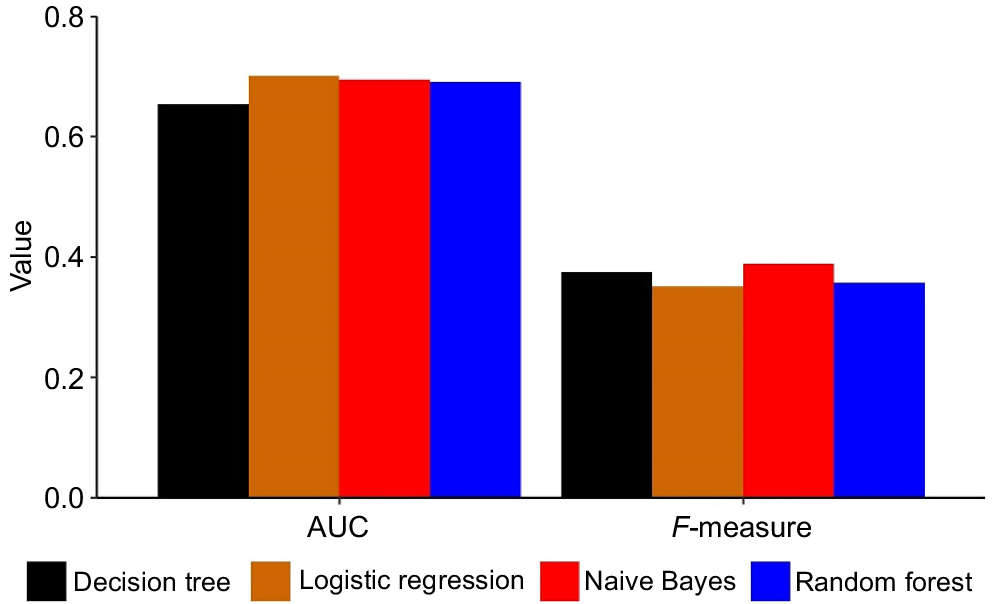
Four machine-learning algorithms (decision trees, random forest, logistic regression, and naïve Bayes) were used to predict the calving difficulty. The classification accuracy of the predictive models ranged from 82.98% to 83.33%. The performance (in terms of F-measure and AUC) of different algorithms to predict the calving difficulty on the basis of the original dataset is shown in Fig. 1. On the basis of our finding, ML algorithms did not perform as expected to predict the likelihood of calving difficulty (Fig. 1). The greatest value for F-measure with the original dataset was achieved with naïve Bayes, whereas the logistic regression recorded the lowest value (0.388 vs 0.350; Fig. 1). The average value of AUC for different ML algorithms was 0.685, which ranged from 0.654 (decision trees) to 0.701 (logistic regression; Fig. 1).
Improving prediction model with different sampling techniques
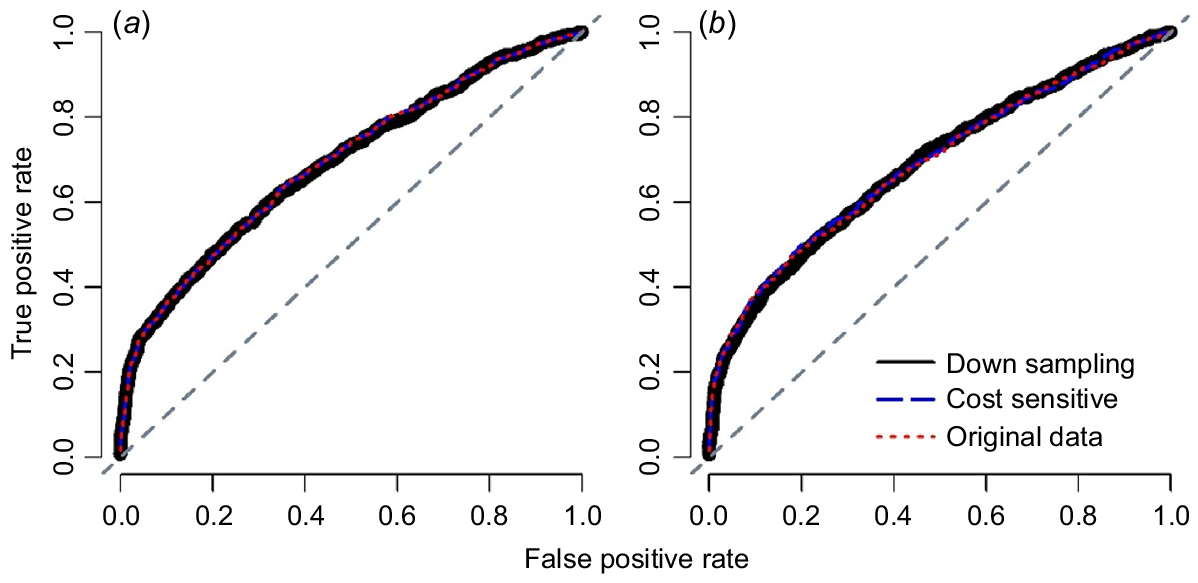
The two sampling techniques used to deal with imbalances in the original dataset improved the predictive model in terms of F-measure (P = 0.07 and P = 0.03, for down-sampling and cost-sensitive methods; Table 3). An average difference of 0.031 was seen between the F-measure of the original model and those of the down-sampling and cost-sensitive methods, while AUC value was not changed by sampling techniques (Table 3). The difference between two sampling techniques was not statistically significant (P = 0.18, Table 3), although down-sampling did numerically improve the performance of the predictive model (F-measure = 0.406 ± 0.016 vs F-measure = 0.391 ± 0.006, Table 3) compared with the cost-sensitive method. ROC curve analysis illustrated that the sampling methods had almost no effect on improving the prediction of calving difficulty (Fig. 2).
| Parameter | Paired comparisons (mean + s.d.)A | P-value | ||
|---|---|---|---|---|
| Original dataset | Down-sampling | Cost-sensitive | ||
| F-measure | 0.367 ± 0.017 | 0.406 ± 0.016 | – | 0.07 |
| 0.367 ± 0.017 | – | 0.391 ± 0.006 | 0.03 | |
| – | 0.406 ± 0.016 | 0.391 ± 0.006 | 0.18 | |
| Area under curve | 0.685 ± 0.021 | 0.677 ± 0.036 | – | 0.40 |
| 0.685 ± 0.021 | – | 0.677 ± 0.037 | 0.42 | |
| – | 0.677 ± 0.036 | 0.677 ± 0.037 | 0.91 | |
AResults are from the imbalanced testing dataset.
Performance of the algorithms using different dataset
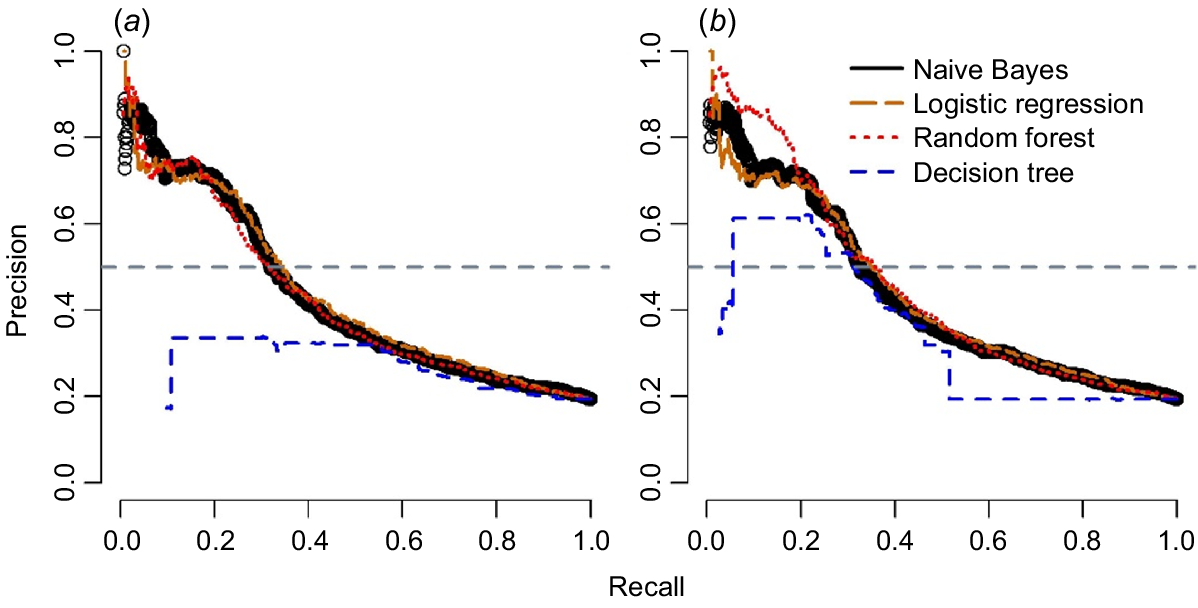
The performance of the four algorithms was evaluated in terms of AUC, and F-measure values for different sets of data are reported in Table 4. Figs 3, 4 demonstrate the precision-recall plots and ROC curves of these four algorithms with two sampling techniques. All algorithms showed considerable improvement in their productive performance with sampling techniques, as shown in their F-measure; however, AUC did not influence considerably (Table 4). These algorithms also showed similar results for different sampling techniques as shown by the analyses of precision-recall curve (Fig. 3) and ROC curves (Fig. 4).
| Algorithm | Original datasetA | Down-samplingA | Cost-sensitiveA | |||
|---|---|---|---|---|---|---|
| F-measure | AUC | F-measure | AUC | F-measure | AUC | |
| Naïve Bayes | 0.388 | 0.695 | 0.410 | 0.692 | 0.400 | 0.695 |
| Logistic regression | 0.350 | 0.701 | 0.426 | 0.705 | 0.391 | 0.701 |
| Random forest | 0.356 | 0.690 | 0.402 | 0.689 | 0.384 | 0.692 |
| Decision tree | 0.375 | 0.654 | 0.387 | 0.624 | 0.392 | 0.621 |
AThe original dataset included herd–cow factors, and the sampling methods were implemented on the original dataset.
Comparison of different machine-learning algorithms based on precision-recall curve for predicting calving difficulty in cows for (a) down-sampling method, and (b) cost-sensitive method. All plots were drawn on the basis of the results from the testing dataset.
Comparison of different machine-learning algorithms based on area under the curve (ROC) for predicting calving difficulty in cows for (a) down-sampling method, and (b) cost-sensitive method. All plots were drawn on the basis of the results from the testing dataset.
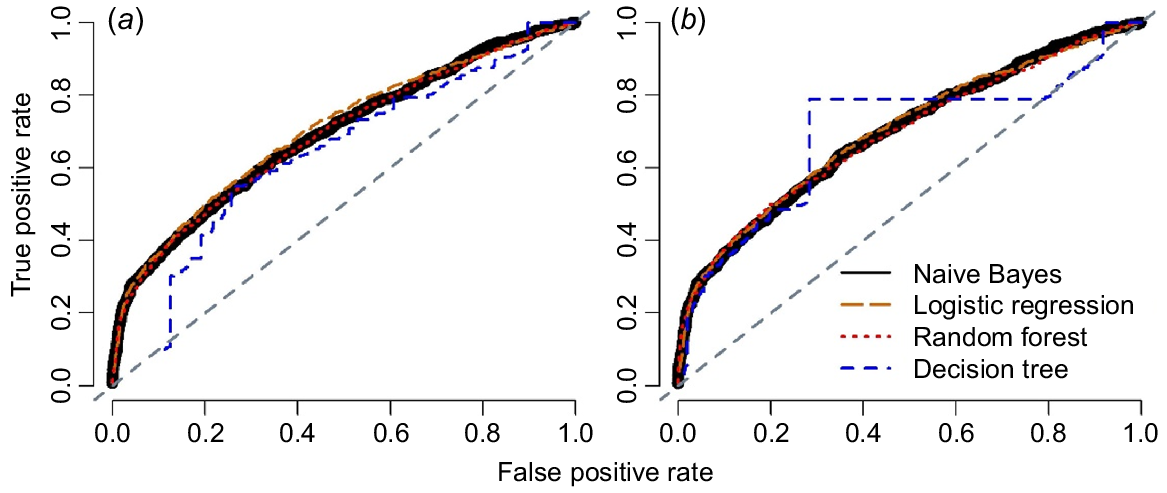
Logistic regression and naïve Bayes were the two best methods to predict calving difficulty on the balanced dataset using a down-sampling method in terms of F-measure (0.426 and 0.410 respectively) and the AUC (0.705 and 0.692) in this study (Table 4). However, using the cost-sensitive method, naïve Bayes and DT were the first two algorithms in terms of their ability to predict the calving difficulty (Table 4).
Discussion
Prediction model of calving difficulty based on herd–cow factors
Using the RF algorithm, calf bodyweight and calving interval ranked highest for predicting the incidence of calving difficulty. Fenlon et al. (2017), using a neural network machine-learning model, reported that second parity, BCS at calving, and parity greater than three were the most important factors. However, in the same study, BSC, calving interval, and predicted transmitting ability of maternal calving difficulty were the highest effective factors when analysed via the RF algorithm (Fenlon et al. 2017). A study by Zaborski et al. (2014), using boosted classification trees, showed that calving interval was the most important key factor for the prediction of calving difficulty. This is in accord with our findings, albeit with a different ML algorithm. However, in previous research, but using a neural classifier, they had found calving season and gestation length to be the most effective predictors of calving difficulty (Zaborski and Grzesiak 2011). Some years later, they advocated calf sex as the most influential predictor for cows by using other artificial neural networks (Zaborski et al. 2018).
Along with calf sex, dry period and gestation length ranked second in the current study (see Table 2). Length of pregnancy has previously been reported as a risk factor for calving difficulty. Uematsu et al. (2013) found that the incidence rate of difficult calving in those cows that were pregnant for more than 301 days or less than 270 days was higher (odds ratio = 1.033, and 1.124 respectively) than in cows with a gestation length between 281 and 290 days. Probo et al. (2022) reported a probability of 1.22 for difficult calving for cows with a longer gestation length, and he also noted that gestation length and birth weight include direct maternal genetic components, which, in turn, provide additional information for predicting breeding value.
Evaluation of herd–cow factors as predictors of calving difficulty
The current study is based on an original, highly imbalanced set of data collected over 10 years from two commercial dairy farms in Iran. ML algorithms did not perform very well (in terms of F-measure) to predict calving difficulty. Similar to this study, Fenlon et al. (2017) reported a poor performance of ML algorithms to predict calving difficulty on an imbalanced dataset. They found 0%, 4.44%, and 5.26% for F-measure when conducting decision trees, multinomial regression, and random-forest ML algorithms on test data to predict difficult calving. One reason for these results might be the highly imbalanced nature of the dataset. This leads to biased classification towards the majority class and misclassification of minority cases, since ML algorithms build classification models by maximising accuracy (Das et al. 2018). In addition to the imbalance in the dataset, any poor results might be attributed to the high proportion of missing values for BCS, which is a critical risk factor for calving difficulty since body size is one of the main maternal factors that impose calving difficulty. In addition, cows that did not receive an appropriate diet and have a low BCS are more susceptible to difficult births, while, at the same time, cows that have been fed excessively, will likely have a higher birth-weight calf (Boakari and Ali 2021) and more fat deposition in the pelvic area, leading to difficult calving (Zaborski and Grzesiak 2011; Boakari and Ali 2021).
Balancing the dataset, success with the processed dataset
It has been reported that the adoption of sampling techniques is an effective way to deal with imbalanced datasets (Dubey et al. 2014). Tan et al. (2019) suggested that the use of a random forest with an up-sampling method was able to solve the classification imbalance problem and improve the performance of the algorithm. In Keshavarzi et al. (2020) study to predict abortion in Iranian Holstein cows, up-sampling and down-sampling methods were used to balance the dataset, and both sampling techniques significantly (P < 0.05) improved the prediction models. For the present study, two resampled datasets were generated by applying the down-sampling or the cost-sensitive techniques to the original dataset. Collectively, these three sets (one original plus two modified) were used to predict the likelihood of calving difficulty. There were significant improvements in the prediction models with both sampling techniques used to handle the imbalance in the original dataset (in terms of F-measure and AUC).
A cost-sensitive algorithm is another common method to deal with the problem of imbalanced classes (He et al. 2021). However, cost-sensitive algorithms are less likely to be implemented properly and often need to be reclassified because of unknown misclassifications. This is the main reason for preferring techniques such as up-sampling and down-sampling instead of cost-sensitive learning methods (Weiss et al. 2007). Despite their efficacy in handling imbalanced datasets, resampling techniques also have disadvantages as they remove potentially useful data through down-sampling and overfitting, by making exact copies of existing samples while oversampling (Weiss et al. 2007). Additionally, oversampling increases the number of training examples, making learning more time-consuming (Weiss et al. 2007; Dubey et al. 2014). Any resampling of a dataset may also affect the ranking of features and their potential effect on the resulting variables. On the contrary, Chawla (2010) reviewed various studies that have declared the better performance of up-sampling across the various possible resampling techniques.
General performance of different algorithms, and limitations of imbalanced dataset
Using a down-sampling method, logistic regression and naïve Bayes were the most accurate methods to predict calving difficulty. However, naive Bayes and decision tree were the most effective prediction methods to predict calving difficulty with the cost-sensitive method. In contrast with our study, Zaborski et al. (2018) found a low performance for the naïve Bayes algorithm in predicting difficult calving. Fenlon et al. (2017) found that the decision trees algorithm had the lowest AUC (0.64) and multinomial regression showed the best performance among ML algorithms with an AUC of 0.79 and low true positive rate (2%). Zaborski et al. (2018) indicated that logistic regression with 100% true negative rate, and 96% accuracy, although zero true positive rate, showed good performance when applied to a cost-sensitive balanced dataset. In another study, Zaborski et al. (2014) detected RF as an unsuitable algorithm for predicting calving difficulty, with 84% true positive rate, 60% accuracy, and 48% true negative rate. However, Fenlon et al. (2017) advocated for the RF algorithm in the prediction of difficult calving (Score 3), with a low true positive rate (2%), high accuracy (75%), and high precision (100%). Performing decision trees, Zaborski et al. (2016) could not predict even one calving difficulty event correctly. In Keshavarzi et al. (2020) to predict abortion, the Bayes algorithms (naïve Bayes and Bayesian network) showed no effects with the balanced or imbalanced type of data, while trees (DT and RF), and functions (LR and Neural network) performed better with balanced datasets. Overall, there is still considerable uncertainty about which type of sampling technique is best suited to each algorithm.
Conclusions
In this study, we addressed (1) the most important predictors for calving difficulty, (2) the performance of sampling techniques to handle the imbalanced dataset, and (3) the performance of different ML algorithms within different datasets. The most important variables for predicting calving difficulty were calving interval and calf bodyweight, indicating areas in which appropriate management programs would help producers reduce calving difficulty. Both sampling techniques used to handle the imbalance in the original dataset improved the predictive model. It is concluded that the down-sampling method significantly improved the performance of the algorithms and that among those that we used, decision tree with a true positive rate (TPR) of 59.2% had the best performance for predicting the rate and/or extent of calving difficulty. However, without down-sampling the original dataset, no significant performance difference was observed among the different algorithms. Considering that the performance of the decision tree was the highest (in terms of TPR) for down-sampled data and the computational load of a decision tree is less, it is suggested that the decision tree might be used when time is critical, or the amount of data is large. In general, even though it is complicated to work with reproductive disorders that have a low frequency (i.e. with imbalanced datasets), the prediction of calving difficulty with ML algorithms can be a way to improve the farm profitability as well as animal welfare.
Acknowledgements
The authors are grateful to the farmers to their contribution in this study. The authors are also grateful to Elham Askari (Isfahan University of Technology) for helping to collect data from one of the used dairy herds in this study.
References
Antanaitis R, Juozaitienė V, Malašauskienė D, Televičius M, Urbutis M, Baumgartner W (2021) Influence of calving ease on in-line milk lactose and other milk components. Animals 11, 842.
| Crossref | Google Scholar |
Atashi H, Abdolmohammadi A, Dadpasand M, Asaadi A (2012) Prevalence, risk factors and consequent effect of dystocia in Holstein dairy cows in Iran. Asian–Australasian Journal of Animal Sciences 25, 447-451.
| Crossref | Google Scholar |
Bekkar M, Djemaa HK, Alitouche TA (2013) Evaluation measures for models assessment over imbalanced data sets. Journal of Information Engineering and Applications 3, 27-38.
| Google Scholar |
Boakari YL, Ali HE-S (2021) Management to prevent dystocia. In ‘Bovine reproduction’. (Ed. RM Hopper) pp. 590–596. (John Wiley & Sons, Inc.) 10.1002/9781119602484.ch49
Breiman L (2001) Random forests. Machine Learning 45, 5-32.
| Crossref | Google Scholar |
Briggs WM, Zaretzki R (2008) The skill plot: a graphical technique for evaluating continuous diagnostic tests. Biometrics 64, 250-256.
| Crossref | Google Scholar |
Bureš D, Bartoň L, Zahrádková R, Teslík V, Fiedlerová M (2008) Calving difficulty as related to body weights and measurements of cows and calves in a herd of Gascon breed. Czech Journal of Animal Science 53, 187-194.
| Crossref | Google Scholar |
Dallago GM, Pacheco JAS, dos Santos RA, de Frias Castro GH, Verardo LL, Guarino LR, Moreira EU (2022) The relationship between dry period length and milk production of Holstein dairy cows in tropical climate: a machine learning approach. Journal of Dairy Research 89, 160-168.
| Crossref | Google Scholar |
Das S, Datta S, Chaudhuri BB (2018) Handling data irregularities in classification: foundations, trends, and future challenges. Pattern Recognition 81, 674-693.
| Crossref | Google Scholar |
De Amicis I, Veronesi MC, Robbe D, Gloria A, Carluccio A (2018) Prevalence, causes, resolution and consequences of bovine dystocia in Italy. Theriogenology 107, 104-108.
| Crossref | Google Scholar |
Dubey R, Zhou J, Wang Y, Thompson PM, Ye J, for the Alzheimer’s Disease Neuroimaging Initiative (2014) Analysis of sampling techniques for imbalanced data: an n = 648 ADNI study. NeuroImage 87, 220-241.
| Crossref | Google Scholar |
Eriksson S, Näsholm A, Johansson K, Philipsson J (2004) Genetic parameters for calving difficulty, stillbirth, and birth weight for Hereford and Charolais at first and later parities. Journal of Animal Science 82, 375-383.
| Crossref | Google Scholar |
Fenlon C, O’Grady L, Mee JF, Butler ST, Doherty ML, Dunnion J (2017) A comparison of 4 predictive models of calving assistance and difficulty in dairy heifers and cows. Journal of Dairy Science 100, 9746-9758.
| Crossref | Google Scholar |
Friedman N, Geiger D, Goldszmidt M (1997) Bayesian network classifiers. Machine Learning 29, 131-163.
| Crossref | Google Scholar |
Ghavi Hossein-Zadeh N (2016) Effect of dystocia on subsequent reproductive performance and functional longevity in Holstein cows. Journal of Animal Physiology and Animal Nutrition 100, 860-867.
| Crossref | Google Scholar |
He S, Li B, Peng H, Xin J, Zhang E (2021) An effective cost-sensitive XGBoost method for malicious URLs detection in imbalanced dataset. IEEE Access 9, 93089-93096.
| Crossref | Google Scholar |
Hempstalk K, McParland S, Berry DP (2015) Machine learning algorithms for the prediction of conception success to a given insemination in lactating dairy cows. Journal of Dairy Science 98, 5262-5273.
| Crossref | Google Scholar |
Hiew MWH, Megahed AA, Townsend JR, Singleton WL, Constable PD (2016) Clinical utility of calf front hoof circumference and maternal intrapelvic area in predicting dystocia in 103 late gestation Holstein-Friesian heifers and cows. Theriogenology 85, 384-395.
| Crossref | Google Scholar |
Jabeur SB, Sadaaoui A, Sghaier A, Aloui R (2020) Machine learning models and cost-sensitive decision trees for bond rating prediction. Journal of the Operational Research Society 71, 1161-1179.
| Crossref | Google Scholar |
Johanson JM, Berger PJ (2003) Birth weight as a predictor of calving ease and perinatal mortality in Holstein cattle. Journal of Dairy Science 86, 3745-3755.
| Crossref | Google Scholar |
Juozaitienė V, Juozaitis A, Kardisauskas A, Žymantienė J, Žilaitis V, Antanaitis R, Ruzauskas M (2017) Relationship between dystocia and the lactation number, stillbirth and mastitis prevalence in dairy cows. Acta Veterinaria Brno 86, 345-352.
| Crossref | Google Scholar |
Kerslake JI, Amer PR, O’Neill PL, Wong SL, Roche JR, Phyn CVC (2018) Economic costs of recorded reasons for cow mortality and culling in a pasture-based dairy industry. Journal of Dairy Science 101, 1795-1803.
| Crossref | Google Scholar |
Keshavarzi H, Sadeghi-Sefidmazgi A, Mirzaei A, Ravanifard R (2020) Machine learning algorithms, bull genetic information, and imbalanced datasets used in abortion incidence prediction models for Iranian Holstein dairy cattle. Preventive Veterinary Medicine 175, 104869.
| Crossref | Google Scholar |
López de Maturana E, Legarra A, Varona L, Ugarte E (2007) Analysis of fertility and dystocia in Holsteins using recursive models to handle censored and categorical data. Journal of Dairy Science 90, 2012-2024.
| Crossref | Google Scholar |
Malašauskienė D, Antanaitis R, Juozaitienė V, Paulauskas A, Urbonavičius G, Televicius M, Urbutis M, Kajokiene L, Yilmaz A, Baumgartner W (2022) Impact of calving difficulty on lameness in dairy cows. Agriculture 12, 960.
| Crossref | Google Scholar |
McGuirk BJ, Forsyth R, Dobson H (2007) Economic cost of difficult calvings in the United Kingdom dairy herd. Veterinary Record 161, 685-687.
| Crossref | Google Scholar |
McQueen RJ, Garner SR, Nevill-Manning CG, Witten IH (1995) Applying machine learning to agricultural data. Computers and Electronics in Agriculture 12, 275-293.
| Crossref | Google Scholar |
Mee JF (2004) Managing the dairy cow at calving time. Veterinary Clinics of North America: Food Animal Practice 20, 521-546.
| Crossref | Google Scholar |
Mee JF (2008) Prevalence and risk factors for dystocia in dairy cattle: a review. The Veterinary Journal 176, 93-101.
| Crossref | Google Scholar |
Mee JF, Berry DP, Cromie AR (2011) Risk factors for calving assistance and dystocia in pasture-based Holstein–Friesian heifers and cows in Ireland. The Veterinary Journal 187, 189-194.
| Crossref | Google Scholar |
Microsoft (2012) Microsoft SQL server management studio. Available at http://www8.cs.umu.se/education/examina/Rapporter/EsquiviasFlarup.pdf
Montazeri-Najafabadi M, Ghaderi-Zefrehei M (2021) Data mining of some factors affecting dystocia in Iranian dairy cows. Animal Production Research 10, 13-24.
| Crossref | Google Scholar |
Norman HD, Hutchison JL, Miller RH (2010) Use of sexed semen and its effect on conception rate, calf sex, dystocia, and stillbirth of Holsteins in the United States. Journal of Dairy Science 93, 3880-3890.
| Crossref | Google Scholar |
Probo M, Guadagnini M, Sala G, Amodeo P, Bolli A (2022) Calving ease risk factors and subsequent survival, fertility and milk production in Italian Holstein cows. Animals 12, 671.
| Crossref | Google Scholar |
Sadeghi-Sefidmazgi A, Moradi-Shahrbabak M, Nejati-Javaremi A, Miraei-Ashtiani SR, Amer PR (2012) Breeding objectives for Holstein dairy cattle in Iran. Journal of Dairy Science 95, 3406-3418.
| Crossref | Google Scholar |
Saito T, Rehmsmeier M (2015) The precision-recall plot is more informative than the ROC plot when evaluating binary classifiers on imbalanced datasets. PLoS ONE 10, e0118432.
| Crossref | Google Scholar |
Sampson DL, Parker TJ, Upton Z, Hurst CP (2011) A comparison of methods for classifying clinical samples based on proteomics data: a case study for statistical and machine learning approaches. PLoS ONE 6, e24973.
| Crossref | Google Scholar |
Shahinfar S, Page D, Guenther J, Cabrera V, Fricke P, Weigel K (2014) Prediction of insemination outcomes in Holstein dairy cattle using alternative machine learning algorithms. Journal of Dairy Science 97, 731-742.
| Crossref | Google Scholar |
Tan X, Su S, Huang Z, Guo X, Zuo Z, Sun X, Li L (2019) Wireless sensor networks intrusion detection based on SMOTE and the random forest algorithm. Sensors 19, 203.
| Crossref | Google Scholar |
Uematsu M, Sasaki Y, Kitahara G, Sameshima H, Osawa T (2013) Risk factors for stillbirth and dystocia in Japanese Black cattle. The Veterinary Journal 198, 212-216.
| Crossref | Google Scholar |
Vincze B, Gáspárdy A, Kézér FL, Pálffy M, Bangha Z, Szenci O, Kovács L (2018) Fetal metacarpal/metatarsal bone thickness as possible predictor of dystocia in Holstein cows. Journal of Dairy Science 101, 10283-10289.
| Crossref | Google Scholar |
Weiss GM, McCarthy K, Zabar B (2007) Cost-sensitive learning vs. sampling: which is best for handling unbalanced classes with unequal error costs? In ‘Proceedings of the 2007 International Conference on Data Mining, DMIN 2007, 25–28 June 2007, Las Vegas, Nevada, USA’.
| Google Scholar |
Weldeyohanes G, Fesseha H (2020) Dystocia in domestic animals and its management. International Journal of Pharmacy & Biomedical Research 7, 1-11.
| Google Scholar |
Witten IH, Frank E, Hall MA, Pal CJ (2017) ‘Data mining: practical machine learning tools and techniques.’ (Eds IH Witten, E Frank, MA Hall, CJ Pal) (Morgan Kaufmann: USA). Available at https://www.sciencedirect.com/science/article/pii/B9780128042915000052 [Accessed 1 January 2017]
Zaborski D, Grzesiak W (2011) Detection of difficult calvings in dairy cows using neural classifier. Archives Animal Breeding 54, 477-489.
| Crossref | Google Scholar |
Zaborski D, Grzesiak W, Kotarska K, Szatkowska I, Jedrzejczak M (2014) Detection of difficult calvings in dairy cows using boosted classification trees. Indian Journal of Animal Research 48, 452-458.
| Crossref | Google Scholar |
Zaborski D, Grzesiak W, Pilarczyk R (2016) Detection of difficult calvings in the Polish Holstein-Friesian Black-and-White heifers. Journal of Applied Animal Research 44, 42-53.
| Crossref | Google Scholar |
Zaborski D, Proskura WS, Grzesiak W (2018) The use of data mining methods for dystocia detection in Polish Holstein-Friesian Black-and-White cattle. Asian-Australasian Journal of Animal Sciences 31, 1700-1713.
| Crossref | Google Scholar |