

SNP associations and genetic-parameter estimation for nose and hoof pigmentation in Corriedale sheep
J. E. Aldersey A * , M. S. Khatkar A B , P. J. Blackwood C , C. E. Blackwood C , J. M. Pitchford A , H. Gordon A , S. C. Welsh A and W. S. Pitchford A
A Davies Livestock Research Centre, School of Animal and Veterinary Sciences, The University of Adelaide, Roseworthy, SA, Australia.
B Sydney School of Veterinary Science, The University of Sydney, Camden, NSW, Australia.
C Blackwood Corriedales, Harland Rise, Evandale, Tas., Australia.
Animal Production Science 63(11) 1136-1147 https://doi.org/10.1071/AN22462
Submitted: 14 December 2022 Accepted: 15 May 2023 Published: 7 June 2023
© 2023 The Author(s) (or their employer(s)). Published by CSIRO Publishing. This is an open access article distributed under the Creative Commons Attribution 4.0 International License (CC BY)
Abstract
Context: Quantity and quality of both meat and wool are important for selection programs of the dual-purpose Corriedale sheep. In Corriedales, black pigmentation of nose skin and hooves is preferred as part of the breed standard. However, within the breed, pigmentation can vary from none to complete pigmentation.
Aims: The aim was to discover single-nucleotide polymorphisms (SNPs) and genes associated with nose and hoof pigmentation and to estimate genetic parameters of nose and hoof pigmentation, wool traits and meat traits.
Methods: The phenotype and genotype data on Corriedale lambs (n = 764) produced from 44 sires (12 studs) and 300 ewes in 2017–2019 were used in this study. Lambs were slaughtered at 6–7 months of age. Nose pigmentation and hoof pigmentation were scored on a five-point scale, where no pigmentation was scored 0 and complete pigmentation was scored 5. Wool- and meat-quality traits were measured, including greasy fleece weight, fibre diameter, weaning weight, hot standard carcass weight and intramuscular fat percentage. The lambs were genotyped with the GGPOvine50K SNP chip. A genome-wide association study (GWAS) was conducted. Genetic parameters and bivariate analyses were estimated using ASReml-R.
Results: The lambs had a mean nose-pigmentation score of 3.69 and hoof-pigmentation score of 4.12. The nose pigmentation (h2 = 0.58) and hoof pigmentation (h2 = 0.51) were highly heritable and highly correlated (rG = 0.73). The GWAS identified a genome-wide significant SNP (OAR19_33278780.1) associated with nose pigmentation (q-value = 0.04). This SNP is positioned in a known pigmentation gene, melanocyte-inducing transcription factor (MITF). The same SNP was the sixth-most associated SNP for hoof pigmentation but did not reach significance level. OAR19_33278780.1 also had a significant effect on back conformation and weaning weight.
Conclusions: The results of these analyses have provided information and an understanding of the genetics for pigmentation of nose and hooves in Corriedale sheep.
Implications: Nose and hoof pigmentation are highly genetically correlated with each other, but with no negative effects on production traits.
Keywords: Corriedale, hoof, meat quality, MITF, nose skin, Ovis aries, pigment, wool quality.
Introduction
Corriedales are a composite breed developed in the late-1800s in Australia and New Zealand, from crossing Lincoln or Leicester rams with Merino sheep (Marshall 1916; Meat and Livestock Australia 2006). Corriedales are a dual-purpose breed that are farmed for both meat and wool production. Therefore, improved meat-quality and wool-quality traits are desired. Corriedale sheep also have black-pigmented hooves and nose skin likely inherited from Lincoln or English Leicester rams (Marshall 1916). These traits were selected because pigmentation of the hooves may contribute to animal health and wellbeing (Scobie et al. 2017), and nose pigmentation tends to indicate pigmentation of hooves. It is assumed by producers that animals with pigmented hooves are less susceptible to hoof conditions than are animals with no hoof pigmentation or white hooves (Scobie et al. 2017). Black hooves may provide better protection as more force is required to puncture black hooves than white hooves; however, other mechanical tests have found no difference between black and white hoof material (Scobie et al. 2017). Black hooves are also thought to be associated with better resistance to internal parasites. Internal-parasite burdens are more prevalent in high-rainfall, pasture systems (Larsen 2014) where Corriedale sheep are usually raised in Australia.
One earlier study investigated the genetic basis of nose and hoof pigmentation in a quantitative trait-loci (QTL) mapping experiment of Awassi-cross super-fine Merino sheep back-crossed with Merino (n = 177). QTLs on Chromosomes 2 and 19 were significantly associated with both traits (Raadsma et al. 2013). An additional loci on Chromosome 13 was also identified for nose pigmentation and a loci on Chromosome 6 for hoof pigmentation (Raadsma et al. 2013). These QTLs for nose and hoof pigmentation harbour the genes TYRP1 (chr2), KIT (chr6), ASIP (chr13) and MITF (chr19) (Raadsma et al. 2013).
Pigmentation of hooves and nose skin in Corriedale sheep has not been studied. Within the breed, nose and hoof pigmentation can vary from no pigmentation to complete pigmentation. The aim of this study was to perform an extensive genome-wide association analysis to pinpoint significant single-nucleotide polymorphisms (SNPs) and genes associated with pigmentation traits. Genetic parameters for nose and hoof pigmentation, wool characteristics, and meat-production traits were also estimated.
Materials and methods
Animals
The data analysed were collected as part of the project initiated by the Performance Corriedale Group to improve this breed (Blackwood et al. 2021). Corriedale lambs (n = 764) were produced from three rounds of artificial insemination and one natural mating from April 2017 to 2019 (birth group). The matings resulted in 1–60 progeny per sire (n = 44). Sex, number of lambs born per ewe (type of birth), number of lambs reared per ewe (type of rearing), and slaughter date were recorded. Animals were kept on a commercial property in Evandale, Tasmania. Animal ethics approval was not required as measurements were normal management operations and, therefore, exempted.
Measures
Visual scores, wool-production, wool-quality, meat-production and meat-quality traits were measured as described in Table 1. Visual scores included nose pigmentation (NOSEP), hoof pigmentation (HVSP), face cover (FC), back conformation (BACK), and body wrinkle score (BDWR). All visual scores were based on a 1–5 scoring system (Australian Wool Innovation and Meat and Livestock Australia 2013) and were scored by two or three scorers. The mean of these scores was used in the analysis. Pre-slaughter measures were weaning weight at ~5 months of age (WWT), post-weaning weight (PWWT) at ~6–7 months of age, scanned eye-muscle depth (PEMD), scanned fat depth (PFat) and height (Ht). PEMD and PFat were measured using an ultrasound scanner. Ht was measured from the ground to withers. Post-slaughter measures included eye-muscle depth (EMD), eye-muscle width (EMW), eye-muscle area (EMA), hot standard carcass weight (HSCW), fat depth (GRFat), shear force of Longissimus lumborum (SF5) and intramuscular-fat percentage (IMF). SF5 was measured, with six replications, by using a Lloyd texture analyser fitted with a Warner–Bratzler head. Intramuscular fat (IMF) was measured in Longissimus lumborum via chemical extraction. Wool-quality traits included greasy fleece weight (GFW), percentage of fibres under 30 microns (CF), wool-staple length (SL), staple-structure score (SSTRC), wool colour score (COL) and wool character score (CHAR).
| Trait | Abbreviation | Unit | Description |
|---|---|---|---|
| Greasy fleece weight | GFW | kg | Weight of fleece after shearing |
| Fibre diameter | FD | Um | Fibre thickness |
| Comfort factor | CF | % | Fibres less than 30 micron |
| Staple length | SL | mm | Average fibre length |
| Weaning weight | WWT | kg | Lamb weight at weaning ~5 months of age |
| Post-weaning weight | PWWT | kg | Lamb weight post-weaning ~6 months of age |
| Height | Ht | cm | Height measured from withers to ground |
| Eye-muscle depth (scanned) | PEMD | mm | Measured using ultrasound |
| Fat depth (scanned) | PFat | mm | Measured using ultrasound |
| Hot standard carcass weight | HSCW | kg | Dressed carcass weight |
| Eye-muscle depth | EMD | mm | Measured with digital callipers to two decimal places |
| Eye-muscle width | EMW | mm | Measured with digital callipers to two decimal places |
| Eye-muscle area | EMA | cm2 | Multiplication of depth × width with no adjustment for shape |
| GR fat depth | GRFat | mm | Fat depth 110 mm from the backbone at 12th rib |
| Intramuscular fat | IMF | % | Intramuscular fat (%) of Longissimus lumborum measured by chemical extraction |
| Shear force | SF5 | N | Force required to penetrate through Longissimus lumborum, measured using a lloyd texture analyser fitted with Warner–Bratzler head. Replicated six times, mean value reported |
| Nose skin pigmentation | NOSEP | Score (1–5) | 1 = no pigmented area; 2 = 1–20% pigmented area; 3 = 21–40% pigmented; 4 = 41–70% pigmented; 71–100% pigmented |
| Hoof pigmentation | HVSP | Score (1–5) | 1 = no pigmented area; 2 = 1–20% pigmented area; 3 = 21–40% pigmented; 4 = 41–70% pigmented; 71–100% pigmented |
| Wool colour | COL | Score (1–5) | 1 = bright white wool; 2 = off white wool 3 = mild yellow wool; 4 = intense yellow wool; 5 = very intense yellow wool |
| Character | CHAR | Score (1–5) | 1 = very well defined crimp; 2 = well defined crimp; 3 = crimp definition is lacking; 4 = crimp definition is severely lacking and the staples start to look ‘flat’; 5 = no crimp definition and as a result looks ‘flat’. |
| Staple structure | SSTRC | Score (1–5) | 1 = staple comprises very fine bundles, i.e. staple width of less than 6 mm in diameter; 2 = staple comprises fine bundles i.e. staple width of 6–10 mm in diameter; 3 = staple comprises medium bundles i.e. staple width of 11–20 mm in diameter.; 4 = staple comprises large bundles i.e. staple width of 21–30 mm in diameter; 5 = staple comprises ‘blocky’, extremely large bundles, i.e. staple width of greater than 30 mm in diameter |
| Face cover | FACE | Score (1–5) | 1 = open face with no wool in front of the ears and topknot, or on the jowls; 2 = wool cover over the top of head, some on the side of muzzle, but not joined between the ears and eyes; 3 = wool cover over the top of head and on the side of muzzle, wool joined between the ears and eyes; 4 = wool cover from the top of the head down the muzzle, clear channel remains between the eye and the mouth; 5 = heavy wool growth over the entire face with the exception of the eyes, nose and mouth areas, wool from the top and side of the muzzle joining |
| Body wrinkle | BDWR | Score (1–5) | 1 = plain-bodied sheep with no body wrinkle; 2 = plain-bodied sheep with a few small wrinkles over the body; 3 = slight wrinkling over the body; 4 = heavy wrinkling over the body; 5 = very heavy wrinkling and heavy folds of skin over the body |
| Back conformation | BACK | Score (1–5) | 1 = extremely ‘dipped’ backline; 3 = straight between shoulders and back; 5 = extremely ‘arched’ backline |
Genomic relationship matrix
The 764 lambs were genotyped using the Illumina OvineSNP50 BeadChip. The SNPs with a minor allele frequency of <0.01, and on the X and Y chromosome, were removed. The SNP data were used to construct a genomic relationship matrix (GRM) by using VanRaden’s first method (VanRaden 2008).
Heritabilities, genetic and phenotypic correlations
Univariate and bivariate analyses were conducted using ASReml-R (ASReml, version 4.1.0; Butler et al. 2018; https://asreml.kb.vsni.co.uk/) in R (version 4.2.1). One of three models was fitted to the traits (Table 2) and the levels of fixed effects are described in Table 3. The GRM was fitted as a random effect in each model. Sex was recorded directly from the lambs or, if it was not recorded, it was inferred using genotype information. For carcass traits, contemporary group was defined as a function of birth group and kill date. Specifically, one cohort (2019A) was slaughtered on two different days. Heterozygosity for each sample was estimated from the genotype data as the average heterozygosity across all SNPs.
| Trait | Fixed effects | Random effects |
|---|---|---|
| Wool measures and live-animal traits | Type of birth × type of rearing, birth group, sex, heterozygosity | GRM |
| Carcass and eating-quality traits | Type of birth × type of rearing, contemporary group × slaughter date, sex, heterozygosity | GRM |
| Visual scores | Type of birth × type of rearing, birth group, sex, heterozygosity | GRM |
GRM, genomic relationship matrix.
| Fixed effect | Level | Definition |
|---|---|---|
| Type of birth × type of rearing | 11 | Born as single, raised as single |
| 21 | Born as twin, raised as single | |
| 22 | Born as twin, raised as twin | |
| 31 | Born as triplet, raised as single | |
| 32 | Born as triplet, raised as twin | |
| 33 | Born as triplet, raised as triplet | |
| Sex | F | Female |
| M | Male | |
| Birth group | 2017 | Born in 2017 |
| 2018 | Born in 2018 | |
| 2019A | Born in 2019 | |
| 2019B | Born in 2019 (natural mating) | |
| Contemporary group | 2017 | Born in 2017; slaughtered in 2018 |
| 2018 | Born in 2018; slaughtered in 2019 | |
| 2019A1 | Born in 2019; slaughtered in 2020, Group 1 | |
| 2019A2 | Born in 2019; slaughtered in 2020, Group 2 | |
| 2019B | Born in 2019; slaughtered in 2020 | |
| Slaughter date | 18 April 2018 | |
| 19 April 2018 | ||
| 10 April 2019 | ||
| 1 April 2020 | ||
| 29 April 2020 |
Genome-wide association study
A genome-wide association study (GWAS) was conducted to identify regions associated with nose and hoof pigmentation. A mixed model was used to test association of pigmentation scores with the alleles of SNP genotype. All SNPs across the genome (Oar_v3.1) were tested with one SNP in the model at a time in the model. The model was fitted using GCTA software (Yang et al. 2011), by using the following model:
In this model, y represents the quantitative score, a is the mean term, c represents effect of fixed effect z, b is the additive effect of a SNP tested for association, x denotes the genotype indicator variable coded as 0, 1 or 2, g is the polygenic effect (random effect) captured by the GRM, calculated using all autosomal SNPs, and e is the residual. The fixed effects were as described in the section above.
The P-values and effect size for all SNPs across the genome were estimated. The genome-wide false-discovery rate (FDR) was computed using the q-value package (Storey and Tibshirani 2003) of Bioconductor. A q-value is a measure used to estimate the FDR, representing the proportion of false positives among significant results in multiple hypothesis-testing scenarios. Chromosome-wide and genome-wide Manhattan plots of P-values were generated to identify key regions associated with the pigmentation traits.
Association of most significant SNPs with other traits
The univariate analyses were conducted by including the genotype of the top significant SNP to analyse the associations with other traits. The ASReml-R function wald.asreml() was used to determine the significance of the genotype on the traits. Significance was defined as P < 0.05. The size of the SNP effect was also obtained from the analyses.
Results
Descriptive statistics
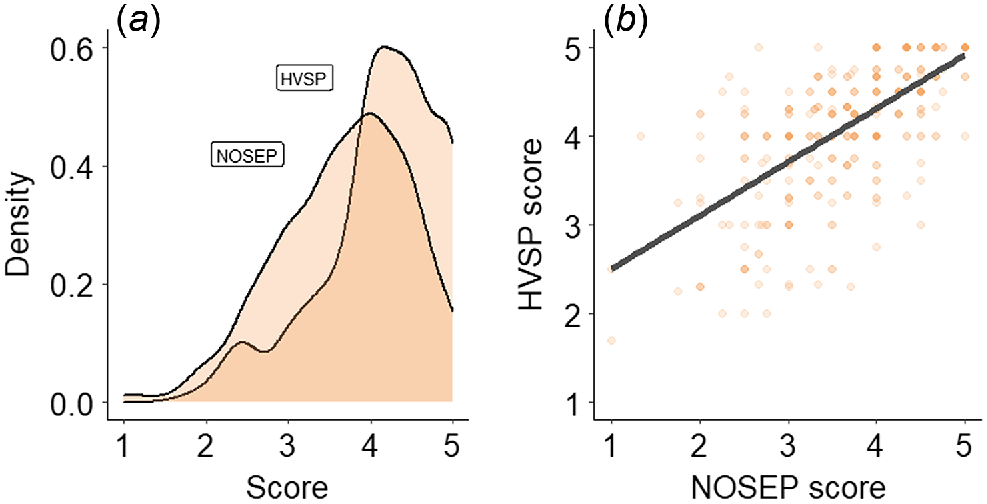
The mean and coefficient of variance for each trait are presented in Table 4. NOSEP scores of individual animals ranged from one to five (Fig. 1a), with an overall mean score of 3.69. HVSP scores of individual animals ranged from 1.7 to 5.0, with an overall mean score of 4.12. NOSEP and HVSP were positively correlated (Fig. 1b).
| Trait (unit) | n | Mean | CV | Minimum | Maximum |
|---|---|---|---|---|---|
| GFW (kg) | 551 | 1.81 | 0.21 | 0.6 | 3 |
| FD (μm) | 551 | 23.07 | 0.08 | 18.2 | 29.3 |
| CF (%) | 551 | 93.43 | 0.07 | 55.8 | 99.9 |
| SL (mm) | 316 | 49.16 | 0.18 | 25 | 70 |
| PWWT (kg) | 644 | 39.62 | 0.14 | 21 | 55 |
| WWT (kg) | 745 | 32.67 | 0.23 | 13.6 | 54.5 |
| Ht (cm) | 341 | 65.30 | 0.05 | 53 | 73 |
| HSCW (kg) | 736 | 20.64 | 0.17 | 11.3 | 32.9 |
| PEMD (mm) | 731 | 26.39 | 0.10 | 17.5 | 37 |
| EMD (mm) | 436 | 29.32 | 0.11 | 20 | 45 |
| EMW (mm) | 436 | 54.39 | 0.07 | 45 | 65.99 |
| EMA (cm2) | 436 | 12.78 | 0.14 | 7.68 | 18.408 |
| PFat (mm) | 731 | 3.52 | 0.26 | 2 | 7.5 |
| GRFat (mm) | 435 | 7.46 | 0.75 | 0.5 | 25 |
| IMF (%) | 732 | 4.65 | 0.32 | 1.43 | 11.61 |
| SF5 (N) | 714 | 39.42 | 0.34 | 16.96 | 99.26 |
| NOSEP (1–5 score) | 366 | 3.69 | 0.22 | 1 | 5 |
| HVSP (1–5 score) | 366 | 4.12 | 0.18 | 1.7 | 5 |
| COL (1–5 score) | 573 | 2.29 | 0.34 | 1 | 5 |
| SSTRC (1–5 score) | 574 | 2.62 | 0.25 | 1 | 4.3 |
| CHAR (1–5 score) | 573 | 2.69 | 0.23 | 1 | 4.3 |
| FACE (1–5 score) | 571 | 2.68 | 0.21 | 1 | 4.75 |
| BDWR (1–5 score) | 547 | 1.33 | 0.40 | 1 | 4 |
| BACK (1–5 score) | 366 | 1.54 | 0.41 | 1 | 3.7 |
NOSEP, nose pigmentation; HVSP, hoof pigmentation; GFW, greasy fleece weight; FD, fibre diameter; CF, comfort factor; SL, staple length; PWWT, post-weaning weight; WWT, weaning weight; Ht, height; HSCW, hot standard carcass weight; PEMD, eye-muscle depth ultrasound scan; EMD, eye-muscle depth; EMW, eye-muscle width; EMA, eye-muscle area; PFat, fat depth ultrasound scan; GRFat, fat depth at 12th rib; IMF, intramuscular fat; SF5, shear force; COL, wool-colour score; SSTRC, wool-staple structure; CHAR, wool character; FACE, wool face cover; BDWR, body wrinkle; BACK, back conformation.
Genome-wide association study
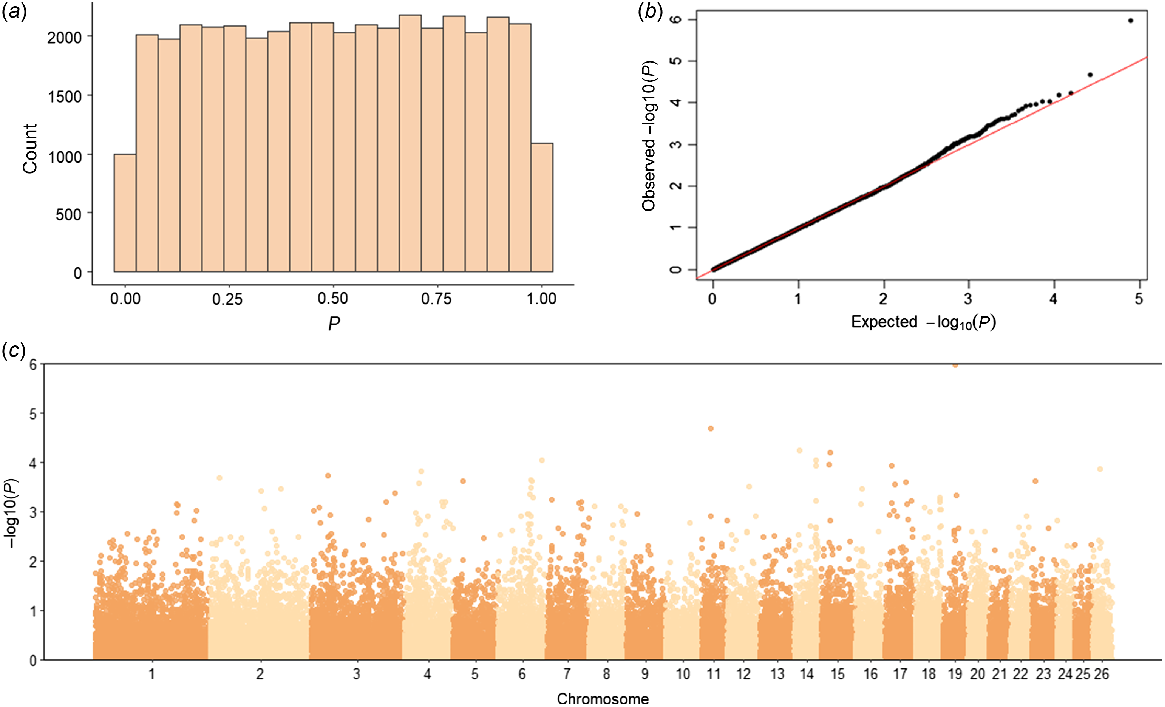
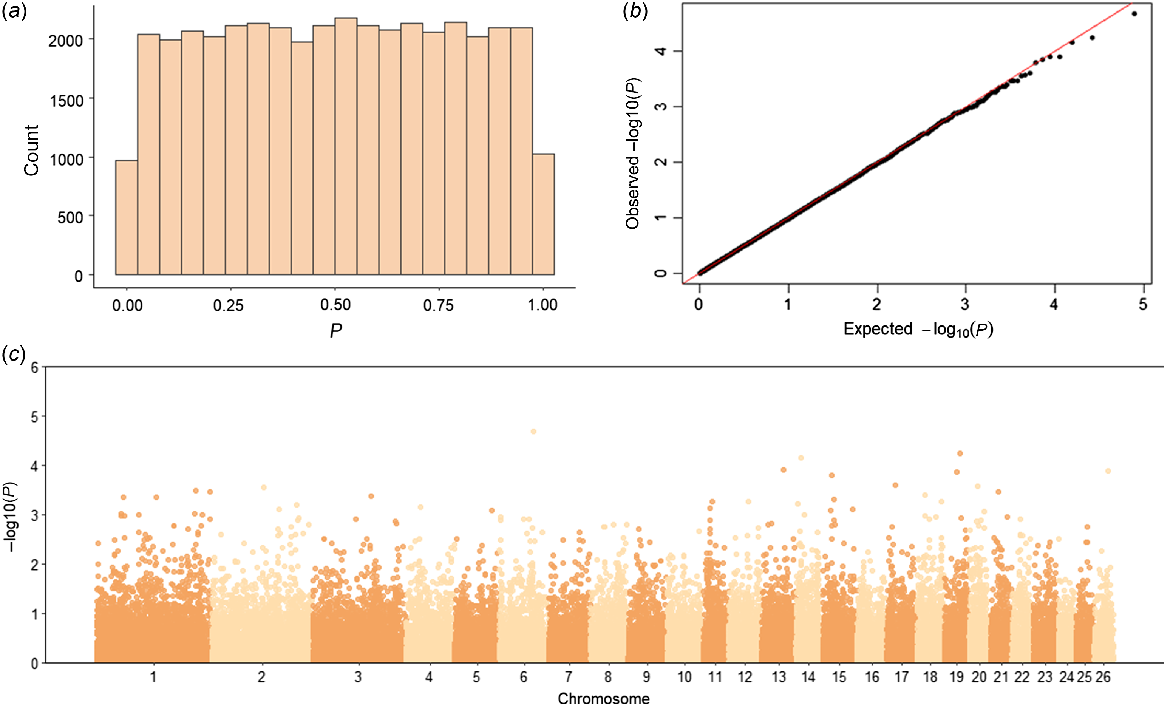
The genome-wide association analysis tested a total of 39 484 SNPs for their association with NOSEP and HVSP. For NOSEP, after adjusting for FDR, there was only one significant SNP (OAR19_33278780.1; q-value = 0.042, P = 0.000001) on Chromosome 19 (chr19:31614145, Oar_v4.0; Fig. 2, Table 5). OAR19_33278780.1 (rs419333175) SNP is located within the gene melanocyte-inducing transcription factor (MITF), which is known to be involved in pigmentation. No significant SNPs associated with HVSP were found (Fig. 3). However, OAR19_33278780.1 was the sixth-most significant SNP for HVSP, but remained below the significance threshold of the q-value of <0.05 (Table 5).
Genome-wide association study results for nose pigmentation in Corriedale sheep. (a) Histogram of P-values, (b) QQ-plot of P-values and (c) Manhattan plot of −log10P-values. The P-values in the Manhattan plot are plotted by chromosome and the horizontal line indicates genome-wide significance (P = 5 × 10⁻⁶). Only one SNP was significant for NOSEP on Chromosome 19 (q-value = 0.042).
| Chr | SNP name | Minor allele frequency | SNP effect size | s.e. | P-value | q-value |
|---|---|---|---|---|---|---|
| NOSEP | ||||||
| 6 | OAR6_115827874.1 | 0.36 | 0.24 | 0.063 | 0.000091 | 0.53 |
| 11 | oar3_OAR11_25301463 | 0.02 | −0.95 | 0.223 | 0.000021 | 0.41 |
| 14 | Chr14:14283245 | 0.14 | −0.34 | 0.085 | 0.000058 | 0.53 |
| 14 | oar3_OAR14_56359275 | 0.21 | −0.28 | 0.072 | 0.000091 | 0.53 |
| 14 | OAR14_57012757.1 | 0.4 | −0.24 | 0.062 | 0.00012 | 0.53 |
| 15 | Chr15:23406267 | 0.28 | −0.27 | 0.066 | 0.000064 | 0.53 |
| 15 | OAR15_22081912.1 | 0.46 | −0.24 | 0.062 | 0.00011 | 0.53 |
| 17 | Chr17:16013001 | 0.03 | −0.75 | 0.19 | 0.00012 | 0.53 |
| 19 | OAR19_33278780.1 | 0.05 | −0.69 | 0.14 | 1.1E-06 | 0.04* |
| 26 | OAR26_21018684.1 | 0.27 | −0.26 | 0.068 | 0.00014 | 0.55 |
| HVSP | ||||||
| 2 | oar3_OAR2_134146443 | 0.24 | −0.24 | 0.066 | 0.00028 | 0.97 |
| 6 | oar3_OAR6_89367464 | 0.04 | −0.66 | 0.155 | 0.00002 | 0.84 |
| 13 | oar3_OAR13_55804408 | 0.4 | −0.23 | 0.06 | 0.00012 | 0.91 |
| 14 | Chr14:14283245 | 0.14 | −0.31 | 0.079 | 0.00007 | 0.91 |
| 15 | Chr15:23406267 | 0.28 | −0.23 | 0.062 | 0.00016 | 0.91 |
| 17 | oar3_OAR17_22491315 | 0.07 | −0.42 | 0.113 | 0.00025 | 0.97 |
| 19 | OAR19_41399545.1 | 0.27 | −0.26 | 0.063 | 0.00006 | 0.91 |
| 19 | OAR19_33278780.1 | 0.05 | −0.5 | 0.13 | 0.00014 | 0.91 |
| 20 | oar3_OAR20_20498243 | 0.47 | −0.22 | 0.061 | 0.00027 | 0.97 |
| 26 | oar3_OAR26_35076973 | 0.38 | −0.22 | 0.058 | 0.00013 | 0.91 |
Chr, chromosome; s.e., standard error of effect size; NOSEP, nose-pigmentation score; HVSP, hoof-pigmentation score.
*q < 0.05.
Genome-wide association study results for hoof pigmentation in Corriedale sheep. (a) Histogram of P-values, (b) qq-plot of P-values and (c) Manhattan plot of −log10P-values. The P-values in the Manhattan plot are plotted by chromosome and the horizontal line indicates genome-wide significance (P = 5 × 10⁻⁶).
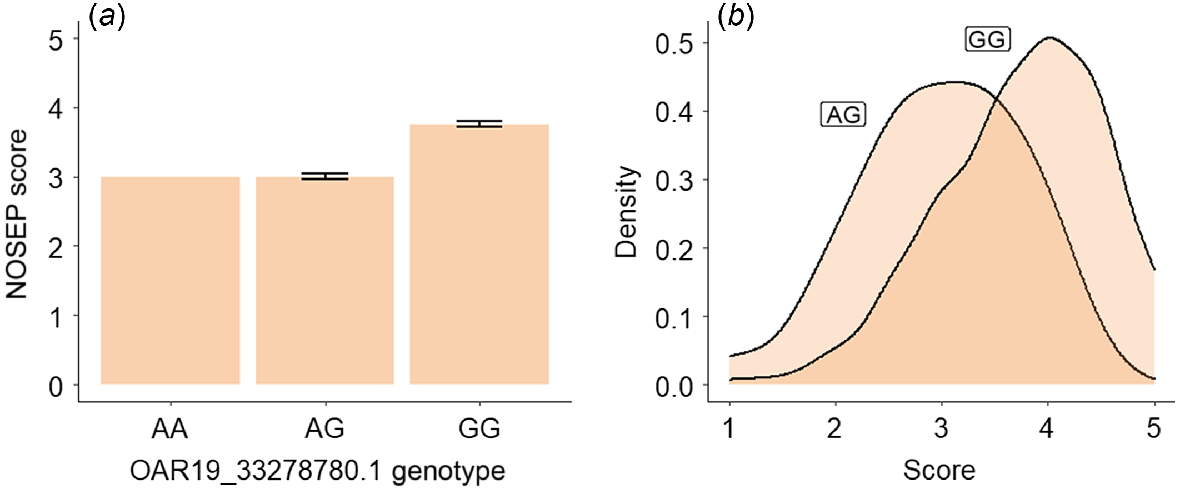
Of the lambs with NOSEP scores, there were 333 lambs with genotype GG, 32 with the genotype AG and only one lamb with the genotype AA of the OAR19_33278780 SNP. Lambs with the genotype GG at OAR19_33278780.1 SNP had a NOSEP mean score (3.75 ± 0.04 [s.e.]) 25% higher than for lambs with the genotype AG (3 ± 0.04), indicating that they had greater pigmentation (Fig. 4). Approximately 40% of lambs with the genotype AG had a NOSEP score of 3, while approximately half of the sheep with the genotype GG had a NOSEP score of 4 (Fig. 4b).
Effects of OAR19_33278780.1 genotypes on other measured traits
The genotype of OAR19_33278780.1 was added as a fixed factor in the univariate models and Wald tests were performed to determine effects of the genotype of this SNP on the wool, meat traits and visual scores. The genotypes for OAR19_33278780.1 were AA (n = 1), AG (n = 60) or GG (n = 736). The genotype at OAR19_33278780.1 was not significant for any of the visual scores. The genotype was significant for WWT (P = 0.01) and PWWT (P = 0.01), where GG was associated with higher weights. The genotype at OAR19_33278780.1 did not have a significant effect on the remaining traits.
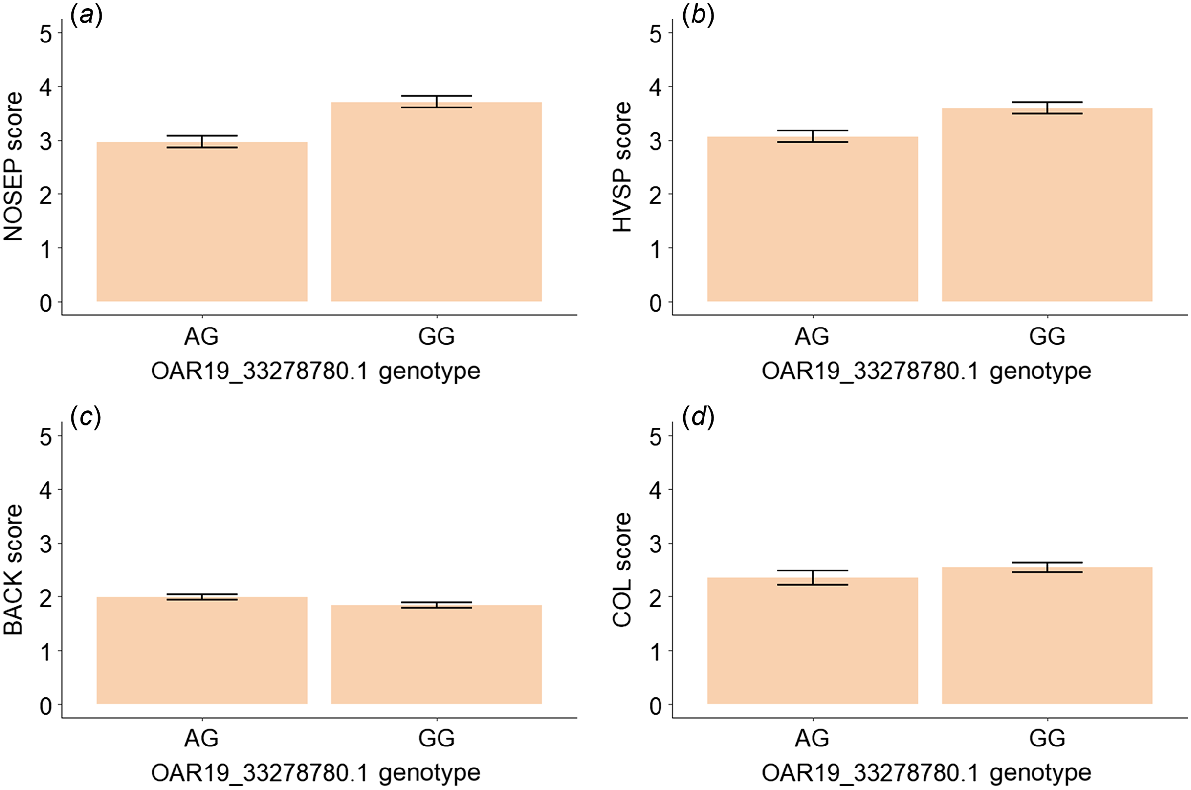
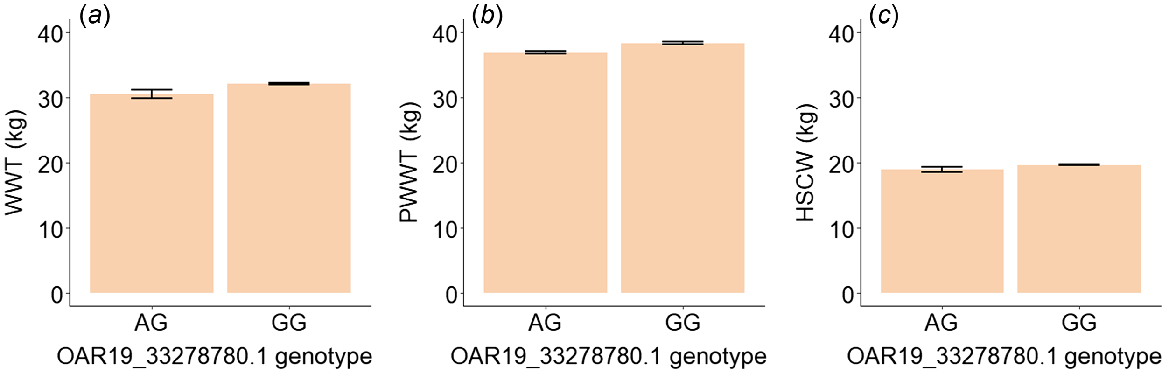
An additional analysis was conducted by excluding the single lamb with the genotype AA. The genotype at OAR19_33278780.1 was significant for visual score, BACK (P = 0.02), and marginally significant for COL (P = 0.053, Table 6). Lambs with the genotype GG had 24.9% higher nose skin-pigmentation scores (darker pigmentation), 17.3% higher hoof-pigmentation scores (darker pigmentation), 7.0% lower scores for backline (more dipped) and 8.1% higher wool-colour scores (more yellow) than those with the genotype AG (Fig. 5, Table 6). The genotype at OAR19_33278780.1 was significant for WWT (P = 0.03) and close to significance level for PWWT (P = 0.06) and HSCW (P = 0.07) (Fig. 6, Table 6). Lambs with the genotype GG had 4.9% higher weaning weight, 3.9% higher post-weaning weight and 3.7% higher carcass weight (Fig. 3c, d, Table 6). The estimated means for these traits are given in Table 6.
Estimated means and standard errors for (a) nose-pigmentation (NOSEP) score, (b) hoof-pigmentation (HVSP) score, (c) back-conformation (BACK) score and (d) wool-colour (COL) score (yellowness) for sheep with genotypes AG and GG at OAR19_33278780.1.
Estimated means and standard errors for (a) weaning weight (WWT, kg), (b) post-weaning weight (PWWT, kg) and (c) hot standard carcass weight (HSCW, kg) for sheep with genotypes AG and GG at SNP OAR19_33278780.1.
| Trait | Genotype | Estimated mean | s.e. | Effect size | Mean difference (%) | Significance |
|---|---|---|---|---|---|---|
| WWT | AG | 30.59 | 0.65 | 0 | 4.90 | 0.027* |
| GG | 32.09 | 0.17 | 1.58 | |||
| PWWT | AG | 36.89 | 0.17 | 0 | 3.88 | 0.059 |
| GG | 38.32 | 0.17 | 1.47 | |||
| HSCW | AG | 18.93 | 0.36 | 0 | 3.75 | 0.069 |
| GG | 19.64 | 0.09 | 0.709 | |||
| COL | AG | 2.35 | 0.13 | 0 | 8.09 | 0.053 |
| GG | 2.54 | 0.09 | 0.19 | |||
| BACK | AG | 1.99 | 0.05 | 0 | −7.04 | 0.024* |
| GG | 1.85 | 0.05 | −0.14 |
WWT, weaning weight; PWWT, post-weaning weight; HSCW, hot standard carcass weight; COL, wool-colour score; BACK, back conformation.
*P < 0.05.
Heritability estimates
The heritability estimates for different traits included in this study are presented in Table 7. NOSEP (h2 = 0.58) and HVSP (h2 = 0.51) were highly heritable, but the other visual scores were low to moderately heritable (h2 = 0.17–0.44). Wool measures, GFW (h2 = 0.80), FD (h2 = 0.82) and CF (h2 = 0.60) had high heritability estimates (Table 7), while staple length had a low heritability (h2 = 0.20). The meat-production and eating-quality traits, PWWT, WWT, Ht, HSCW, EMW, PFat and GRFat, had high heritability estimates, whereas PEMD, EMD, EMA and IMF had moderate heritability estimates and, SF5 had a low heritability estimate.
| Trait | h2 ± s.e | VP | NOSEP | HVSP | ||
|---|---|---|---|---|---|---|
| rP ± s.e. | rG ± s.e. | rP ± s.e. | rG ± s.e. | |||
| NOSEP | 0.58 ± 0.15 | 0.59 | – | – | 0.62 ± 0.04 | 0.73 ± 0.13 |
| HVSP | 0.51 ± 0.16 | 0.50 | 0.62 ± 0.04 | 0.73 ± 0.13 | – | – |
| GFW | 0.80 ± 0.10 | 0.09 | 0.08 ± 0.06 | −0.21 ± 0.18 | 0.03 ± 0.06 | −0.24 ± 0.19 |
| FD | 0.82 ± 0.10 | 3.13 | 0.08 ± 0.06 | 0.01 ± 0.18 | 0.00 ± 0.06 | 0.00 ± 0.19 |
| CF | 0.60 ± 0.11 | 37.20 | −0.08 ± 0.06 | −0.01 ± 0.2 | −0.02 ± 0.06 | −0.02 ± 0.21 |
| SL | 0.20 ± 0.14 | 26.48 | −0.28 ± 0.10 | −0.33 ± 0.35 | −0.15 ± 0.11 | −0.37 ± 0.42 |
| PWWT | 0.68 ± 0.10 | 26.48 | 0.00 ± 0.07 | −0.35 ± 0.19 | −0.07 ± 0.07 | −0.46 ± 0.18 |
| WWT | 0.60 ± 0.09 | 22.29 | 0.02 ± 0.06 | −0.25 ± 0.18 | −0.06 ± 0.06 | −0.44 ± 0.17 |
| Ht | 0.56 ± 0.16 | 6.33 | −0.07 ± 0.10 | −0.27 ± 0.28 | 0.00 ± 0.10 | −0.62 ± 0.25 |
| HSCW | 0.63 ± 0.09 | 7.37 | −0.03 ± 0.06 | −0.17 ± 0.18 | −0.12 ± 0.06 | −0.37 ± 0.17 |
| PEMD | 0.47 ± 0.09 | 5.95 | 0.03 ± 0.06 | −0.22 ± 0.19 | −0.07 ± 0.06 | −0.38 ± 0.18 |
| EMD | 0.21 ± 0.11 | 9.01 | −0.08 ± 0.07 | −0.35 ± 0.28 | −0.15 ± 0.07 | −0.72 ± 0.20 |
| EMW | 0.60 ± 0.13 | 12.10 | −0.02 ± 0.07 | −0.16 ± 0.21 | −0.04 ± 0.07 | −0.15 ± 0.24 |
| EMA | 0.47 ± 0.14 | 3.02 | −0.07 ± 0.07 | −0.33 ± 0.22 | −0.15 ± 0.07 | −0.58 ± 0.18 |
| PFat | 0.50 ± 0.10 | 0.79 | −0.05 ± 0.06 | −0.36 ± 0.17 | −0.14 ± 0.06 | −0.50 ± 0.17 |
| GRFat | 0.51 ± 0.14 | 6.73 | −0.07 ± 0.06 | −0.24 ± 0.23 | −0.12 ± 0.06 | −0.41 ± 0.19 |
| IMF | 0.46 ± 0.10 | 0.85 | −0.01 ± 0.06 | −0.24 ± 0.19 | −0.19 ± 0.06 | −0.59 ± 0.16 |
| SF5 | 0.16 ± 0.08 | 165.06 | −0.02 ± 0.06 | 0.31 ± 0.28 | −0.03 ± 0.06 | 0.23 ± 0.31 |
| COL | 0.44 ± 0.10 | 0.39 | 0.18 ± 0.06 | 0.30 ± 0.20 | 0.04 ± 0.06 | −0.22 ± 0.22 |
| SSTRC | 0.26 ± 0.09 | 0.33 | 0.05 ± 0.06 | −0.28 ± 0.23 | 0.00 ± 0.06 | −0.21 ± 0.26 |
| CHAR | 0.44 ± 0.11 | 0.35 | −0.02 ± 0.06 | −0.14 ± 0.23 | −0.07 ± 0.06 | −0.53 ± 0.22 |
| FACE | 0.37 ± 0.11 | 0.30 | 0.11 ± 0.06 | 0.55 ± 0.18 | 0.15 ± 0.06 | 0.56 ± 0.19 |
| BDWR | 0.17 ± 0.09 | 0.21 | −0.13 ± 0.06 | −0.09 ± 0.35 | −0.04 ± 0.07 | 0.20 ± 0.38 |
| BACK | 0.22 ± 0.10 | 0.11 | −0.14 ± 0.06 | −0.49 ± 0.25 | −0.08 ± 0.06 | −0.02 ± 0.30 |
The correlations with a standard error less than half of their estimates are highlighted in boldface.
h2, estimated heritability; VP, phenotypic variance; rP, phenotypic correlation; rG, additive genetic correlation; s.e., standard error; NOSEP, nose pigmentation; HVSP, hoof pigmentation; GFW, greasy fleece weight; FD, fibre diameter; CF, comfort factor; SL, staple length; PWWT, post-weaning weight; WWT, weaning weight; Ht, height; HSCW, hot standard carcass weight; PEMD, eye-muscle depth ultrasound scan; EMD, eye-muscle depth; EMW, eye-muscle width; EMA, eye-muscle area; PFat, fat depth ultrasound scan; GRFat, fat depth at 12th rib; IMF, intramuscular fat; SF5, shear force; COL, wool-colour score; SSTRC, wool-staple structure; CHAR, wool character; FACE, wool face cover; BDWR, body wrinkle; BACK, back conformation.
Genetic and phenotypic correlations
The genetic and phenotypic correlations of NOSEP and HVSP with wool and meat traits, and visual scores, are presented in Table 7. NOSEP had genetic correlations with three traits (HVSP, PFat and FACE) and HVSP had genetic correlations with 13 traits (NOSEP, PWWT, WWT, Ht, HSCW, PEMD, EMD, EMA, PFAT, GRFat, IMF, CHAR and FACE).
NOSEP was highly positively correlated (genetically and phenotypically) with HVSP. NOSEP was highly positively correlated (genetically) with FACE score, but the phenotypic correlation was weak. HVSP was highly positively correlated (genetically) with FACE and highly negatively correlated (genetically) with CHAR. The phenotypic correlations between HVSP and visual scores, except for NOSEP, were close to zero.
NOSEP was moderately negatively correlated (genetically) with PFat. HVSP was highly negatively correlated (genetically) with Ht and EMD, and moderately negatively correlated (genetically) with PWWT, WWT, HSCW, PEMD, EMA, PFat, GRFat and IMF. The phenotypic correlations between NOSEP or HVSP and meat-production and meat-quality traits were either weak or close to zero.
Discussion
This study aimed to test for evidence of major genes affecting nose and hoof pigmentation and associated effects on wool- and meat-production traits in Corriedale sheep. A GWAS was conducted to identify genomic regions associated with pigmentation, specifically in the nose and hooves. In the following sections, we first discuss the GWAS results, genetic parameters, , and, finally, mean and distribution of the traits.
SNP OAR19_33278780.1 (rs419333175) is associated with nose pigmentation
The GWAS pinpointed a single SNP (OAR19_33278780.1; chr19:31614145, Oar_v4.0) on Chromosome 19 associated with nose-pigmentation score (Fig. 2). Raadsma et al. (2013) reported a QTL at 20 cM (confidence interval = 0–53 cM) on Chromosome 19 linked to nose and hoof pigmentation, among other pigmentation traits, of Merino × Awassi F1 sheep. The authors proposed that MITF is located within this QTL on Chromosome 19. As OAR19_33278780.1 is located within an intron of the pigmentation gene, MITF, it is likely that the SNP also resides within the QTL. The current study provides further support for the involvement of the region on Chromosome 19 in pigmentation.
The GG genotype at OAR19_33278780.1 was associated with a 25% increase in nose-pigmentation scores compared with AG genotype. As the genotype at OAR19_33278780.1 does not follow Mendelian inheritance, the trait is likely to be affected by additional genetic variants. Other sources of variation could result from incomplete linkage disequilibrium between the SNP and the causative variant, as well as environmental factors and scoring inaccuracies.
Interestingly, only one individual possessed the genotype AA, highlighting the selective pressure favouring the G allele. This SNP was identified to be under positive selection in a study involving 74 diverse breeds of sheep (Kijas et al. 2012).
OAR19_33278780.1 may also be important for hoof pigmentation. OAR19_33278780.1 ranked among the top-10 most significant SNPs for HVSP, although it did not exhibit a significant q-value. Nevertheless, the genetic correlation between nose and hoof pigmentation was strong (Table 7). Previous studies on sheep have also identified OAR19_33278780.1 as a significant marker for pigmentation traits. This SNP was significantly associated with coat colour (white, black, ‘grey’ caused by white and black fibres, and brown) in a GWAS study of Finnsheep (Li et al. 2014). Additionally, QTLs for eye skin, ear skin, face skin, leg fibre, horn fibre and ear fibre pigmentation also mapped to Chromosome 19 in Merino × Awassi sheep (Raadsma et al. 2013). Taken together, MITF may be involved in hoof pigmentation, but the current study may have lacked sufficient observations or accurate scoring to detect significance for this trait.
Variants of MITF have been linked to white spotting in horses (Hauswirth et al. 2012; Negro et al. 2017; Henkel et al. 2019; Magdesian et al. 2020; Patterson Rosa et al. 2022) and water buffalo (Yusnizar et al. 2015). In horses, an intronic SNP (g.20147039C > T) was associated with white facial markings in the Spanish Purebreds, and white forelimbs in Menorca Purebreds (Negro et al. 2017). A large deletion including MITF was associated with white coat colour in a Holstein calf (Wiedemar and Drögemüller 2014). A de novo missense variant in Exon 8 of MITF was associated with white coat colour in a white American Standardbred foal (Dürig et al. 2017).
MITF, a transcription factor, plays a role in the migration and differentiation of neural crest cells, which serves as the pluripotent precursor of melanocytes (Widlund and Fisher 2003; Steingrímsson et al. 2004; Levy et al. 2006). Genetic variants of MITF influence pigmentation early in development by guiding the migration and differentiation of melanocyte precursors in specific regions. Consequently, skin and fibres lacking melanocytes appear white. In Corriedale sheep, the pigmented nose skin may be caused by a variant of MITF that specifies localised melanocyte development at the nose.
OAR19_33278780.1 significantly associated with back conformation, and weaning weight
The genotype at OAR19_33278780.1 was added to the univariate model to determine the effect on production traits. The genotype GG was also associated with 5.0% increased weaning weights and 7.3% reduced back-confirmation scores, indicating that back lines are slightly more dipped. Nevertheless, these effect sizes are small and may not have significant impacts on breeding programs.
The GG genotype was associated with 3.9% increase in post-weaning weights, 3.7% rise in carcass weights, and an 8.1% increase in wool colour, although these associations were not statistically significant. As the effect on weaning weight was significant, lambs with the GG genotype may exhibit higher early growth rates. However, the significance of the SNP diminished over time in subsequent weight measurements (PWWT and HSCW). Additionally, there might be insufficient observations to establish significance of the SNP effect for weight traits as the lamb ages and is exposed to more environmental influences. While lambs with the GG genotype tended to have more yellow wool, the effect size remained small.
MC1R may also be involved in pigmentation traits
A SNP on Chromosome 14 (Chr14:14283245) near melanocortin 1 receptor (MC1R) (Chr14:14,231,721–14,232,541; Oar_v3.1) was among the top 10 most significant SNPs for NOSEP and HVSP, but was not significant when the P-value was adjusted for FDR. MC1R is a 7-transmembrane G protein-coupled receptor expressed by melanocytes (Cieslak et al. 2011; Koseniuk et al. 2018) that acts as a pigmentation switch and stimulates eumelanin (black pigment) production when it binds to α melanocyte-stimulating hormone (Cieslak et al. 2011; Koseniuk et al. 2018). Although, the SNP near MC1R is not significant, it may still be involved with these pigmentation traits. This hypothesis could be investigated with more observations and objective measurement methods such as by using image analysis.
Pigmentation traits have some genetic correlations with meat traits
Darker hooves had moderate and high genetic correlations with meat and fat-quantity traits, which indicated reduced growth and fat coverage (Table 5). Some of these genetically correlated traits also had phenotypic correlations with hoof pigmentation; however, these were weak. Darker hooves were also significantly correlated with lower intramuscular fat percentage, indicating lower meat quality; however, the phenotypic correlation was weak. Nose pigmentation was not genetically correlated with wool- and meat-production traits, except for scanned fat depth. Darker noses had moderate genetic correlation with scanned fat depth. As the phenotypic correlations for NOSEP and HVSP with meat-production and meat-quality traits were weak or close to zero, any negative genetic associations that NOSEP and HVSP have on traits may be compensated by other genetic and environmental factors.
Corriedale sheep have mean trait measures similar to those of other breeds
These Corriedale sheep had good growth rates, with weaning weights (~5 months old) of 32.6 kg and post-weaning weights (~6–7 months) of 39.6 kg. This is greater than the WWT of Merino × lambs (27.8 kg; Mortimer et al. 2010) and Merinos (6.51–27.05 kg) and mean PWWT of Merinos (21.98–38.28 kg; Vaez et al. 1996; Huisman et al. 2008; Mortimer et al. 2017a, 2018). These Corriedale sheep had lower PWWT than those of Polled Dorset (45.2 kg; Gilmour et al. 1994).
The lambs were slaughtered at lighter weights (20.64 kg) than in similar trials with other meat breeds (21.6–23.1 kg; Mortimer et al. 2010, 2014) and Merino lambs (21.1 kg; Mortimer et al. 2017b, 2018). The EMA of Corriedale lambs was within the range of means reported in Merinos (11.6–13.1 mm; Mortimer et al. 2010, 2017b, 2018). The GRFat depth in Corriedales (7.46 mm) was lower than GRFat of Merinos (10.7 mm; Mortimer et al. 2018) and Merino × lambs (21.6 mm; Mortimer et al. 2010). IMF in Corriedales was within the range reported for Merinos and Merino × lambs (4.23–5.7%; Mortimer et al. 2010, 2014, 2018). The lower HSCW in these Corriedale may be attributed to the lower fat coverage.
The FD of Corriedale lambs (23 μm) was lower than an earlier reported mean of 25 μm in this breed (Brash et al. 1994), but greater than FD in yearling Merino sheep (16.9–18.1 μm; Huisman et al. 2008; Mortimer et al. 2017a). Mean GFW was 1.81 kg at approximately 5–6 months.
The Corriedale lambs had COL, SSTRC, CHAR and FACE scores similar to those of Merinos (COL: 2.37–2.85; SSTRC: 2.5–2.65; CHAR: 2.45–2.69; and FACE: 1.85–2.73; Hatcher and Preston 2018). The mean BDWR score of Corriedale lambs was lower than yearling, adult, and hogget Merino scores (2.09–2.64), indicating that Corriedale lambs are less wrinkled.
Conclusions
This investigation of nose and hoof pigmentation in Corriedale sheep supports the potential involvement of MITF in the development of nose pigmentation. While MITF might also contribute to hoof pigmentation, the SNP within this gene (OAR19_33278780.1) did not exhibit a significant association. Further research with more observations and improved scoring or measurement of hoof pigmentation could help clarify this relationship.
While NOSEP and HVSP had low to moderate genetic correlations with wool traits, live-animal traits and carcass traits, no phenotypic correlations were observed. This suggests that the pigmentation traits have little impact on the overall phenotype. The genotype at OAR19_33278780.1 has a significant effect on nose-pigmentation, weaning-weight, and back-conformation scores. The animals with the genotype GG had a greater mean NOSEP, HVSP, and WWT.
Acknowledgements
Dr Rick Tearle and Dr Rudi McEwin from the University of Adelaide processed the genotype data.
References
Blackwood P, Blackwood C, Pitchford JM, Gordon H, Welsh SC, Pitchford WS (2021) Performance Corriedale group genomics project. In ‘Proceedings of the AAABG 24th Conference’, 24 November 2021, Adelaide, SA, Australia. Vol. 24, pp. 463–466. (Association for the Advancement of Animal Breeding and Genetics)
Brash LD, Fogarty NM, Gilmour AR (1994) Genetic parameters for Australian maternal and dual-purpose meatsheep breeds. II. Liveweight, wool and reproduction in Corriedale sheep. Australian Journal of Agricultural Research 45, 469-480.
| Crossref | Google Scholar |
Butler DG, Cullis BR, Gilmour AR, Gogel BJ, Thompson R (2018) ASReml-R reference manual version 4. Available at https://asreml.kb.vsni.co.uk/wp-content/uploads/sites/3/ASReml-R-Reference-Manual-4.pdf
Cieslak M, Reissmann M, Hofreiter M, Ludwig A (2011) Colours of domestication. Biological Reviews 86, 885-899.
| Crossref | Google Scholar |
Dürig N, Jude R, Jagannathan V, Leeb T (2017) A novel MITF variant in a white American Standardbred foal. Animal Genetics 48, 123-124.
| Crossref | Google Scholar |
Gilmour AR, Luff AF, Fogarty NM, Banks R (1994) Genetic parameters for ultrasound fat depth and eye muscle measurements in live Poll Dorset sheep. Australian Journal of Agricultural Research 45, 1281-1291.
| Crossref | Google Scholar |
Hatcher S, Preston JWV (2018) Genetic relationships of breech cover, wrinkle and wool coverage scores with key production traits in Australian Merino sheep. Small Ruminant Research 164, 48-57.
| Crossref | Google Scholar |
Hauswirth R, Haase B, Blatter M, Brooks SA, Burger D, Drögemüller C, Gerber V, Henke D, Janda J, Jude R, Magdesian KG, Matthews JM, Poncet P-A, Svansson V, Tozaki T, Wilkinson-White L, Penedo MCT, Rieder S, Leeb T (2012) Mutations in MITF and PAX3 cause ‘Splashed White’ and other white spotting phenotypes in horses. PLoS Genetics 8, e1002653.
| Crossref | Google Scholar |
Henkel J, Lafayette C, Brooks SA, Martin K, Patterson-Rosa L, Cook D, Jagannathan V, Leeb T (2019) Whole-genome sequencing reveals a large deletion in the MITF gene in horses with white spotted coat colour and increased risk of deafness. Animal Genetics 50, 172-174.
| Crossref | Google Scholar |
Huisman AE, Brown DJ, Ball AJ, Graser H-U (2008) Genetic parameters for bodyweight, wool, and disease resistance and reproduction traits in Merino sheep. 1. Description of traits, model comparison, variance components and their ratios. Australian Journal of Experimental Agriculture 48, 1177-1185.
| Crossref | Google Scholar |
Kijas JW, Lenstra JA, Hayes B, Boitard S, Porto Neto LR, San Cristobal M, Servin B, McCulloch R, Whan V, Gietzen K, Paiva S, Barendse W, Ciani E, Raadsma H, McEwan J, Dalrymple B, International Sheep Genomics Consortium Members (2012) Genome-wide analysis of the world’s sheep breeds reveals high levels of historic mixture and strong recent selection. PLoS Biology 10, e1001258.
| Crossref | Google Scholar |
Koseniuk A, Ropka-Molik K, Rubiś D, Smołucha G (2018) Genetic background of coat colour in sheep. Archives Animal Breeding 61, 173-178.
| Crossref | Google Scholar |
Larsen JWA (2014) Sustainable internal parasite control of sheep in Australia. Small Ruminant Research 118, 41-47.
| Crossref | Google Scholar |
Levy C, Khaled M, Fisher DE (2006) MITF: master regulator of melanocyte development and melanoma oncogene. Trends in Molecular Medicine 12, 406-414.
| Crossref | Google Scholar |
Li MH, Tiirikka T, Kantanen J (2014) A genome-wide scan study identifies a single nucleotide substitution in ASIP associated with white versus non-white coat-colour variation in sheep (Ovis aries). Heredity 112, 122-131.
| Crossref | Google Scholar |
Magdesian KG, Tanaka J, Bellone RR (2020) A de novo MITF deletion explains a novel splashed white phenotype in an american paint horse. Journal of Heredity 111, 287-293.
| Crossref | Google Scholar |
Marshall FR (1916) Corriedale sheep. Journal of Heredity 7, 88-95.
| Crossref | Google Scholar |
Mortimer SI, van der Werf JHJ, Jacob RH, Pethick DW, Pearce KL, Warner RD, Geesink GH, Hocking Edwards JE, Gardner GE, Ponnampalam EN, Kitessa SM, Ball AJ, Hopkins DL (2010) Preliminary estimates of genetic parameters for carcass and meat quality traits in Australian sheep. Animal Production Science 50, 1135-1144.
| Crossref | Google Scholar |
Mortimer SI, van der Werf JHJ, Jacob RH, Hopkins DL, Pannier L, Pearce KL, Gardner GE, Warner RD, Geesink GH, Hocking Edwards JE, Ponnampalam EN, Ball AJ, Gilmour AR, Pethick DW (2014) Genetic parameters for meat quality traits of Australian lamb meat. Meat Science 96, 1016-1024.
| Crossref | Google Scholar |
Mortimer SI, Hatcher S, Fogarty NM, van der Werf JHJ, Brown DJ, Swan AA, Greeff JC, Refshauge G, Edwards JEH, Gaunt GM (2017a) Genetic parameters for wool traits, live weight, and ultrasound carcass traits in Merino sheep. Journal of Animal Science 95, 1879-1891.
| Crossref | Google Scholar |
Mortimer SI, Hatcher S, Fogarty NM, van der Werf JHJ, Brown DJ, Swan AA, Jacob RH, Geesink GH, Hopkins DL, Edwards JEH, Ponnampalam EN, Pearce KL, Pethick DW (2017b) Genetic correlations between wool traits and carcass traits in Merino sheep. Journal of Animal Science 95, 2385-2398.
| Crossref | Google Scholar |
Mortimer SI, Fogarty NM, van der Werf JHJ, Brown DJ, Swan AA, Jacob RH, Geesink GH, Hopkins DL, Hocking Edwards JE, Ponnampalam EN, Warner RD, Pearce KL, Pethick DW (2018) Genetic correlations between meat quality traits and growth and carcass traits in Merino sheep1. Journal of Animal Science 96, 3582-3598.
| Crossref | Google Scholar |
Negro S, Imsland F, Valera M, Molina A, Solé M, Andersson L (2017) Association analysis of KIT, MITF, and PAX3 variants with white markings in Spanish horses. Animal Genetics 48, 349-352.
| Crossref | Google Scholar |
Patterson Rosa L, Martin K, Vierra M, Foster G, Brooks SA, Lafayette C (2022) Non-frameshift deletion on MITF is associated with a novel splashed white spotting pattern in horses (Equus caballus). Animal Genetics 53, 538-540.
| Crossref | Google Scholar |
Raadsma HW, Jonas E, Fleet MR, Fullard K, Gongora J, Cavanagh CR, Tammen I, Thomson PC (2013) QTL and association analysis for skin and fibre pigmentation in sheep provides evidence of a major causative mutation and epistatic effects. Animal Genetics 44, 547-559.
| Crossref | Google Scholar |
Scobie D, Makela A, van Koten C, O’Connell D (2017) Mechanical properties of black, grey, and white hoof material of sheep. In ‘New Zealand Society of Animal Production Conference’, June 2017, Rotorua, New Zealand. (New Zealand Society of Animal Production: Rotorua, New Zealand) Available at http://www.nzsap.org/proceedings/mechanical-properties-black-grey-and-white-hoof-material-sheep
Steingrímsson E, Copeland NG, Jenkins NA (2004) Melanocytes and the microphthalmia transcription factor network. Annual Review of Genetics 38, 365-411.
| Crossref | Google Scholar |
Storey JD, Tibshirani R (2003) Statistical significance for genomewide studies. Proceedings of the National Academy of Sciences 100, 9440-9445.
| Crossref | Google Scholar |
Vaez TR, Nicolas FW, Raadsma HW (1996) REML estimates of variance and covariance components for production traits in Australian Merino sheep, using an animal model. 1. Body weight from birth to 22 months. Australian Journal of Agricultural Research 47, 1235-1249.
| Crossref | Google Scholar |
VanRaden PM (2008) Efficient methods to compute genomic predictions. Journal of Dairy Science 91, 4414-4423.
| Crossref | Google Scholar |
Widlund HR, Fisher DE (2003) Microphthalamia-associated transcription factor: a critical regulator of pigment cell development and survival. Oncogene 22, 3035-3041.
| Crossref | Google Scholar |
Wiedemar N, Drögemüller C (2014) A 19-Mb de novo deletion on BTA 22 including MITF leads to microphthalmia and the absence of pigmentation in a Holstein calf. Animal Genetics 45, 868-870.
| Crossref | Google Scholar |
Yang J, Lee SH, Goddard ME, Visscher PM (2011) GCTA: A tool for genome-wide complex trait analysis. American Journal of Human Genetics 88, 76-82.
| Crossref | Google Scholar |
Yusnizar Y, Wilbe M, Herlino AO, Sumantri C, Noor RR, Boediono A, Andersson L, Andersson G (2015) Microphthalmia-associated transcription factor mutations are associated with white-spotted coat color in swamp buffalo. Animal Genetics 46, 676-682.
| Crossref | Google Scholar |