

Use of dry-matter intake recorded at multiple time periods during lactation increases the accuracy of genomic prediction for dry-matter intake and residual feed intake in dairy cattle
Sunduimijid Bolormaa A * , Mekonnen Haile-Mariam A L , Leah C. Marett B C , Filippo Miglior D E , Christine F. Baes E F , Flavio S. Schenkel E , Erin E. Connor G H , Coralia I. V. Manzanilla-Pech I , Eileen Wall J , Mike P. Coffey J , Michael E. Goddard A K , Iona M. MacLeod A and Jennie E. Pryce A L
A Agriculture Victoria Research, AgriBio Centre for AgriBioscience, Bundoora, Vic. 3083, Australia.
B Agriculture Victoria Research, Ellinbank, Vic. 3821, Australia.
C Centre for Agricultural Innovation, School of Agriculture and Food, Faculty of Veterinary and Agricultural Sciences, University of Melbourne, Parkville, Vic. 3010, Australia.
D LACTANET, Sainte-Anne-de-Bellevue, QC H9X 3R4, Canada.
E CGIL, University of Guelph, Guelph, ON N1G 2W1, Canada.
F Institute of Genetics, Vetsuisse Faculty, University of Bern, Bern 3002, Switzerland.
G Animal Genomics and Improvement Laboratory, USDA, Agricultural Research Service, Beltsville Agricultural Research Center, Beltsville, MD 20705, USA.
H Department of Animal and Food Sciences, University of Delaware, Newark, DE 19716, USA.
I Center for Quantitative Genetics and Genomics, Aarhus University, C. F Møllers allé 3, Aarhus DK-8000, Denmark.
J Scotland’s Rural College, Roslin Institute, Midlothian EH25 9RG, UK.
K School of Veterinary and Agricultural Sciences, University of Melbourne, Parkville, Vic. 3052, Australia.
L School of Applied Systems Biology, La Trobe University, Bundoora, Vic. 3083, Australia.
Animal Production Science 63(11) 1113-1125 https://doi.org/10.1071/AN23022
Submitted: 12 January 2023 Accepted: 8 May 2023 Published: 29 May 2023
© 2023 The Author(s) (or their employer(s)). Published by CSIRO Publishing. This is an open access article distributed under the Creative Commons Attribution-NonCommercial-NoDerivatives 4.0 International License (CC BY-NC-ND)
Abstract
Context: Feed is the largest expense on a dairy farm, therefore improving feed efficiency is important. Recording dry-matter intake (DMI) is a prerequisite for calculating feed efficiency. Genetic variation of feed intake and feed efficiency varies across lactation stages and parities. DMI is an expensive and difficult-to-measure trait. This raises the question of which time periods during lactation would be most appropriate to measure DMI.
Aims: The aim was to evaluate whether sequence variants selected from genome-wide association studies (GWAS) for DMI recorded at multiple lactation time periods and parities would increase the accuracy of genomic estimated breeding values (GEBVs) for DMI and residual feed intake (RFI).
Methods: Data of 2274 overseas lactating cows were used for the GWAS to select sequence variants. GWAS was performed using the average of the DMI phenotypes in a 30-day window of six different time periods across the lactation. The most significant sequence variants were selected from the GWAS at each time period for either first or later parities. GEBVs for DMI and RFI in Australian lactating cows were estimated using BayesRC with 50 k single nucleotide polymorphisms (SNPs) and selected GWAS sequence variants.
Key results: There were differences in DMI genomic correlations and heritabilities between first and later parities and within parity across lactation time periods. Compared with using 50 k single-nucleotide polymorphisms (SNPs) only, the accuracy of DMI GEBVs increased by up to 11% by using the 50 k SNPs plus the selected sequence variants. Compared with DMI, the increase in accuracy for RFI was lower (by 6%) likely because the sequence variants were selected from GWAS for DMI not RFI. The accuracies for DMI and RFI GEBVs were highest by using selected sequence variants from the DMI GWAS in the mid- to late-lactation periods in later parity.
Conclusions: Our results showed that DMI phenotypes in late lactation time periods could capture more genetic variation and increase genomic prediction accuracy through the use of custom genotype panels in genomic selection.
Implications: Collecting DMI at the optimal time period(s) of lactation may help develop more accurate and cost-effective breeding values for feed efficiency in dairy cattle.
Keywords: BayesRC, DMI, days in milk, disentangling phenotypes, genomic accuracy, genomic correlation, GWAS, hierarchical clustering, lactation time periods, RFI.
Introduction
Feed costs make up a large proportion of the variable and total costs on a dairy farm. Different ways to reduce feed costs have been widely adopted by the dairy industry. There is considerable interest in using genome-wide association studies (GWAS) with imputed DNA sequences to identify more predictive sequence variants to improve the accuracy of genomic prediction for dry-matter intake (DMI) and residual feed intake (RFI), as well as identify genes underpinning these economically important traits. The evidence in both cattle and sheep shows that the accuracy of genomic prediction from a standard single-nucleotide polymorphism (SNP) chip can be improved by including more predictive variants from imputed sequence data (Brøndum et al. 2015; MacLeod et al. 2016; van den Berg et al. 2016; VanRaden et al. 2017; Moghaddar et al. 2019). The use of collated phenotypes and genotypes from research herds of different countries has been shown to increase statistical power of GWAS and improve accuracy of genomic prediction. For example, Bolormaa et al. (2022) reported that the predictive sequence variants from the meta-GWAS of overseas data combined with the 50 k SNP array data provided up to 10% increase in accuracy of genomic estimated breeding values (GEBVs) for RFI.
Knowing the best parity and time during the lactation for recording feed-intake data as well as the duration of recording would be useful for planning feed-intake experiments of dairy cows to improve genetics of feed utilisation. Daily measurement of feed intake throughout lactation could provide a highly accurate estimate of lactation performance and efficiency but is cumbersome and expensive to collect. Logistical and cost restraints have limited the availability of DMI records in Australian lactating cows (AUS) throughout the lactation period. Access to a larger amount of DMI records from overseas cows (OVE) through collaboration with the Efficient Dairy Genome Project (EDGP; an international database including research herds from Europe and North America) has provided an opportunity to have feed-intake records to cover the entire lactation period and multiple lactations. Because this dataset contains sporadic missing records across the lactation period, predicted records of DMI across lactation could be obtained using random regression modelling (RRM). For instance, Berry et al. (2014) used RRM to evaluate feed-intake data of dairy cattle collated from nine international research partners. Bignardi et al. (2011) and Begli et al. (2016) used RRM for feed intake and RFI in F2 chicken populations, and both reported that RRM provided a reliable estimate of feeding behaviour records. Furthermore, to reduce the computational demand and use the more frequently observed records, the records of several days may be averaged. This is a good strategy when consecutive measurements are strongly correlated.
Genetic variation for feed intake varies across lactation stages. Genetic correlations between DMI at different stages of lactation are less than unity (Li et al. 2018). Analysing marker associations over time may be an efficient approach to identify genetic markers for feed-intake and efficiency traits that are not controlled by major genes (QTL with large effects), such as DGAT1 in milk production traits (Grisart et al. 2002; Schennink et al. 2007; Berry et al. 2014). The highest variation in associated loci in milk production was reported for early and late lactation (Strucken et al. 2015). Considering different time periods over lactation for DMI might help detect some missing genetic variance that explains the observed phenotypic variation. Differences in genetic effects were not only found for different lactation stages but also between parities, particularly the first and later parities (Strucken et al. 2012). As first parity cows are still growing, we considered both first parity (1) and later (2+) parities in this study.
Bayesian methods (e.g. BayesR and RC) have been widely used in genomic prediction studies in cattle and sheep species (Erbe et al. 2012; Bolormaa et al. 2013, 2017; Kemper et al. 2015; MacLeod et al. 2016; van den Berg et al. 2017). BayesRC incorporates prior biological information by defining classes of variants likely to be enriched in causal mutations and this can increase the accuracy of genomic prediction compared with BayesR (MacLeod et al. 2016).
Potentially, the addition of sequence variants associated with feed efficiency and dry-matter intake to custom SNP panels could help improve the accuracy of genomic prediction for these traits (Bolormaa et al. 2022). However, it is of interest to understand whether sequence variants identified by GWAS from a specific lactation time period could better increase the accuracy of genomic prediction in AUS cows compared with variants identified from the entire lactation period. This could help identify an optimal period in which to measure DMI and also the selected sequence variants could be used to enrich custom SNP panels for improved accuracy of genomic prediction. The main objective of our study was to select sequence variants from GWAS for DMI at various lactation time periods in an independent overseas cow dataset and then to evaluate their impact on the accuracy of GEBVs for DMI and RFI in Australian cows, for which DMI is recorded over a short period of time.
Materials and methods
Phenotypes
We used Australian (AUS) cows only for genomic prediction analysis, while the overseas cows (OVE) were used for GWAS sequence variant discovery. In the GWAS, we used daily records of DMI of lactating Holstein cows from overseas research groups, including from United States of America (USA), Canada (CAN, two institutes), Denmark (DNK) and United Kingdom (GBR). We refer to the combined USA, CAN, DNK, and GBR data as the overseas dataset (OVE) and it comprised a total of 3392 cows with DMI records. Numbers of animals with DMI records in each overseas herd is given in Table 1. The AUS dataset consisted of 584 cows, including 124 and 490 cows from first and later (2+) parities respectively. In total, 21 954 records of DMI from the National Centre for Dairy Research and Development (Ellinbank, Vic., Australia) were used in these data. Individual cow feed intakes were measured using an electronic feed recording system (Gallagher Animal Management Systems). The cows were fed compressed dairy cubes ad libitum and the cubes comprised approximately 74% lucerne hay (Medicago sativa L.), 25% crushed barley (Hordeum vulgare L.) grain, and 1% mineral mix (Multicube Ltd). Collection of DMI occurred for 235 AUS cows between 2011 and 2013 and is described in Macdonald et al. (2014) and Pryce et al. (2015). Additional 349 AUS cows had DMI measurements taken between 2013 and 2017 as reported in Bolormaa et al. (2022). The phenotypes for DMI of OVE cows from USA, CAN (2 herds named ELORA and DRTC), DNK, and GBR were downloaded from the EDGP database in December 2019 (de Haas et al. 2012; Pryce et al. 2015; Manzanilla-Pech et al. 2021). The calculation of RFI phenotypes for AUS cows are described in Bolormaa et al. (2022). Briefly, RFI for AUS was calculated on the basis of the average DMI over the 28-day experimental period as follows: RFI = DMI – (mean + contemporary group + DIM + Parity + ECM + MBW + ΔBW), where mean is the overall mean of DMI across the population, MBW is the mean bodyweight (BW), and ΔBW is the change in BW during the trial period, ECM is the energy-corrected milk; ECM, MBW, and ΔBW were fitted as covariates in the model; contemporary group (16 different cohort groups from trials run between November 2011 and November 2017), DIM at the beginning of the trial as a covariate, and parity (1, 2, 3, and 4+) were the systematic environmental effects fitted as fixed effects. Energy-corrected milk (kg/day) was calculated as described in Pryce et al. (2015): ECM = 0.1 × milk (kg/day) + 5.2 × fat (kg/day) + 2.6 × protein (kg/day), where milk, fat, and protein are milk, protein, and fat yields respectively.
| Herd ID | Number of cows with DMI | Number of total cows (genotyped) | ||
|---|---|---|---|---|
| First parity | Later parity | Total | ||
| USA | 651 | 456 | 736 | 674 |
| CANELORA | 319 | 277 | 437 | 401 |
| CANDRTC | 289 | 245 | 364 | 352 |
| DNK | 773 | 587 | 816 | 439 |
| GBR | 941 | 799 | 1039 | 408 |
| OVE | 2973 | 2364 | 3392 | 2274 |
USA, United States of America; CANELORA, Elora in Canada Elora; CANDRTC, DRTC in Canada; DNK, Denmark; GBR, United Kingdom; OVE, total overseas lactating cows.
The DMI and RFI phenotypes were removed if their standard deviations were smaller than −3.5, or greater than 3.5 from the mean of the cows within each herd. Number of observed records in OVE and AUS datasets were 624 610 and 21 954 respectively. Most cows had more than five records across parities (1+ parities). For GBR, we removed the data recorded before 2002, so that the data were recorded at the same time as for other overseas countries. Then the DMI records across the entire lactation for every animal from all five overseas herds were collated and used to predict missing daily DMI records by using a method described in the ‘Statistical analyses’ section below.
Genotypes
The genotypes of the 584 Australian cows were imputed to high-density (HD) genotypes (~600 k SNPs) by using the Fimpute software (Sargolzaei et al. 2014). The genotypes of the USA, CAN (ELORA and DRTC), and DNK cows were downloaded from the EDGP database, and the 50 k genotypes of GBR cows were part of the dataset used in the development of the 2015 EBVs for feed saved, as described by Pryce et al. (2015). The genotypes of cows from the different countries in the EDGP database were obtained from various chips, ranging in size from 55 647 to 777 961 SNPs. The full details of the editing and imputation of genotypes up to WGS variants were described in Bolormaa et al. (2022). Briefly, sporadic missing genotypes within each herd were imputed using FImpute with a reference population of 2700 Australian animals that were genotyped directly with HD SNP. The imputation from HD SNPs to whole genome sequence (WGS) variants was performed using the Minimac3 algorithm (Das et al. 2016). The sequences of 3090 Bos taurus cattle representing multiple breeds including Holsteins and crosses from across the world (Run 7 of the 1000 Bull Genomes project; Hayes and Daetwyler 2019) were used as reference animals for imputing from HD to WGS. Minimac3 requires pre-phased genotypes in both the reference (WGS) and target sets. Pre-phasing was performed using the Eagle software (Loh et al. 2016). The genotypes on the B. taurus (BTA) X chromosome were not included in the subsequent analyses.
Statistical analyses
In this study, AUS cows with all available records of DMI across lactation were used in the genomic prediction analysis. The OVE cows were not used in the genomic prediction, but they were used as an independent population to predict their missing records of DMI (please see the details in the next section), and to generate phenotypes across the entire lactation. The DMI phenotypes during specific time periods were then used to identify the predictive sequence variants from WGS GWAS. This process was not feasible for AUS dataset where there were too few DMI records across the entire lactation period.
The missing daily records for DMI in the OVE cows were predicted using the following RRM:
where y is a vector of phenotypic values for DMI, μ is overall mean across populations, HYS is herd-year season of calving, herd.parity.pol(DIM, −6) is a sixth-order orthogonal polynomial regression on DIM (5–306 DIM) that was fitted as nested in the particular parity, and herd, poly(age, −2) is age of cows at calving fitted as a second-order orthogonal polynomial. The parity.pol(DIM, 2).animal, ide(animal) and e are random effects, second-order orthogonal polynomial regression on DIM to the trait (intercept, linear, and quadratic) nested within each parity, animal permanent environmental effect and residuals respectfully. All records of the OVE cows from each of five herds (four countries) for each parity were categorised into the following four different stages of lactation: ≤30 days in milk (DIM), 31–100 DIM, 101–200 DIM; and >200 DIM) for estimating the residual variance components and to capture the effect of lactation period. If a particular class in the OVE cows had fewer than 1000 test-day records, then it was merged to the adjacent stage. The residuals were assumed to be independent across stages.
Genetic heterogeneity of DMI exists across lactation period (Berry et al. 2014). Disentangling the DMI phenotypes at different time periods of lactation may enable better detection of specific causal variants affecting feed intake and efficiency at the particular time periods. For identifying the different time periods across lactation, we used hierarchical clustering algorithm in the base package of R, based on the pair-wise correlations of EBVs for DMI. For this analysis, we used the actual or predicted records of 10 ≤ DIM < 290 for each parity. Thus, instead of daily records, we used the average of records from 10-day-interval across the lactation, starting at 10 DIM to 290 DIM (i.e. avoiding the very early and very late DIM due to a lack of real observations for these days). This resulted in 28 traits (=280 DIM divided by 10). Also, the records within each dataset (five herds of four OVE countries) were standardised ((x-mean)/s.d.) to avoid any potential differences in measurement scales, and then were merged to form one OVE dataset. Then the EBVs for each of 28 traits were calculated using the linear regression model, with pedigree using ASReml program (Gilmour et al. 2009):
where animal is a random genetic effect of animal, and all the other factors are as defined in Model 1. A dendrogram was drawn on the basis of the pair-wise correlations of EBVs among 28 traits by using hierarchical clustering (Supplementary material Fig. S1). We used these EBVs only to make decisions on which of these 28 traits (n = 28) formed separate independent branches (groups).
For each parity, we selected six ‘time periods’ that showed the most differentiation across lactation, which were the upper branches (groups) on the dendrogram (Fig. S1). Each of the six lactation time periods selected from upper branch on the dendrogram covered 30 consecutive lactation days (please see the six selected time periods in Table 2). Once we identified which DIM from 10 up to 280 DIM to allocate to one of six lactation time-periods from the dendrogram, the means of 30-DIM-phenotypes at the corresponding lactation time period were calculated for each parity, standardised within each herd, and then were merged among all five herds into one phenotype for use in the DMI GWAS of different time points of lactation. The phenotypes at each 30-day ‘time period’ were treated as a new trait (‘y’ variable) for a DMI GWAS (described below). In total, 14 traits (two parities × six time periods and plus, two parities × across the full lactation period for comparison) were analysed for GWAS. The number of observed records for time period in the OVE and AUS data are shown in Table 2.
| Time period IDA | DIM start | DIM end | Number of daysB | OVE cows | AUS cows | ||||
|---|---|---|---|---|---|---|---|---|---|
| First parity | Later parity | First parity | Later parity | ||||||
| NumberC | NumberD | NumberC | NumberD | NumberC | NumberD | ||||
| 0_1 | 7 | 9 | 3 | 5917 | 0 | 7231 | 7231 | ||
| 1_3 | 10 | 39 | 30 | 43 329 | 32 522 | 52 608 | 38 243 | 47 | |
| 4_5 | 40 | 59 | 20 | 29 112 | 21 970 | 33 355 | 24 218 | 2 | 665 |
| 6_8 | 60 | 89 | 30 | 43 710 | 33 013 | 47 847 | 34 601 | 814 | 4983 |
| 9_10 | 90 | 109 | 20 | 25 037 | 18 287 | 26 807 | 18 581 | 1845 | 5017 |
| 11_13 | 110 | 139 | 30 | 27 990 | 18 586 | 30 357 | 18 927 | 1440 | 4506 |
| 14_16 | 140 | 169 | 30 | 26 523 | 17 180 | 28 251 | 17 195 | 190 | 875 |
| 17_19 | 170 | 199 | 30 | 23 802 | 14 805 | 26 635 | 16 267 | 16 | 665 |
| 20_21 | 200 | 209 | 10 | 7360 | 4517 | 8377 | 5050 | 178 | |
| 21_23 | 210 | 239 | 30 | 22 611 | 13 872 | 25 344 | 15 569 | 696 | |
| 24_25 | 240 | 249 | 10 | 7141 | 4244 | 7754 | 4664 | 15 | |
| 25_27 | 250 | 279 | 30 | 19 260 | 11 281 | 20 054 | 11 534 | ||
| 27_31 | 280 | 303 | 24 | 13 903 | 0 | 14 295 | 14 295 | ||
OVE refers to cows from USA, CANELOR, CANDRTC, DNK, and GBR herds and acronyms for these herds are described in Table 1.
ANumber of real observed records for time periods: records in the regular and italic font styles together in OVE cows are used in the random regression analysis to predict the missing values, but OVE cows with records at time periods in regular font style are used in the GWAS.
BLength of each time period (in days).
CNumber of records of the cows with only phenotypes.
DNumber of records of the cows with both phenotypes and genotypes.
The WGS GWAS for 14 traits were performed using only the OVE dataset. The 14 traits were the DMI phenotypes of the different lactation time periods for each parity (6 × 2 = 12 traits) and DMI phenotypes across the full lactation (lactation-wise, 7–279 DIM) for each parity (1 × 2 = 2 traits). The mixed model used for the GWAS fitted each sequence variant as a covariate, one at a time, and tested for an association with each trait, as follows:
where y is the vector of observed phenotypic values of the animals, 1n is an n × 1 vector of 1s (n = number of animals with phenotypes), μ is the overall mean, X is a design matrix relating observations to the corresponding fixed effect (dataset), b is a vector of systematic environmental effects (HYS and poly(age, −2), in this case), si is a vector of genotypes (coded as 0, 1, and 2) for each animal at the ith variant, αi is the covariate effect of the corresponding variant, g is a vector of GEBV , where is the genetic variance and G is the genomic relationship matrix constructed from HD SNPs, and e is residual error. The analysis was performed using the GCTA software (Yang et al. 2011).
In total, 31 380 025 WGS autosomal variants were used to perform each GWAS. We pre-filtered the imputed sequence variants (Minimac3 R2 > 0.4) for imputation quality on OVE cows’ genotypes and applied a minor allele frequency (MAF), which are important factors to reduce the level of false positives in the GWAS. Bolormaa et al. (2019) showed that the Minimac3 R2 statistic is a good proxy for empirical imputation accuracy for use in filtering poorly imputed variants. According to their study, a Minimac3 R2 value greater than 0.4 corresponded to an empirical imputation accuracy of ≥0.87 (measured as the correlation between real and imputed genotypes). Approximately 60% of the 31 380 025 variants (18 921 317) had a Minimac R2 value greater than 0.4 in the OVE imputed WGS dataset. About 96% of these 18 921 317 variants in the OVE cow dataset overlapped with the variants (R2 > 0.4) in the AUS cow WGS dataset. The sequence variants were removed if imputation R2 was ≤0.4 in both the OVE and AUS cow datasets. The variants were removed if their MAF was ≤0.008 in the OVE dataset (to ensure that a minimum of 25 alleles per variant were segregating in the dataset). This resulted in 14.04 million sequence variants, which were available for further analysis. Each of the 14 individual trait GWAS for DMI was performed on the basis of dataset at each lactation time period for each parity. Before selecting the top significant sequence variants in windows along each chromosome, we removed the sequence variants that were overlapped with 50 k and HD SNP sets and retained the variants that had MAF of more than 0.05 in the WGS genotypes of AUS cows. MAF threshold of 0.05 were chosen to ensure that a minimum of 50 alleles are segregating in AUS cow population. To avoid selecting a large number of variants in strong linkage disequilibrium (LD), the five most significant variants with P-values of <0.001 from each of 14 GWAS were selected from within each 100-kb window along each chromosome and sliding by 50 kb to the next window. The reason we selected five variants is that we know that the causal variants in sequence GWAS are not always most significant variants. We chose P < 0.001 because the data set is relatively small and polygenic traits are affected by many hundreds to thousands of variants with small effects that will have not highly significant P-values. Additionally, overall power of WGS GWAS for DMI was weak due to the small size of the datasets. Then we made the following 17 lists of sequence variants for 14 single-trait GWAS:
12 sets: p:1_3, p:6_8, p:11_13, p:17_19, p:21_23, and p:25_27 for the six different time periods in the first (1) and later (2) parities (where P = 1, 2)).
Two sets (full lactation (lactation-wise) for the first and later parities (P = 1, 2)): p:lactw.
Three combined set of sequence variants from two GWAS of each of two consecutive time periods at early (E), mid- (M), and late (L) lactation for later parity: 2:E, 2:M, and 2:L.
In genomic prediction analysis, we used only AUS cows and DMI and RFI records across parities (i.e. not phenotypes at different lactation time periods).
The Bayesian (RC and R) approach (Erbe et al. 2012; Kemper et al. 2015; MacLeod et al. 2016) was used for the genomic prediction of DMI and RFI that was performed using only the AUS dataset. The SNP effects were fitted as a mixture of four normal distributions, each with a mean of zero and variance: , where is the additive genetic variance. BayesR was used with 50 k and HD SNP genotypes of AUS cows. The BayesR method was used to predict GEBVs using 50 k and HD genotypes of AUS cows. The BayesRC method was tested with 50 k and selected sequence variants because it allows for different categories of variants that may be differently enriched for QTL. Thus, the most significant variants from the WGS GWAS of the independent population (OVE cows) were allocated in a separate class from 50 k SNP, allowing the possibility of different mixture distribution of SNP effects in each of these two classes. Phenotypes were pre-corrected for the fixed effects as described in Bolormaa et al. (2022). These residuals were then used as phenotypes in the BayesR and RC analyses, which were run with the five parallel Gibbs sampling chains. Gibbs sampling was used to sample from the posterior distributions of the parameters including SNP effects with 20 000 iterations of burn-in followed by 40 000 iterations. BayesR and RC analyses were conducted for each validation set (please see details in the next section).
Only the AUS cows were used in the reference and validation populations for both RFI and DMI. Validation animals were selected by splitting the data into four-fold random cross-validations, where we avoided including paternal half-sib families to be in both the reference and validation sets. Any remaining animals were retained in the reference sets. For the four-fold cross-validation, few animals with unknown sires were retained in the reference set and the remaining individuals were split into four sets by allocating all offspring of randomly selected sires into one of the four datasets. Thus, the analysis was performed four times by using one of each data fold in turn as a validation group and the other three folds used in the reference population (i.e. three folds plus the remaining cows from above). There were 115 AUS cows (s.d. = 6) in each of the cross-validation populations.
For each validation population (AUS), the empirical accuracy of genomic prediction was calculated as the correlation between GEBVs and the corrected phenotypes. Then, the correlation was divided by the square root of the genomic heritability of the trait (h2) in the AUS dataset. The h2 was estimated using phenotypes of all 584 AUS cows as the proportion of the phenotypic variance that was explained by the 50 k SNPs (h2 = 0.34 for DMI and 0.20 for RFI). The accuracies of GEBVs were averaged across four validation sets × the five parallel Gibbs sampling chains run for each trait. The accuracies were weighted by the number of records in each validation set. The accuracy of the predicted GEBVs with two classes (top sequences and 50 k SNP) was compared with the accuracy of GEBVs predicted by using only either the 50 k or HD SNP genotypes.
Results
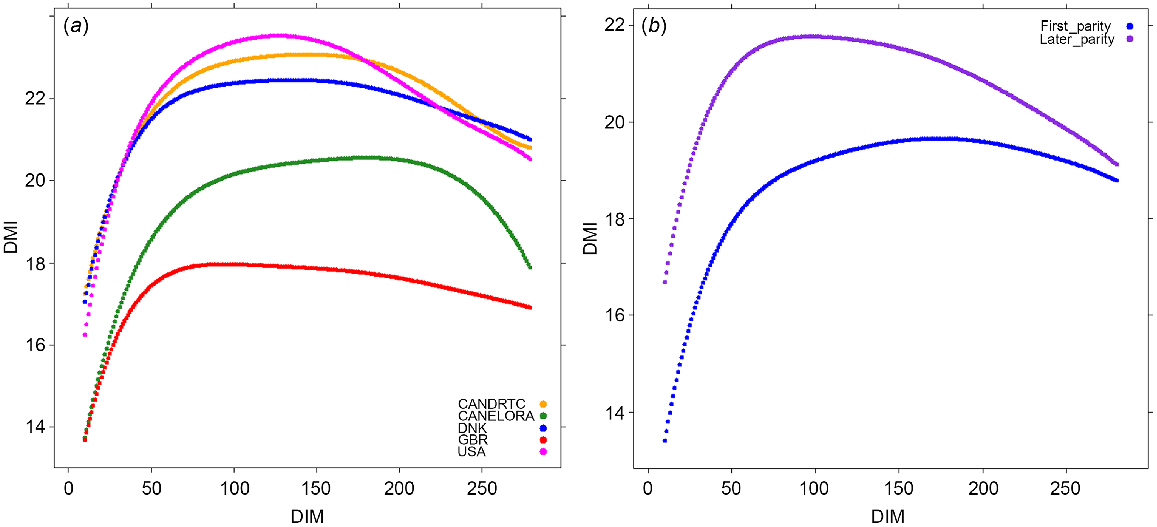
To determine the relevance of using the variants selected from the GWAS within specific time periods during lactation, we used the independent OVE dataset as the discovery population. The number of cows with DMI records was 2973 and 2364 for first and late parities respectively (Table 1). The means of the predicted daily records across the lactations are shown in Fig. 1a. In the majority of OVE herds, DMI increased sharply up to ~50 DIM, and then the increment of the increase of DMI slowed to its peak at over 100 DIM, and then slowly decreased till the end of lactation. For GBR, DMI peaked earlier at ~80 DIM. The mean DMI across lactations was lowest for the GBR and highest for the USA and ELORA herd. The means of the predicted daily records in OVE cows were lower for first-parity than for cows of later parity (parities 2+), but the overall trend across lactation was similar (Fig. 1b). A sudden reduction in DMI around the end of lactation in the USA data shows a lack of enough real DMI records for the RRM analysis. The correlation between predicted and observed phenotypes for DMI in OVE dataset was 0.84.
(a) The mean predicted daily records of dry-matter intake (DMI) in each herd across parities, and (b) the mean predicted daily records of DMI in overseas cows for first and later parities.
The number of OVE cows used in the GWAS was 1958 and 1598 for first and later parities respectively. The overall power of each WGS GWAS was weak (Fig. S2) due to the small size of the OVE datasets, and the total number of variants across the entire WGS with a P-value of <0.001 (P < 10−3) varied from 6144 to 8945 (Supplementary material Table S1). We, therefore, applied this rather lenient threshold to select the most significant five variants (P < 10−3) within every 100-kb window, with a sliding window of 50 kb to generate subsets of sequence variants for genomic prediction. This led to 1460–2222 sequence variants for the lactation time periods, which did not overlap with both 50 k and HD SNP sets and had MAF of more than 0.05 in the AUS cow WGS genotypes (Table S1).
Table 3 shows the genomic heritabilities (h2) at six different time periods for each parity group (OVE cows). The h2 estimates for DMI were all similar (0.31–0.36) in first-parity cows. The h2 estimates in multiparous cows were ~0.20 and started to increase towards the late lactation-time periods, up to 0.32. The standard errors (s.e.) of h2 were similar and ranged from 0.041 to 0.048. The higher h2 in first parity is probably due to a larger dataset size (360 more cows than for later parity (2+ parity group)).
| Time-point ID | DIM start | DIM end | First parity | Later parity | ||||||||||
|---|---|---|---|---|---|---|---|---|---|---|---|---|---|---|
| Number of SNPsA | Number of cows | Vg | Ve | h2 | h2_s.e. | Number of SNPsA | Number of cows | Vg | Ve | h2 | h2_s.e. | |||
| 1_3 | 10 | 39 | 41 970 | 1958 | 0.25 | 0.48 | 0.34 | 0.041 | 42 297 | 1598 | 0.14 | 0.61 | 0.19 | 0.046 |
| 6_8 | 60 | 89 | 42 264 | 1958 | 0.26 | 0.47 | 0.36 | 0.041 | 42 413 | 1598 | 0.16 | 0.59 | 0.21 | 0.046 |
| 11_13 | 110 | 139 | 42 274 | 1958 | 0.25 | 0.50 | 0.33 | 0.042 | 42 425 | 1598 | 0.15 | 0.61 | 0.20 | 0.045 |
| 17_19 | 170 | 199 | 42 412 | 1958 | 0.24 | 0.54 | 0.31 | 0.042 | 42 372 | 1598 | 0.14 | 0.61 | 0.19 | 0.045 |
| 21_23 | 210 | 239 | 42 615 | 1958 | 0.25 | 0.55 | 0.31 | 0.043 | 42 239 | 1598 | 0.18 | 0.60 | 0.23 | 0.046 |
| 25_27 | 250 | 279 | 42 732 | 1958 | 0.29 | 0.55 | 0.34 | 0.043 | 42 046 | 1598 | 0.26 | 0.56 | 0.32 | 0.048 |
DIM, days in milk; Vg, additive genetic variance; Ve, residual variance; s.e., standard error.
ANumber of selected top sequence variants and 50 k SNPs (40 510).
Fig. 2 shows correlation estimates for DMI between six different lactation time periods within and across first (1:) and later (2:) parities. These correlations were calculated based on 14 million SNP effects from each GWAS, which were performed using the phenotypes of overseas cows at six different lactation time periods of first and later parities. As expected, the relationships between neighbouring time periods within first or later parity were strongest (0.72–0.92), and its strength diminished from early to late stages of lactation. The lower correlations for DMI were observed between early and late lactation stages (e.g. the lowest correlation was 0.23). For later-parity cows, the correlations of SNP effects between time periods of lactations were slightly higher than those in the first parity cows. There were lower relationships of SNP effects between the first- and later-parity cows across lactation stages (0.18–0.29).
Correlations for dry-matter intake among six different lactation time periods within and across first (1:) and later (2:) parities. The correlations were calculated on the basis of 14 million SNP effects from GWAS based on the phenotypes of overseas cows at six different lactation time periods of first and later parities. Start and end days in milk (DIM) for each time period are defined in Table 2. Bold values show the correlations between different time periods within each parity and regular values show the correlations between different time periods across first and later parities. White background represents correlations of less than or equal to 0.252; red background represents correlations of higher than 0.252 and less than or equal to 0.50; green background represents correlations of higher than 0.50 and less than or equal to 0.75; yellow background represents correlations of higher than 0.75.
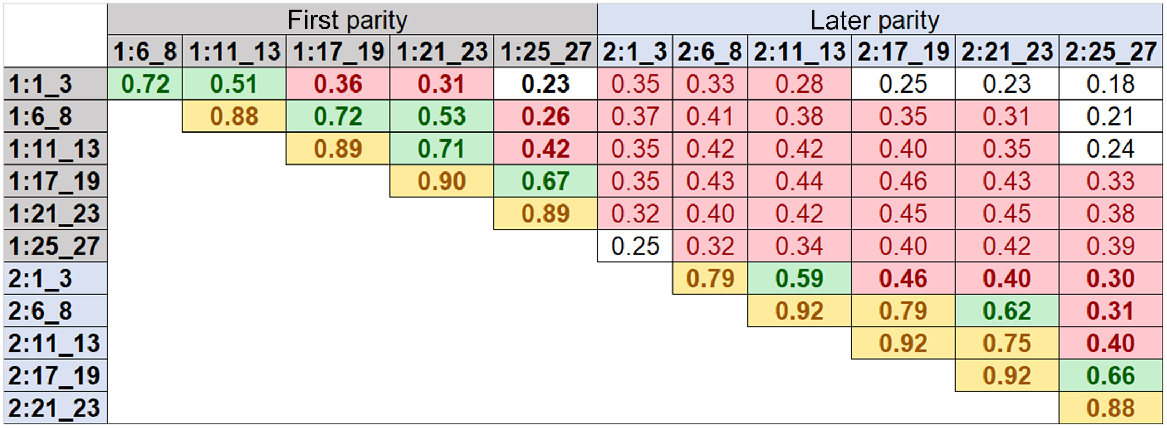
Fig. 3 shows the genomic prediction accuracies for DMI and RFI in AUS cows by using 17 different sets of top sequence variants (as described in the Materials and methods section) in addition to 50 k SNP. The accuracies for DMI were 0.33 and 0.36 by using HD and 50 k SNPs respectively. The accuracies of GEBVs using the 50 k SNP genotypes combined with sequence variants selected from GWAS at different time periods are compared with the accuracies using the genotypes with only 50 k or HD SNPs (Fig. 3). The highest accuracies for DMI GEBVs in AUS cows (up to 0.448) were observed with the combined genotypes of 50 k SNPs, together with the sequence variants selected from GWAS based on phenotypes of the multiparous OVE cows at mid- to late-lactation stages (DIM:170–280). When the sequence variants were selected from two individual GWAS based on the phenotypes of the later-parity cows from two consecutive time periods in late lactation (2:L), the genomic prediction accuracy was higher (0.46) than using those single-lactation time-period GWAS (2:21_23 or 2:25_27) (Fig. 3a). Use of selected sequence variants from the phenotypes of the first-parity OVE cows in different lactation time periods did not improve the accuracy of genomic prediction in AUS cows compared with only the 50 k SNP genotypes. Compared with 50 k SNPs, the genomic prediction accuracy was slightly increased using the 50 k SNPs combined with sequence variants selected from GWAS based on full-lactation DMI records of OVE cows for later parity, but the improvement in accuracy was much less than using the phenotypes specifically for the two later-lactation time periods (2:L, Fig. 3a).
Accuracies of GEBVs for (a) DMI and (b) RFI in AUS cows by using Bayesian approach. Labels on x-axis are HD and 50 k SNP (orange and green respectively), 50 k and plus sequence variants (dark blue), where sequence variants were selected from GWAS for DMI using the phenotypes of overseas cows at each time-point for first (1) and later (2) parities, 50 k and plus sequence variants (purple), which are from GWAS using lactation-wise (lactw) records, and 50 k and plus sequence variants (light blue) where sequence variants were selected from two individual consecutive time-point GWAS (2:E, 2:M, and 2: L).
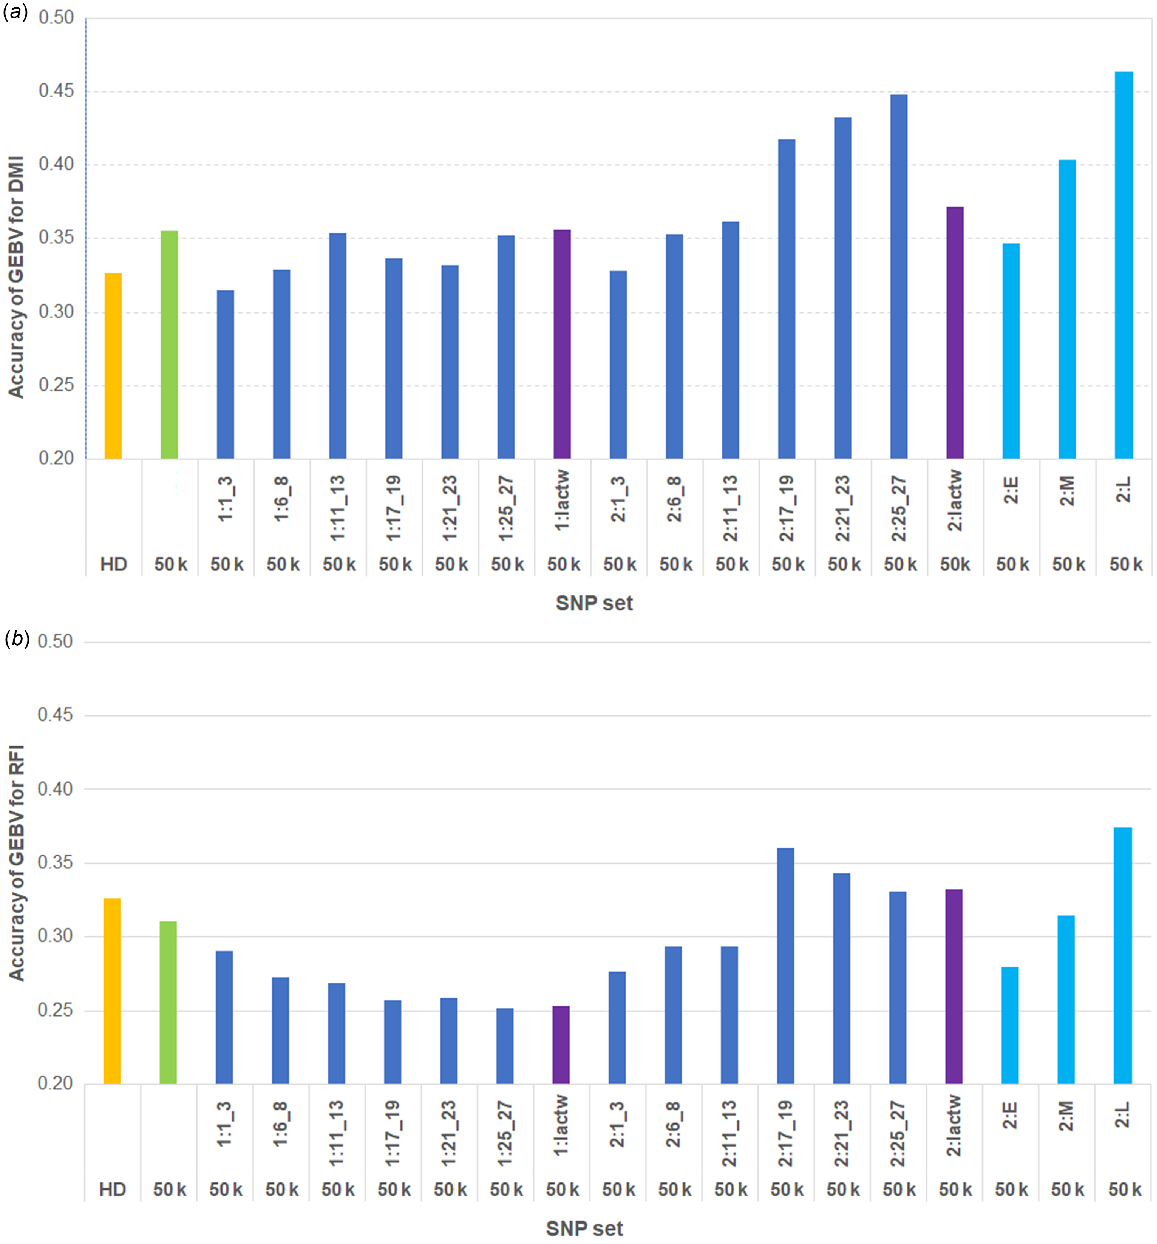
For RFI, similar to DMI, the accuracies of GEBVs were compared using the top sequence variants selected from DMI GWAS combined with 50 k SNPs, versus only the 50 k or HD SNP genotypes (Fig. 3b). The accuracies for RFI were 0.33 and 0.31 by using HD and 50 k SNPs respectively. Compared with 50 k only, higher prediction accuracies were observed in some cases when sequence variants were added, particularly when using phenotypes of the later-parity cows at mid- to late-lactation time periods (DIM:170–280) and across the entire lactation period. The strongest improvement in accuracy of GEBVs for RFI (up to 0.37) was obtained by combining the sequence variants from two GWAS using the phenotypes of two consecutive time periods during late (2:L) lactation (DIM ≥ 200) with 50 k SNPs.
Discussion
In our previous study (Bolormaa et al. 2022), we showed that either sharing of phenotypes and genotypes, or only sharing of signed t-values of SNP effects from sequence GWAS, could generate a custom set of more highly predictive variants for increasing the accuracy of genomic prediction for RFI and DMI. However, that study used only a GWAS for all DMI records jointly, regardless of the lactation time period or parity. Therefore, this study took the next step of exploring whether DMI phenotypes measures at different lactation time periods and/or parities would further increase the accuracy of GEBVs and inform future studies for optimal parity and time periods to record DMI.
DMI is an expensive and difficult-to-measure trait, and therefore its measurement period is often either short and daily, or over a longer period but measured intermittently (e.g. weekly). For example, DMI of the OVE cows used in our GWAS as a discovery population, were measured at different stages of the lactation period (DIM: 5–306 days) and for different lengths of time. DMI in both USA and CAN was mainly measured during early lactation (e.g. 78% of DMI in USA cows were recorded between 6 and 99 DIM) while some were also measured in mid or late lactation periods. The DMI of GBR cows was measured once a week throughout most of the lactation period, and DMI of DNK cows was routinely measured once a week across the entire lactation. This DMI data in the OVE cows is in contrast to that of the AUS cows where most DMI records were collected over a short period (~4–7 weeks) and between 75 and 124 DIM (~70% total records, Table 2).
In this study, collating the OVE data from different countries provided sufficient daily DMI records to cover the entire lactation period, which enabled the use of RRM to predict sporadically missing values. The application of RRM to predict missing values to generate a full description of feed intake and efficiency and increase accuracy of genomic predictions has been used in previous longitudinal studies of chickens, pigs, and both beef and dairy cattle (e.g. Schaeffer and Jamrozik 2008; Bignardi et al. 2011; Berry et al. 2014; Begli et al. 2016; Kang et al. 2017; Wang et al. 2022). An advantage of using RRM is that the multiple records of each animal for different time points are simultaneously analysed together. In the present study, RRM was used only to predict the sporadic missing records of DMI. To predict missing values as accurately as possible, we used the approach of Berry et al. (2014) that divides the lactation into four stages for estimating the residual variance components to account for heterogeneity that exists across the lactation period.
In lactating cows there are marked changes in milk yield and energy balance across both lactation period and parities. Previously, it was shown that combining DMI records from the OVE cows with the AUS cows improved accuracy of genomic prediction (Bolormaa et al. 2022), but previously no consideration has been made for the time period of lactation in which the DMI was recorded in the different herds. However, it is difficult to capture the genetic changes in different energy balance periods during and across lactations. Genetic variation for DMI varies across breeds, populations, lactation stages, and the data used (Tempelman et al. 2015; Hurley et al. 2017; Li et al. 2018; Negussie et al. 2019). Li et al. (2018) found genetic heterogeneity of DMI across lactation in Holstein, Jersey, and Nordic Red breeds, and genetic correlations between DMI at different stages of lactation are much less than unity. This indicates that DMI at different stages of lactation behave as different traits. Similarly in our study, a lower correlation of WGS variant effects (r < 0.80) was found between neighbouring time periods during early lactation stage (10–30 DIM and 60–90 DIM) in both first- and later-parity cows than in the time periods of mid- to late-lactation stage. Also, for both first and later parities in Fig. S1, the EBVs for late periods are the most distinctly different and clustered. The earliest time periods are split from early–mid- and mid–late periods. Manzanilla Pech et al. (2014) also found DMI in early lactation had low genetic correlation with DMI in mid- to late lactation. At early stages of lactation, cows achieve the highest peak milk production with a feed intake deficit, which results in weight loss due to mobilisation of body fat reserve. Negussie et al. (2019) reported that for DMI, the lactation-wise h2 was 0.33 and daily h2 estimates ranged from 0.18 to 0.45 in 227 first-parity Nordic Red cows.
In this study, the number of actual observed DMI records for the first and later parities in the OVE genotyped cows were similar (Table 2). However, 360 more first-parity cows (N = 1958) than later-parity cows (N = 1598) were genotyped, which resulted in higher genomic heritability estimates (~0.31–0.36). There are several reasons that possibly contributed to lower heritabilities in later-parity (2+ parities) cows. First, this is a small dataset recorded in different herds from different continents and there were fewer cows with records in later parities than in first parity, and 20% of later-parity cows were not part of the first-parity cows. Second, the residual variance in later-parity cows was higher (Table 3) possibly due to cow records being combined from different parities (2+). Third, the genetic variance tended to be lower for later-parity cows than the first-parity cows; this might occur because cows in parity 2+ would have been more highly selected for other traits (e.g. milk), which may reduce genetic variance in later-parity cows for DMI compared with first-parity cows. Interestingly, the genomic-heritability estimates based on HD GRM in the later-parity cows increased from 0.2 to 0.32 towards the later stages of the lactation, indicating that the late-lactation period is capturing more genetic variation in the OVE cows.
The improvement of the genomic prediction accuracy obtained for feed intake and efficiency using sequence variants particularly from later parity is interesting because it could help inform data use and/or improve design of collaborative projects for these expensive and difficult-to-measure traits. The effect of most SNPs on DMI are small as expected for a complex trait, which is why we used a lenient P-value threshold to select SNPs (Fig. S2). By analysing SNP associations with DMI over different lactation periods may help increase power and/or detect a slightly different set of variants. This may be due to real genetic differences or genetic signal-to-noise ratio is variable across the lactation. The use of sequence variants, selected from GWAS for DMI by using the later-parity OVE cow data in mid- to late-lactation (DIM:170–280), gave the highest accuracy of GEBVs for AUS cows (Fig. 2). This is interesting because the majority of real DMI measurements for OVE (discovery population) were recorded earlier in lactation. Furthermore, very few AUS cow DMI records (used for training prediction) were taken in mid- to late-lactation (DIM > 140). This suggests that the DMI records from mid- to late-lactation perhaps capture the effects of some specific variants more accurately than those from other time periods, rather than there being a specific set of variants that better predict the same time period. Interestingly, the proportion of sequence variants estimated to have non-zero variance was considerably higher in the later-parity group (51%) than in the first-parity group (41%). Additionally, the proportion of sequence variants with non-zero variance was higher in the last two time periods (54%) of later-parity group than in the earliest two time periods (46%). This indicates that the measurement of DMI phenotypes from the mid- to late lactation-time periods is appealing to detect the associated WGS variants that may help increase genomic prediction accuracy through custom SNP panels.
Because there were high correlations between SNP effects from neighbouring time periods (r > 0.88, Fig. 2), we combined the sequence variants from two consecutive time periods, to see whether the accuracies reflect a wider time frame, as early (DIM ≤ 100), mid- (100 < DIM < 200), and late (DIM ≥ 200) lactation stages. Combining the sequence variants of two time periods during later (DIM ≥ 200) lactation stage further increased the accuracy of GEBVs. This might be due to combining of SNPs with a moderate effect that were detected uniquely to one or other time period. This result suggests that if resources are limited for DMI measurements across the entire lactation, it may be better to narrow down the period of measurements towards later lactation stage and later parities.
Splitting phenotypes into different time periods for the first-parity OVE cows did not result in sets of sequence variants that improved accuracy of genomic prediction in AUS cows. Indeed, in some cases it appears to drop slightly compared with 50 k SNPs only. This could be because a much smaller proportion of daily DMI records were collected across the AUS first-parity cows (Table 2). Another reason may be that there is still a growth and development phase occurring during first parity of young cows, and first-lactation cows having a more naïve immune system than for cows with more parturitions (Strucken et al. 2015). Furthermore, some studies showed low to moderate genetic and phenotypic correlations (0.3–0.4) between RFI of growing cattle and RFI of lactating mature cows (Arthur et al. 1999; Bolormaa et al. 2022), which may be due to the differences in efficiency of energy partitioning in growth and lactation. Selection of sequence variants using a full set of phenotypes for DMI across lactation (lactation-wise phenotypes) of OVE cows for later parity did improve the accuracy of GEBVs in AUS cows, but improvement was much less than using only the phenotypes at later-lactation time periods (Fig. 3a). It is possible that during these later-lactation time periods the physiological noise (e.g. post-partum stress, energy balance and peak milk production) is lower.
Ideally, this approach should be used in a GWAS using the same animals in the first and later parities and validated in a population that had DMI recorded across the entire lactation period. This would enable disentangling of the value of measuring phenotypes at different time periods and identify the largest increase in accuracy at each time period and parity. Here, we used all OVE cows in the discovery set, therefore using OVE cows as a validation set for genomic prediction would introduce bias. Additionally, because the current number of OVE cows used in the GWAS discovery set was small (1958 and 1598 cows in first and later parities respectively), we did not attempt to reduce it further to create an additional independent validation set. However, it is advisable to confirm the effectiveness of this approach for improving accuracy of genomic prediction with larger datasets.
The sequence variants were selected only on on the basis of DMI rather than RFI because the number of observed records for DMI of OVE cows used in RRM was already small, and hence we did not try to calculate the RFI phenotypes on the basis of the predicted and observed phenotypes from RRM. The RFI phenotypes of AUS cows used in the genomic prediction were previously calculated on the basis of all available AUS records of DMI across the whole test period (there was not enough records for different time points). The DMI-selected sequence variants from later lactation time periods increased the accuracy of RFI, although to a lesser extent than did the accuracy of DMI. This is expected considering high correlations between DMI and RFI (Manzanilla-Pech et al. 2021). This result shows predictive sequence variants were effective in increasing the genomic prediction accuracy of RFI and DMI. Moreover, a possible genotype-by-environment (G × E) interaction effect could exist across broader groups of cows (across continents). Berry et al. (2014) reported that genetic correlations for DMI among North America, European high-input (DNK) and low-input (GBR), and grazing (i.e. AUS) cow populations varied from 0.14 to 0.84 by using across-parity data. In this study, we used the OVE cows as a discovery population for selecting the top sequence variants to use in the prediction analysis for AUS cows. It is possible that G × E interaction effect of a genetic variant on complex trait could lead to the differences in benefit of variant sets selected at different time periods.
In the BayesRC RFI analyses, it is difficult to determine why, in some cases, the accuracy appeared to drop when using the 50 k genotypes plus sequence variants from the first parity compared with the 50 k genotypes on their own. Generally, we find for BayesRC that adding a randomly selected set of variants in addition to a standard SNP chip did not result in a drop in accuracy because there is a flat prior for all SNP sets. However, it may be due to the small training and validation datasets, or possibly BayesRC analysis overpredicted the effects of some DMI-selected sequence variants for the RFI trait. Therefore, our results should be interpreted with caution due to the small size of the reference and validation sets used in this study.
Because the primary focus of this study was improving genomic prediction by using sequence variants at different time points during the lactation and lifetime of cows, we did not discuss the dynamic (changing) associations for DMI. Due to small numbers of cows used in the discovery populations, there was low power to detect variants with small to moderate effects in these 12 GWAS at the more traditional significance levels (e.g. P < 1 × 10⁻⁵; Fig. S2). Only a few association studies in livestock reported the dynamic expression of genes involved in milk production across the lactation (Bionaz and Loor 2008; Verbyla and Verbyla 2009) but not for DMI. Markers close to the casein genes had the strongest effects in early lactation and the effects of the DGAT1 gene were detectable after 40 DIM (Strucken et al. 2011). Therefore, dynamic association studies could help in identifying potential physiological mechanisms to enhance feed- and milk-production efficiency. Overall, there are many potential avenues to improve availability of DMI phenotypes both directly and indirectly, such as use of intermediate phenotypes such as milk mid-infrared spectroscopy and nuclear magnetic-resonance data, and cow methane emission due to its correlation with DMI (Herd et al. 2014; Callegaro et al. 2022).
Conclusions
The genomic prediction of DMI can be improved by including sequence variants of a DMI GWAS selected from independent populations. Selecting these variants from GWAS performed using phenotypes of DMI at specific lactation stages appears to be advantageous, in particular the later-parity cows at the late-lactation stages provided an increase in genomic prediction accuracy of DMI and RFI. Thus, using phenotypes at particular lactation stages can help increase genomic accuracy for DMI and RFI through custom SNP panels to use in genomic selection programs. Additionally, our findings are important because a higher accuracy of GEBVs at late-stage lactation in later-parity cows might indirectly indicate the optimal time to collect data on feed intake. However, this result should be interpreted with caution because of the small size of the reference and validation sets used in this study. Further confirmation of the effectiveness of this approach for improving of accuracy of genomic prediction with larger datasets is recommended. Ideally, future studies would include large data sets that are recorded across full lactation (first and later parities) to determine which time periods and parities are the most indicative of full lactation or lifetime DMI and RFI.
Data availability
The data that support this study was obtained from The Efficient Dairy Genome Project (EDGP, www.genomedairy.ualberta.ca), an international initiative that combines data from six countries (Australia, Canada, Denmark, United Kingdom, United States, and Switzerland). Access to the data is restricted to collaborators.
Acknowledgements
We thank DairyBio, jointly funded by Dairy Australia (Melbourne, Australia), The Gardiner Foundation (Melbourne, Australia) and Agriculture Victoria (Melbourne, Australia) for funding this project. The authors gratefully acknowledge the use of data from Ellinbank Research Centre (belonging to Agriculture Victoria) and the EDGP and its participants. EDGP was funded by Genome Canada (Ottawa, ON, Canada), Genome Alberta (Calgary, AB, Canada), Ontario Genomics (Toronto, ON, Canada), Alberta Ministry of Agriculture (Edmonton, AB, Canada), Ontario Ministry of Research and Innovation (Toronto, ON, Canada), Ontario Ministry of Agriculture, Food and Rural Affairs (Guelph, ON, Canada), Canadian Dairy Network (Guelph, ON, Canada), GrowSafe Systems (Airdrie, AB, Canada), Alberta Milk (Edmonton, AB, Canada), Agriculture Victoria (Australia), Scotland’s Rural College (Edinburgh, UK), USDA Agricultural Research Service (Beltsville, MD), Qualitas AG (Zug, Switzerland), and Aarhus University (Aarhus, Denmark). The staff caring for the cows used in the study are gratefully acknowledged. We also thank the anonymous reviewers for their constructive feedback that helped improve this paper.
References
Arthur PF, Archer JA, Herd RM, Richardson EC, Exton SC, Oswin C, Dibley KCP, Burton DA (1999) Relationship between postweaning growth, net feed intake and cow performance. Proceedings of the Association for the Advancement of Animal Breeding and Genetics 13, 484-487.
| Google Scholar |
Begli HE, Torshizi RV, Masoudi AA, Ehsani A, Jensen J (2016) Longitudinal analysis of body weight, feed intake and residual feed intake in F2 chickens. Livestock Science 184, 28-34.
| Crossref | Google Scholar |
Berry DP, Coffey MP, Pryce JE, de Haas Y, Løvendahl P, Krattenmacher N, Crowley JJ, Wang Z, Spurlock D, Weigel K, Macdonald K, Veerkamp RF (2014) International genetic evaluations for feed intake in dairy cattle through the collation of data from multiple sources. Journal of Dairy Science 97, 3894-3905.
| Crossref | Google Scholar |
Bignardi AB, El Faro L, Torres Júnior RAA, Cardoso VL, Machado PF, Albuquerque LG (2011) Random regression models using different functions to model test-day milk yield of Brazilian Holstein cows. Genetics and Molecular Research 10, 3565-3575.
| Crossref | Google Scholar |
Bionaz M, Loor JJ (2008) ACSL1, AGPAT6, FABP3, LPIN1, and SLC27A6 are the most abundant isoforms in bovine mammary tissue and their expression is affected by stage of lactation. The Journal of Nutrition 138(6), 1019-1024.
| Crossref | Google Scholar |
Bolormaa S, Pryce JE, Kemper K, Savin K, Hayes BJ, Barendse W, Zhang Y, Reich CM, Mason BA, Bunch RJ, Harrison BE, Reverter A, Herd RM, Tier B, Graser H-U, Goddard ME (2013) Accuracy of prediction of genomic breeding values for residual feed intake and carcass and meat quality traits in Bos taurus, Bos indicus, and composite beef cattle. Journal of Animal Science 91, 3088-3104.
| Crossref | Google Scholar |
Bolormaa S, Swan AA, Brown DJ, Hatcher S, Moghaddar N, van der Werf JH, Goddard ME, Daetwyler HD (2017) Multiple-trait QTL mapping and genomic prediction for wool traits in sheep. Genetics Selection Evolution 49(1), 62.
| Crossref | Google Scholar |
Bolormaa S, Chamberlain AJ, Khansefid M, Stothard P, Swan AA, Mason B, Prowse-Wilkins CP, Duijvesteijn N, Moghaddar N, van der Werf JH, Daetwyler HD, MacLeod IM (2019) Accuracy of imputation to whole-genome sequence in sheep. Genetics Selection Evolution 51(1), 1.
| Crossref | Google Scholar |
Bolormaa S, MacLeod IM, Khansefid M, Marett LC, Wales WJ, Miglior F, Baes CF, Schenkel FS, Connor EE, Manzanilla-Pech CIV, Stothard P, Herman E, Nieuwhof GJ, Goddard ME, Pryce JE (2022) Sharing of either phenotypes or genetic variants can increase the accuracy of genomic prediction of feed efficiency. Genetics Selection Evolution 54(1), 60.
| Crossref | Google Scholar |
Brøndum RF, Su G, Janss L, Sahana G, Guldbrandtsen B, Boichard D, Lund MS (2015) Quantitative trait loci markers derived from whole genome sequence data increases the reliability of genomic prediction. Journal of Dairy Science 98(6), 4107-4116.
| Crossref | Google Scholar |
Callegaro S, Niero G, Penasa M, Finocchiaro R, Invernizzi G, Cassandro M (2022) Greenhouse gas emissions, dry matter intake and feed efficiency of young Holstein bulls. Italian Journal of Animal Science 21(1), 870-877.
| Crossref | Google Scholar |
Das S, Forer L, Schönherr S, Sidore C, Locke AE, Kwong A, Vrieze SI, Chew EY, Levy S, McGue M, Schlessinger D, Stambolian D, Loh P-R, Iacono WG, Swaroop A, Scott LJ, Cucca F, Kronenberg F, Boehnke M, Abecasis GR, Fuchsberger C (2016) Next-generation genotype imputation service and methods. Nature Genetics 48, 1284-1287.
| Crossref | Google Scholar |
de Haas Y, Calus MPL, Veerkamp RF, Wall E, Coffey MP, Daetwyler HD, Hayes BJ, Pryce JE (2012) Improved accuracy of genomic prediction for dry matter intake of dairy cattle from combined European and Australian data sets. Journal of Dairy Science 95(10), 6103-6112.
| Crossref | Google Scholar |
Erbe M, Hayes BJ, Matukumalli LK, Goswami S, Bowman PJ, Reich CM, Mason BA, Goddard ME (2012) Improving accuracy of genomic predictions within and between dairy cattle breeds with imputed high-density single nucleotide polymorphism panels. Journal of Dairy Science 95, 4114-4129.
| Crossref | Google Scholar |
Grisart B, Coppieters W, Farnir F, Karim L, Ford C, Berzi P, Cambisano N, Mni M, Reid S, Simon P, Spelman R, Georges M, Snell R (2002) Positional candidate cloning of a QTL in dairy cattle: identification of a missense mutation in the bovine DGAT1 gene with major effect on milk yield and composition. Genome Research 12, 222-231.
| Crossref | Google Scholar |
Hayes BJ, Daetwyler HD (2019) 1000 bull genomes project to map simple and complex genetic traits in cattle: applications and outcomes. Annual Review of Animal Biosciences 7, 89-102.
| Crossref | Google Scholar |
Herd RM, Arthur PF, Donoghue KA, Bird SH, Bird-Gardiner T, Hegarty RS (2014) Measures of methane production and their phenotypic relationships with dry matter intake, growth, and body composition traits in beef cattle. Journal of Animal Science 92(11), 5267-5274.
| Crossref | Google Scholar |
Hurley AM, López-Villalobos N, McParland S, Lewis E, Kennedy E, O’Donovan M, Burke JL, Berry DP (2017) Genetics of alternative definitions of feed efficiency in grazing lactating dairy cows. Journal of Dairy Science 100(7), 5501-5514.
| Crossref | Google Scholar |
Kang H, Zhou L, Mrode R, Zhang Q, Liu J-F (2017) Incorporating the single-step strategy into a random regression model to enhance genomic prediction of longitudinal traits. Heredity 119(6), 459-467.
| Crossref | Google Scholar |
Kemper KE, Reich CM, Bowman PJ, vander Jagt CJ, Chamberlain AJ, Mason BA, Hayes BJ, Goddard ME (2015) Improved precision of QTL mapping using a nonlinear Bayesian method in a multi-breed population leads to greater accuracy of across-breed genomic predictions. Genetics Selection Evolution 47(1), 29.
| Crossref | Google Scholar |
Li B, Fikse WF, Løvendahl P, Lassen J, Lidauer MH, Mäntysaari P, Berglund B (2018) Genetic heterogeneity of feed intake, energy-corrected milk, and body weight across lactation in primiparous Holstein, Nordic Red, and Jersey cows. Journal of Dairy Science 101(11), 10011-10021.
| Crossref | Google Scholar |
Loh P-R, Danecek P, Palamara PF, Fuchsberger C, Reshef YA, Finucane HK, Schoenherr S, Forer L, McCarthy S, Abecasis GR, Durbin R, Price AL (2016) Reference-based phasing using the Haplotype Reference Consortium panel. Nature Genetics 48, 1443-1448.
| Crossref | Google Scholar |
Macdonald KA, Pryce JE, Spelman RJ, Davis SR, Wales WJ, Waghorn GC, Williams YJ, Marett LC, Hayes BJ (2014) Holstein-Friesian calves selected for divergence in residual feed intake during growth exhibited significant but reduced residual feed intake divergence in their first lactation. Journal of Dairy Science 97, 1427-1435.
| Crossref | Google Scholar |
MacLeod IM, Bowman PJ, Vander Jagt CJ, Haile-Mariam M, Kemper KE, Chamberlain AJ, Schrooten C, Hayes BJ, Goddard ME (2016) Exploiting biological priors and sequence variants enhances QTL discovery and genomic prediction of complex traits. BMC Genomics 17(1), 144.
| Crossref | Google Scholar |
Manzanilla Pech CIV, Veerkamp RF, Calus MPL, Zom R, van Knegsel A, Pryce JE, De Haas Y (2014) Genetic parameters across lactation for feed intake, fat- and protein-corrected milk, and liveweight in first-parity Holstein cattle. Journal of Dairy Science 97(9), 5851-5862.
| Crossref | Google Scholar |
Manzanilla-Pech CIV, Løvendahl P, Mansan Gordo D, Difford GF, Pryce JE, Schenkel F, Wegmann S, Miglior F, Chud TC, Moate PJ, Williams SRO, Richardson CM, Stothard P, Lassen J (2021) Breeding for reduced methane emission and feed-efficient Holstein cows: an international response. Journal of Dairy Science 104(8), 8983-9001.
| Crossref | Google Scholar |
Moghaddar N, Khansefid M, van der Werf JHJ, Bolormaa S, Duijvesteijn N, Clark SA, Swan AA, Daetwyler HD, MacLeod IM (2019) Genomic prediction based on selected variants from imputed whole-genome sequence data in Australian sheep populations. Genetics Selection Evolution 51(1), 72.
| Crossref | Google Scholar |
Negussie E, Mehtiö T, Mäntysaari P, Løvendahl P, Mäntysaari EA, Lidauer MH (2019) Reliability of breeding values for feed intake and feed efficiency traits in dairy cattle: when dry matter intake recordings are sparse under different scenarios. Journal of Dairy Science 102(8), 7248-7262.
| Crossref | Google Scholar |
Pryce JE, Gonzalez-Recio O, Nieuwhof G, Wales WJ, Coffey MP, Hayes BJ, Goddard ME (2015) Hot topic: definition and implementation of a breeding value for feed efficiency in dairy cows. Journal of Dairy Science 98, 7340-7350.
| Crossref | Google Scholar |
Sargolzaei M, Chesnais JP, Schenkel FS (2014) A new approach for efficient genotype imputation using information from relatives. BMC Genomics 15(1), 478.
| Crossref | Google Scholar |
Schaeffer LR, Jamrozik J (2008) Random regression models: a longitudinal perspective. Journal of Animal Breeding and Genetics 125(3), 145-146.
| Crossref | Google Scholar |
Schennink A, Stoop WM, Visker MHPW, Heck JML, Bovenhuis H, van der Poel JJ, van Valenberg HJF, van Arendonk JAM (2007) DGAT1 underlies large genetic variation in milk-fat composition of dairy cows. Animal Genetics 38, 467-473.
| Crossref | Google Scholar |
Strucken EM, de Koning DJ, Rahmatalla SA, Brockmann GA (2011) Lactation curve models for estimating gene effects over a timeline. Journal of Dairy Science 94(1), 442-449.
| Crossref | Google Scholar |
Strucken EM, Bortfeldt RH, de Koning DJ, Brockmann GA (2012) Genome-wide associations for investigating time-dependent genetic effects for milk production traits in dairy cattle. Animal Genetics 43, 375-382.
| Crossref | Google Scholar |
Strucken EM, Laurenson YCSM, Brockmann GA (2015) Go with the flow-biology and genetics of the lactation cycle. Frontiers in Genetics 6, 118.
| Crossref | Google Scholar |
Tempelman RJ, Spurlock DM, Coffey M, Veerkamp RF, Armentano LE, Weigel KA, de Haas Y, Staples CR, Connor EE, Lu Y, VandeHaar MJ (2015) Heterogeneity in genetic and nongenetic variation and energy sink relationships for residual feed intake across research stations and countries. Journal of Dairy Science 98(3), 2013-2026.
| Crossref | Google Scholar |
van den Berg I, Boichard D, Lund MS (2016) Sequence variants selected from a multi-breed GWAS can improve the reliability of genomic predictions in dairy cattle. Genetics Selection Evolution 48, 83.
| Crossref | Google Scholar |
van den Berg I, Bowman PJ, MacLeod IM, Hayes BJ, Wang T, Bolormaa S, Goddard ME (2017) Multi-breed genomic prediction using Bayes R with sequence data and dropping variants with a small effect. Genetics Selection Evolution 49(1), 70.
| Crossref | Google Scholar |
VanRaden PM, Tooker ME, O’connell JR, Cole JB, Bickhart DM (2017) Selecting sequence variants to improve genomic predictions for dairy cattle. Genetics Selection Evolution 49(1), 32.
| Crossref | Google Scholar |
Verbyla KL, Verbyla AP (2009) Estimated breeding values and association mapping for persistency and total milk yield using natural cubic smoothing splines. Genetics Selection Evolution 41(1), 48.
| Crossref | Google Scholar |
Wang Y, Diao C, Kang H, Hao W, Mrode R, Chen J, Liu J, Zhou L (2022) A random regression model based on a single-step method for improving the genomic prediction accuracy of residual feed intake in pigs. Frontiers in Genetics 12, 769849.
| Crossref | Google Scholar |
Yang J, Lee SH, Goddard ME, Visscher PM (2011) GCTA: a tool for genome-wide complex trait analysis. The American Journal of Human Genetics 88(1), 76-82.
| Crossref | Google Scholar |