

Net greenhouse-gas emissions and reduction opportunities in the Western Australian beef industry
Stephen Wiedemann A * , Emma Longworth A and Riley O’Shannessy A
A
Abstract
The Western Australian (WA) Government has set ambitious emission reduction targets and is developing strategies to reduce emissions across the state economy, including agriculture.
This study determined the product carbon footprint (CF) and total emissions of the WA beef industry, to establish a baseline for emission reduction planning.
A cradle-to-gate attributional life-cycle assessment with a reconciled livestock inventory of herd numbers and turnoff, was used. Emission reduction strategies were examined and included herd management, enteric-methane mitigation, and removals via carbon sequestration in vegetation and soils.
Modelled livestock numbers were found to be 36% higher than reported in the Australian Bureau of Statistics (ABS), resulting in an emission profile of 4.7 million tonnes (Mt) of carbon dioxide equivalent (CO2-e) (excluding land use (LU) and direct LU change (dLUC)). This profile was 26% higher than emissions reported in state inventories. LU and dLUC were estimated to be a greenhouse-gas removal of −2.6 Mt CO2-e, although with high uncertainty. The mean CF for WA was 15.3 kg CO2-e per kg liveweight (LW) (excluding LU and dLUC). State-wide removals from LU and dLUC were estimated to be −8.5 kg CO2-e/kg LW. The CF was 11.7, 19.2 and 18.2 kg CO2-e/kg LW for the Agricultural, Kimberley and Arid regions respectively. The implementation of herd-management strategies and anti-methanogenic supplements resulted in a maximum 25% reduction.
Herd productivity and market specifications were key drivers of regional differences in CF. Opportunities exist to reduce the CF in northern herds through diverting cattle to Australian backgrounding and feedlot supply chains to reach slaughter weight at a younger age. Adoption of anti-methanogenic feed supplements were important; however, achieving major reductions in the next decade will rely on removals via carbon sequestration in soil and vegetation.
Considering the magnitude of removals and elevated uncertainty in this result, further research and new datasets are needed to refine this analysis. New datasets are required to accurately report livestock numbers and track and reduce future GHG emissions from this higher baseline. Technical, cost and adoption barriers will need to be addressed by developing actionable pathways to achieve emission reduction in the mid- to long term.
Keywords: beef cattle, carbon footprint, climate change, emission reduction strategies, greenhouse gas, herd inventory, lifecycle assessment, red meat, sustainable agriculture, Western Australia.
Introduction
The Western Australian (WA) Government has set a goal of net-zero emissions by 2050 (DWER 2020) and is developing strategies to reduce emissions across the state economy, including agriculture (Department of Primary Industries and Regional Development 2023), following the need for global climate action under the Paris Agreement (United Nations 2015). Net-zero greenhouse-gas (GHG) emissions are defined as the balance of human-caused (anthropogenic) residual GHG emissions and human-led removals over a specified period (ISO 2022). To meet these targets and the increasing demand for meat (OECD/FAO 2022), the Australian beef industry will need to increase total production while substantially and rapidly reducing it’s carbon footprint (CF) on the path to net zero. This will require investigation of actionable emission reduction pathways and adoption of new technologies. However, a key concern is that the Australian beef herd is significantly larger than the Australian Bureau of Statistics (ABS) survey data suggests (ABS 2020a), implying that GHG emissions are also higher than those reported in the National Greenhouse Gas Inventory (NGGI) (Wiedemann et al. 2016; Fordyce et al. 2021).
The WA beef industry provides a unique case study because it is isolated from other beef supply chains. It contributes 7% of Australia’s beef production value, with a live export and domestic slaughter supply chain and minimal eastern state transfers (ABS 2020b). Cattle production in WA is separated into distinct northern tropical (Kimberley region), central arid (Arid region) and southern (Agricultural region) herds. Northern tropical and central arid production systems are mostly extensive pastoral stations that operate with low inputs. The central arid region has hot summers, mild winters and low and variable rainfall, which transitions into more distinct wet and dry seasons in the Kimberley. These systems utilise native and naturalised grasslands (Stockdale et al. 2012), with tropically adapted cattle consisting mostly of Bos indicus cattle, which can withstand the harsher environment and high climate variability (Gleeson et al. 2012). Southern production systems are characterised by a more favourable, temperate climate and use greater inputs. These aspects drive pasture productivity, allowing higher proportions of Bos taurus breeds with improved cattle performance (Bryan et al. 2014). Cattle from northern regions not destined for live export must be transported large distances for slaughter, backgrounding or finishing in southern WA. The recent development of a feedlot in the northern grains region (Wiedemann et al. 2022a) will reduce the distance northern cattle are transported for finishing, improving the productivity of northern cattle by achieving heavier slaughter weights at a younger age.
This study aimed to
determine the industry’s baseline emissions for the average of two financial years (FY), 2018 and 2019,
provide a hotspot analysis of emission sources, and
measure the impact and importance of emission reduction strategies.
Emission reduction strategies were contextualised through comparison with industry targets to examine the possibility of achieving large, short-term reductions in net emissions in the WA beef sector.
Materials and methods
System boundaries and reference flow
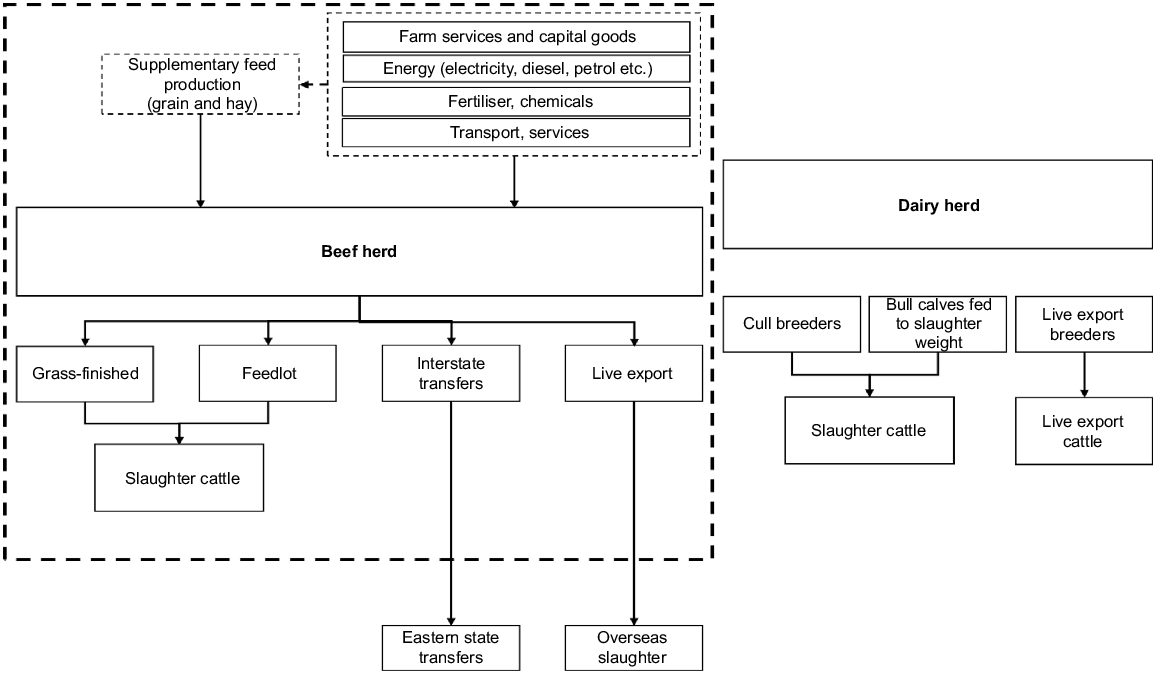
This study completed a cradle-to-farm-gate product CF of the WA beef herd, by using a reference flow of ‘1 kg of liveweight (LW)’ on farm, immediately prior to processing, transfer to eastern states or load port for live export. The product CF used a life-cycle assessment (LCA) approach as required in the International Organization for Standardization (ISO) 14067 (ISO 2018). LCA is a primary tool for the assessment of environmental impacts and environmental efficiency within supply chains, and typically assesses impacts relative to the functional output of the system (typically, one unit of output, termed the ‘reference flow’ or ‘functional unit’). Carbon footprinting, when following the LCA approach, is a comprehensive means of assessing carbon impacts for a product, using a defined system (emission) boundary. In the present study, the system boundary included beef production in the state of WA, but excluded beef from dairy cattle and live-export dairy cattle, which contribute less than 6% and 2% respectively, to total WA beef production (ABS 2022a) (Fig. 1). The system boundary included pre-farm and on-farm emission sources from farm services (e.g. purchased feed, diesel, petrol, electricity, administration) and other purchased inputs (e.g. herbicides and pesticides) and stopped at the point where cattle were transported for meat processing, or were transferred out of the state for live export or to eastern states.
System boundary diagram, showing coverage of the cradle-to-farm-gate primary production system of cattle produced in Western Australia (dashed line) and excluded production systems.
The study investigated the CF (which could also be considered a GHG emission intensity by using an LCA emission boundary) and total emissions from cattle production in WA averaged over financial year (FY) 2018 (1 July 2017 – 2030 June 2018) and FY 2019 (1 July 2018 – 2030 June 2019). The average of two financial years was used to minimise seasonal variability and capture a minimum of one complete production cycle of livestock inventories, which is required for determining the baseline emissions for agricultural sectors (Sevenster et al. 2023).
Regions and production systems
The WA beef herd was divided into the following three production regions: the Agricultural region, which includes the Central and South Wheatbelt, the North and East Wheatbelt, and the Southwest Coastal regions; the Kimberley; and the Arid region, which includes the Pilbara and the Central Pastoral region. The proportion of cattle from each region destined for slaughter and live export in WA was determined using data from the Australian Bureau of Agriculture and Resource Economics (ABARES) (ABARES 2021). Cattle transferred to eastern states via Ceduna were assumed to be from the Agricultural region, and cattle transferred across northern borders were assumed to be predominately from the Kimberley (80%) and the Arid (20%) regions (Western Australian Department of Primary Industries and Regional Development – DPIRD, K Pritchettpers. comm.).
Inventory data
A spatially defined WA cattle herd inventory was developed following methods reported in Wiedemann et al. (2019) and was adapted to include live-export cattle. The herd inventory was developed from statistics on head numbers and gross weights of livestock slaughtered (ABS 2020b), live exported (DAWE 2022), transferred to eastern states (data supplied by DPIRD) and the annual ABARES survey (ABARES 2020) for livestock productivity parameters. Feedlot cattle numbers were determined from Australian Lot Feeders Association (ALFA) (ALFA 2020) statistics. The herd inventory followed a top–down approach and was constructed to reflect a self-replacing herd that produced sufficient calf numbers, which reconciled to ABS slaughter, live-export and eastern-state transfer statistics. Beef production from culled dairy cows and progeny was excluded, following methods reported elsewhere (Wiedemann et al. 2019). The age of young cattle at processing was required to determine average daily gain (ADG) and is a sensitive parameter of herd productivity and CF (Wiedemann et al. 2016). For slaughter cattle, ADG was estimated from reported inventory data (Wiedemann et al. 2022b) and via consultation with industry experts. Age at load port for live-export cattle was determined via industry surveys and datasets available from a limited number of stations (data not shown). Farm input data such as farm fuel use, feed inputs, fertiliser, services and cattle transport throughout the supply chain were estimated from ABARES (2020) and cross-checked with case-study farm data (data not shown). More detail on the methods and definitions in the datasets used in this study are provided in the explanatory report by ABARES (2022), and further details are provided in previous studies (Wiedemann et al. 2015, 2019). The herd productivity data were used to estimate dry-matter intake following the Australian NGGI feed-intake model (Commonwealth of Australia 2022a).
Land use (LU) and direct LU change (dLUC)
LU and LUC emissions and removals were calculated using the NGGI (Commonwealth of Australia 2022a) and attributed to the cattle industry by using the approach of Mayberry et al. (2019). The total land area used for livestock production was determined from statistical area level 2 (SA2) data derived from ABS (2021), and estimates of stocking densities of sheep and cattle were used to allocate LU between livestock systems. Changes in LU and LUC were accounted from the following categories from the National GHG Inventory: cropland remaining cropland, land converted to cropland, forest land remaining forest land, land converted to forestland, grassland remaining grassland and land converted to grassland. Cattle grazing cropland was estimated to be 15% in the baseline years (DPIRD 2022, M Curnow pers. comm.). Emissions and removals from perennial woody crops were excluded as not being attributable to livestock. Of the forest land remaining forest land category, 5% was allocated to cattle production on the basis of regional distribution.
The analysis of LU categories showed that grasslands occurred in the Kimberley and Arid regions, whereas the Agricultural region is largely forestlands and croplands. For this reason, it was assumed that of the grassland and grassland converted to forestland emissions, 99% were attributable to cattle and 1% to sheep, based on the distribution of sheep and cattle in pastoral regions, where sheep are now infrequently grazed (DPIRD 2022, M Curnow pers. comm.). There were no high-precision geospatial datasets showing the intersection among land categories, emissions, removals and livestock production, and estimates were required at the agroecological-zone level. The study attributed 40% of impacts from natural regeneration and regrowth on cleared lands to the rangelands where grazing systems and regeneration co-exist (DPIRD 2022, M Curnow pers. comm.). The remaining 60% was assumed to occur in conservation areas. A total of 40% of sequestration from environmental plantings was attributed to livestock. Sequestration from hardwood and softwood plantations was assumed to be part of the agroforestry sector and was not attributed to livestock. Impacts from other emissions associated with LU and dLUC were attributed using the same ratios as noted above. It was assumed that 40% of controlled burning is for managed fires on grazing lands. Emissions from wildfires were excluded because they are endemic to the natural environment and should not be directly attributed to the beef farming enterprise (Wiedemann et al. 2016).
Greenhouse-gas emission calculations
GHG emissions were modelled by region for livestock emissions (enteric methane and manure) and purchased inputs (fuel, electricity, feed, cattle, etc.) throughout the supply chain. This study conducted livestock GHG emission modelling using NGGI methods with state-specific activity data as applied for feedlots (Wiedemann et al. 2017) and grazing systems (Wiedemann et al. 2016). Within the NGGI, emissions from grazing cattle are estimated on the basis of relationships between dry-matter intake (DMI) and methane production derived from analysis of Australian respiration-chamber data (Charmley et al. 2016). The estimation of DMI is based on Australian derived relationships that rely primarily on the animals’ weight, weight gain and milk production (Tables 1 and 2). While dry-matter digestibility is known to influence productivity and methane emissions, the NGGI feed-intake equations assume that higher growth rates require higher digestibility and it could be argued that this is accounted for indirectly. The methods comply with the international guidelines for conducting livestock LCA (FAO 2016). Regional dietary crude protein and dry-matter digestibility were outlined in the NGGI (Commonwealth of Australia 2022a). The NGGI (Commonwealth of Australia 2022a) applied the enteric-methane equation from Moe and Tyrrell (1979) for feedlot enteric-methane emissions. This method has not been validated by Australian research and has resulted in higher emission estimates than Australian studies (McGinn et al. 2008; de Almeida et al. 2021). Nevertheless, this method was used in the baseline assessment.
| Inventory | Modelled estimate | Source dataset value | Source reference | |
|---|---|---|---|---|
| Opening number of cattle | ||||
| Calves of <1 year (number) | 815 843 | 485 897 | ABS (2020a) | |
| Calves for replacements | 210 534 | |||
| Calves for mature sales | 536 351 | |||
| Calves for weaner sales | 68 958 | |||
| Cows and heifers 1 year and over (number) (ABS) | 1 472 437 | 1 060 761 | ABS (2020a) | |
| Breeders | 1 077 935 | |||
| Replacement heifers (all) | 193 228 | |||
| Sale heifers | 201 273 | |||
| All other meat cattle (number) (p) (ABS) | 358 279 | 400 174 | ABS (2020a) | |
| Bulls (including culls) | 35 956 | |||
| Replacement bulls (1–2 years) | 8832 | |||
| Steers | 313 490 | |||
| Total | 2 646 558 | 1 946 832 | ABS (2020a) | |
| Natural increase | ||||
| Weaning rate (%) | 72 | 72 | ABARES (2020) | |
| Calves | 777 009 | 485 897 | ||
| Total weaned | 777 009 | 485 897 | ABS (2020a) | |
| Turn off | ||||
| Feedlot slaughter | 123 004 | 123 004 | ALFA (2020) | |
| Grass slaughter | 255 982 | 255 982 | ABS (2022b) | |
| Inter-state transfers | 59 357 | 59 357 | DPIRD (2022), K Pritchett pers. comm. | |
| Live export | 284 620 | 284 620 | DAWE (2022) | |
| Total turn off | 722 964 | 722 964 | ||
| Mortality rate (%) | 4 | ABARES (2020) | ||
| Losses on farm | 53 545 | |||
| Closing number of cattle | 2 647 059 | 1 893 210 | ABS (2020a) | |
| Scenario | Baseline | S1 | S2 | S3 | S4 | |||||||||||
|---|---|---|---|---|---|---|---|---|---|---|---|---|---|---|---|---|
| Region | Agricultural | Kimberley | Arid | Agricultural | Kimberley | Arid | Agricultural | Kimberley | Arid | Agricultural | Kimberley | Arid | Agricultural | Kimberley | Arid | |
| Mean cow weight (kg LW) | 581 | 371 | 436 | 581 | 369 | 437 | 581 | 369 | 437 | 581 | 369 | 437 | 581 | 369 | 437 | |
| Weaning rate (%) | 88 | 61 | 68 | 88 | 61 | 68 | 92 | 61 | 68 | 88 | 70 | 72 | 88 | 70 | 72 | |
| Mortality rate (%) | 1 | 4 | 5 | 1 | 4 | 5 | 1 | 4 | 5 | 1 | 4 | 5 | 1 | 4 | 5 | |
| Heifer final weight (kg) | 458 | 330 | 354 | 458 | 343 | 389 | 480 | 343 | 389 | 458 | 343 | 389 | 458 | 395 | 427 | |
| Steer final weight (kg) | 512 | 341 | 377 | 512 | 342 | 393 | 539 | 342 | 393 | 512 | 342 | 393 | 512 | 367 | 411 | |
| Mean final weight (kg) | 494 | 338 | 370 | 494 | 343 | 392 | 519 | 343 | 392 | 494 | 343 | 392 | 494 | 377 | 417 | |
| Heifer lifetime ADG (kg/day) | 0.9 | 0.4 | 0.5 | 0.9 | 0.5 | 0.5 | 0.9 | 0.5 | 0.5 | 0.9 | 0.6 | 0.6 | 0.9 | 0.5 | 0.6 | |
| Steer lifetime ADG (kg/day | 1.0 | 0.5 | 0.5 | 1.0 | 0.5 | 0.6 | 1.1 | 0.5 | 0.6 | 1.0 | 0.6 | 0.6 | 1.0 | 0.5 | 0.6 | |
| Mean Lifetime ADG (kg/day) | 1.0 | 0.5 | 0.5 | 1.0 | 0.5 | 0.6 | 1.0 | 0.5 | 0.6 | 1.0 | 0.6 | 0.6 | 1.0 | 0.5 | 0.6 | |
| Heifers sold out of total young cattle turnoff (%) | 33 | 34 | 32 | 33 | 35 | 34 | 33 | 35 | 34 | 33 | 35 | 34 | 33 | 37 | 36 | |
| Steers sold out of total young cattle turnoff (%) | 67 | 66 | 68 | 67 | 65 | 66 | 67 | 65 | 66 | 67 | 65 | 66 | 67 | 63 | 64 | |
| Total liveweight sold (t) | 153 749 | 75 736 | 79 302 | 153 749 | 76 909 | 92 064 | 159 550 | 76 909 | 92 064 | 153 749 | 76 909 | 92 064 | 153 749 | 82 892 | 96 573 | |
| Grass-fed cattle sold of total turnoff (%) | 55 | 100 | 89 | 55 | 96 | 74 | 57 | 96 | 74 | 55 | 96 | 74 | 55 | 73 | 60 | |
| Grain-finished cattle sold of total turnoff (%) | 45 | 0 | 11 | 45 | 4 | 26 | 43 | 4 | 26 | 45 | 4 | 26 | 45 | 27 | 40 | |
| CF (kg CO2-e/kg LW) (excl. LU and LUC) | 11.8 | 19.2 | 18.3 | 11.7 | 18.9 | 17.2 | 11.2 | 18.9 | 17.2 | 11.7 | 16.7 | 16.2 | 11.7 | 16.0 | 15.8 | |
| Carbon dioxide (%) | 10 | 2 | 5 | 10 | 2 | 5 | 10 | 2 | 5 | 10 | 3 | 6 | 10 | 3 | 6 | |
| Nitrous oxide (%) | 10 | 9 | 8 | 10 | 9 | 8 | 10 | 9 | 8 | 10 | 9 | 8 | 10 | 9 | 8 | |
| Methane (%) | 79 | 88 | 87 | 80 | 88 | 87 | 80 | 88 | 87 | 80 | 88 | 86 | 80 | 88 | 86 | |
| Absolute reduction from baseline scenario for WA beef (%) | 6 | 5 | −6 | −3 | ||||||||||||
| Total emissions for WA beef (excl. LU and LUC) (Mt CO2-e) | 4.7 | 4.8 | 4.8 | 4.6 | 4.7 | |||||||||||
| LU and LUC emissions for WA beef (Mt CO2-e) | −2.7 | −2.7 | −2.7 | −2.7 | −2.7 | |||||||||||
| Net emissions for WA beef (Mt CO2-e) | 2.1 | 2.2 | 2.2 | 1.9 | 2.0 | |||||||||||
| State CF WA beef (kg CO2-e/kg LW) (excl. LU and LUC) | 15.3 | 15.0 | 14.7 | 14.2 | 14.0 | |||||||||||
| LU and LUC CF for WA beef (kg CO2-e/kg LW) | −8.6 | −8.2 | −8.1 | −8.2 | −8.0 | |||||||||||
Baseline, current reported values; S1, business as usual, with an increase in herd size; S2, productivity improvements in the Agricultural region; S3, supplementary feeding of first-drop calves destined for live export from northern production systems to reach live-export weight (kg) at <2 years of age; S4, supplementary feeding of second-drop calves (originally destined for live export) from northern production systems to reach feedlot entry weight (400 kg).
This study applied modified activity data associated with manure deposition into farm dams, which was not relevant in most of WA, where grazing relies on bore water, creeks or rivers, not dams. Even in southern regions, the deposition of manure in farm dams was considered to be very unlikely, because dams are either designed to collect subsurface lateral flow or rely on specially designed catchment areas that are not grazed. As a result, emissions were negligible from this source. This was contrasted with the NGGI method (Commonwealth of Australia 2022a) where the assumed flow factor of 5% of manure was assumed to enter farm dams. No reference was provided to support this assumption in the NGGI.
Impact assessment
The study assessed GHG emissions by using the Intergovernmental Panel on Climate Change (IPCC) Fifth Assessment Report (AR5) Global Warming Potential (GWP) for a 100-year time horizon of 28 for methane and 265 for nitrous oxide (IPCC 2013) as applied in the NGGI (Commonwealth of Australia 2022a). GHG emissions are reported as carbon dioxide equivalents (CO2-e). Modelling was conducted using SimaPro™ 9.3 (Pré-Consultants 2021). Impacts from LU and dLUC were estimated using data from the NGGI and reported separately following ISO 14067 (ISO 2018) recommendations.
Handling co-production
Farm services and purchased inputs associated with multiple enterprise systems (beef, sheep and cropping) were subdivided, and inputs associated with crop production and sheep were excluded following recommendations from ISO 14044 (ISO 2006) and as applied in previous studies (Wiedemann et al. 2016, 2019).
Emission reduction-scenario assumptions
Eight scenarios were used to evaluate GHG emissions reduction and mitigation via changes to herd management, the use of anti-methanogenic mitigation supplements, and changes to land management, resulting in the sequestration of carbon in soil and vegetation. These scenarios (described below) examined the extent to which herd-management practices could reduce the CF of beef produced in WA. Scenarios S1 through S5 were modelled separately and designed to be complementary and additive. Scenario S6 assessed the combination of herd-management strategies and mitigation technologies from Scenarios S1–S5. Additional measures to reach common emission reduction milestones of 50% (S7) and 100% (S8) were investigated. No timeline was applied for Scenarios S1–S6 because a combination of strategies was required to achieve net zero. Scenarios S7 and S8 were developed to 2030, in line with the carbon-neutral 2030 target of the red meat industry.
A ‘business as usual’ case was modelled to reflect the predicted expansion of the beef industry (RMAC 2019). This scenario reflected a 10% increase in domestic slaughter to meet increased demand, with a large portion of the increased number of slaughter cattle coming from the northern pastoral zones met by the construction of new feedlot facilities in the state to achieve slaughter weight. From this new ‘baseline’, the scenarios below were modelled.
This scenario assumed an increase in improved pastures and temperate legumes in the Agricultural region, resulting in a 10% heavier mean slaughter weight for the same age and an increased mean weaning rate of 4% (from 88% to 92%).
The prospect of developing wide-scale irrigation capacity in the state’s north has had growing interest from industry (Martin and Saavedra 2018). Previous analysis has shown that up to 160 000 ha of land in the Fitzroy catchment has the technical capacity to be developed for irrigation (CSIRO 2018). It was determined that 30 000 ha of irrigated Rhodes grass on the Fitzroy River and 18 000 ha of irrigated forage sorghum could be planted if supported by conserved water and pressurised irrigation systems, such as centre pivots. This scenario considered utilising irrigated forage crops or conserved feed grown under pivots to improve the growth rates of calves, from the Kimberley and Arid regions destined for live export, and to reduce their age at turnoff. The crop yields were estimated to be 18–20 t/ha.year, which was expected to deliver an improvement of 18% in ADG. Two distinct age groups of cattle in the export cohort were determined from estimated calving dates and restrictions to export intervals throughout the year. These were first-drop calves, branded in March–June, comprising 70% of weaned cattle, and second-drop calves, which are discussed in Scenario S4. In the baseline scenario, first-drop calves were sold at 18 or 30 months, with a group average of 24 months. This could be reduced to an average age of 18 months through supplementary feeding of irrigated or conserved feed grown under a pivot. Additionally, reproductive efficiency was estimated to improve from 61% to 70% weaning rate in the Kimberley, and from 58% to 72% weaning rate in the Arid region with improved nutrition and early weaning of first-lactation heifers, which show a considerable gap in performance compared with mature breeder cows in the Kimberley and Arid regions (Stockdale et al. 2012).
A similar scenario analysed the effect of diverting second-drop calves originally destined for live export to a southern feedlot to be grown out for domestic slaughter. This required 30% of weaned cattle each year to be supplementary-fed conserved and irrigated feed in the dry season, where feed quality and availability constrain growth and reproductive capacity. These cattle were modelled to reach feedlot entry weight (400 kg) at 20 months of age and were then fed a 100-day domestic feedlot ration and slaughtered at 550 kg. The reproductive efficiency from Scenario S3 was applied.
Enteric-methane mitigation from anti-methanogenic feed supplements was applied in this scenario. Anti-methanogenic supplements were assumed to be 3-nitroxypropanol (sold as Bovaer) and Asparagopsis. The mitigation and efficacy rates vary depending on diet, production system and feed delivery mechanisms. Key challenges exist in the delivery of feed supplements in grazing systems, especially in northern-extensive production systems (Mayberry et al. 2019). Conservative enteric-methane mitigation rates were determined to be 70% for feedlots and 24% for grazing on the basis of a review of technical mitigation rates and adoption reported in the literature (Alemu et al. 2021). These limits represented the culmination of reasonable uptake and practical efficacy.
The scenarios were complementary and largely additive. The combination of these scenarios was modelled as one production system (Table 3). It was assumed that 70% of cattle destined for live export reached the required weight at 24 months of age, and the remaining 30% were grown to feedlot entry weight as described in Scenarios S3 and S4. The enteric-methane mitigation via supplementation was applied to the whole herd.
| Scenario | S5 | S6 | S7 | S8 | |||||||||
|---|---|---|---|---|---|---|---|---|---|---|---|---|---|
| Region | Agricultural | Kimberley | Arid | Agricultural | Kimberley | Arid | Agricultural | Kimberley | Arid | Agricultural | Kimberley | Arid | |
| Mean cow weight (kg LW) | 581 | 369 | 437 | 581 | 369 | 437 | 581 | 369 | 437 | 581 | 369 | 437 | |
| Weaning rate (%) | 88 | 61 | 68 | 92 | 70 | 72 | 92 | 70 | 72 | 92 | 70 | 72 | |
| Mortality rate (%) | 1 | 4 | 5 | 1 | 4 | 5 | 1 | 4 | 5 | 1 | 4 | 5 | |
| Mean final weight (kg) | 494 | 343 | 392 | 519 | 382 | 428 | 519 | 382 | 428 | 519 | 382 | 428 | |
| Mean lifetime ADG (kg/day) | 1.0 | 0.5 | 0.6 | 1.0 | 0.6 | 0.7 | 1.0 | 0.6 | 0.7 | 1.0 | 0.6 | 0.7 | |
| Heifers sold of total young cattle turnoff (%) | 33 | 35 | 34 | 33 | 39 | 37 | 33 | 39 | 37 | 33 | 39 | 37 | |
| Steers sold of total young cattle turnoff (%) | 67 | 65 | 66 | 67 | 61 | 63 | 67 | 61 | 63 | 67 | 61 | 63 | |
| Total liveweight sold (t) | 153 749 | 76 909 | 92 064 | 159 550 | 85 315 | 107 919 | 159 550 | 85 315 | 107 919 | 159 550 | 85 315 | 107 919 | |
| Grass-fed cattle sold of total turnoff (%) | 55 | 96 | 74 | 57 | 70 | 52 | 57 | 70 | 52 | 57 | 70 | 52 | |
| Grain-finished cattle sold of total turnoff (%) | 45 | 4 | 26 | 43 | 30 | 48 | 43 | 30 | 48 | 43 | 30 | 48 | |
| Carbon footprint (kg CO2-e/kg LW) (excl. LU and LUC) | 10.1 | 16.6 | 15.0 | 9.7 | 12.9 | 12.7 | 9.7 | 12.9 | 12.7 | 9.7 | 12.9 | 12.7 | |
| Carbon dioxide (%) | 12 | 3 | 6 | 12 | 3 | 6 | 12 | 3 | 6 | 12 | 3 | 6 | |
| Nitrous oxide (%) | 11 | 11 | 10 | 11 | 11 | 10 | 11 | 11 | 10 | 11 | 11 | 10 | |
| Methane (%) | 77 | 87 | 85 | 77 | 86 | 84 | 77 | 86 | 84 | 77 | 86 | 84 | |
| Absolute reduction from baseline scenario for WA beef (%) | −24 | −34 | −51 | −100 | |||||||||
| Total sequestration from mixed environmental plantings for WA beef (Mt CO2-e) | N/A | N/A | 0.30 | 0.53 | |||||||||
| Total sequestration from human-induced regeneration for WA beef (Mt CO2-e) | N/A | N/A | 0.00 | 0.78 | |||||||||
| Total sequestration from soil carbon for WA beef (Mt CO2-e) | N/A | N/A | 0.04 | 0.04 | |||||||||
| Total emissions for WA beef (excl. LU and LUC) (Mt CO2-e) | 4.2 | 4.0 | 4.0 | 4.0 | |||||||||
| LU and LUC emissions for WA beef (Mt CO2-e) | −2.7 | −2.7 | −2.7 | −2.7 | |||||||||
| Net emissions for WA beef (Mt CO2-e) | 1.6 | 1.4 | 1.0 | 0.0 | |||||||||
| State CF WA beef (kg CO2-e/kg LW) (excl. LU and LUC) | 13.1 | 11.4 | 11.4 | 11.4 | |||||||||
| LU and LUC CF for WA beef (kg CO2-e/kg LW) | −8.2 | −7.5 | −8.5 | −11.4 | |||||||||
S5, feed-supplement scenario (70% enteric-methane mitigation in feedlot and 14% enteric-methane mitigation in grass); S6, combination of herd-productivity changes and enteric-methane mitigation; S7, 50% emission reduction by using a combination of herd-productivity changes, enteric-methane mitigation and sequestration from soil and vegetation; S8, 100% emission reduction by using a combination of herd-productivity changes, enteric-methane mitigation and sequestration from soil and vegetation. N/A, not applicable.
The combination of herd management and mitigation technologies discussed in the previous scenarios was determined to be the practical limit of reduction and mitigation strategies. Therefore, removals via carbon sequestration in vegetation and soils is required to achieve a net 50% emission reduction. A sensitivity analysis was performed on the amount of land required to be managed for native regeneration in the state’s extensive pastoral zones, mixed environmental plantings (MEP) and improved management activities that would increase soil carbon in the Agricultural region. This scenario considered a practical limit of land that could be transformed with the adoption of these activities. The area required for MEP and improved management strategies to increase soil carbon in the Agricultural region was ~36 500 ha and ~205 500 ha, respectively for scenario S7. No additional native regeneration in the Kimberley and Arid regions were modelled. Conservative rates of soil carbon sequestration of 0.15 t CO2-e/ha.year were derived from a literature review and applied only to land where practice change was initiated, resulting in carbon sequestration in a portion of the total grazed area. The modelled sequestration rates for MEP in the Agricultural region and native regeneration in the Kimberley and the Arid regions were 8.2 t CO2-e/ha.year and 1.1 t CO2-e/ha.year, respectively. These carbon sequestration rates were modelled using Full Carbon Accounting Model (FullCAM) (Australian Government 2020) as (1) a planting or (2) regeneration of native vegetation. Default settings were used. The latitude and longitude were set to the nearest town listed above, and the results were averaged over a representative land parcel of 2500 ha in each location. For planting scenarios (1), the sites were modelled as initially clear of forest cover, then planted with a mixed environmental block planting or a tree species chosen to reflect the species choice of regional forestry operations. For the regeneration of native vegetation (2), results were modelled for 50 years, and the appropriate calibration (either >500 or <500 mm) was chosen for each location on the basis of its average annual rainfall. Sequestration was calculated from the mass of carbon accumulated in tree biomass and coarse woody debris and converted to mass of CO2-e.
This scenario applied the assumptions in Scenario S7 but required greater areas of native regeneration (711 000 ha), MEP (~65 000 ha) and improved management activities (~289 000 ha) that increase soil carbon sequestration to reach net zero.
To put the results in context, Scenarios S7 and S8 were analysed against a 2030 timeline. This was not a primary aim of the study, but it was included to indicate what would be required for the WA beef industry to achieve industry target of being carbon neutral by 2030, adopted by the Red Meat Advisory Council (RMAC). Sigmoid adoption curves were used to model herd-management and mitigation-technology implementation. These had differing inflection points to simulate the capital and technological barriers faced by each scenario. For instance, subject to regulatory changes, the construction and use of irrigation systems in northern production systems could be implemented to improve productivity in the live-export industry in a short period. In contrast, the adoption of enteric-methane mitigation technologies may face technological and capital barriers that delay significant uptake. These adoption curves were combined with linear increases in the area managed for sequestration of soil and vegetation.
Data limitations
The study relied on data from several different datasets to construct a spatially defined herd model. Some activity data, methods and emission factors used in the NGGI may currently under- or overestimate emissions from some sources. The Moe and Tyrrell (1979) method, used in the NGGI for calculating enteric methane in feedlot cattle, does not account for dietary oil, which is commonly fed and is known to reduce enteric methane (Cottle et al. 2011). Alternative methods for predicting feedlot enteric methane (Gavrilova et al. 2019) result in lower emissions than those predicted using Moe and Tyrrell (1979) and are expected to be more similar to Australian feedlot cattle performance, resulting in an overestimation of feedlot emissions in the present study.
Data used to estimate weights and ages of cattle were determined from datasets of approximately 250 000 head of cattle slaughtered (confidential data). However, no similar dataset could be found for live-export cattle. Total weights for cattle transferred across the state’s eastern border were unavailable. These were estimated from consultation with the DPIRD and industry experts, introducing a small risk of error in live-export production data. Given that weight and liveweight gain (LWG) drive feed intake and thus livestock emissions, establishing a state dataset for slaughter and live-export cattle with weight and age indicators (e.g. dentition) would be highly valuable.
ABS slaughter data are differentiated by sex, but class (i.e. the number of steers and heifers slaughtered, as opposed to cows and bulls) was not specified. Without this breakdown, the study used the herd model to predict ratios of young cattle and adult (cull) sales. No granular geospatial datasets were available to provide a high-resolution analysis to attribute LU and dLUC impacts to grazing cattle, and estimates were required in each agroecological zone, based on local knowledge and conservative assumptions. Considering the uncertainty, these results should be treated with a degree of caution and further research is needed to confirm the attributions applied.
Results
Herd productivity
In the present study, herd productivity parameters were highly regionalised, with differences being heavily influenced by region of birth and the end-point destination (meat processing in WA, live-export of eastern-state transfers, and live export across international borders). Cattle from the Agricultural region had heavier slaughter and export weights, faster growth rates and younger age at slaughter and export than cattle from the Kimberley and the Arid regions (Table 2). The mean ages of slaughter for steers and heifers, of 20 and 21 months respectively, were 13% younger than the mean age of cattle at load ports for live-export and eastern-state transfers, despite being 45% heavier.
Herd size and structure
The modelled, self-replacing WA cattle herd was 36% larger than the ABS survey data for the average of FY 2018 and FY 2019 (Table 1). The major discrepancy between the herd inventories was the reported number of ‘calves less than 1 year,’ which was 36% too low to produce the total head numbers required for slaughter, live export, transfers to eastern states and change in inventory. Consequently, the herd was modelled to achieve the required turnoff, and cow numbers were adjusted on the basis of reported weaning rates from ABARES. Inventory data on ABS head numbers, livestock slaughtered (ABS 2020b) and live exported (DAWE 2022) were collated and analysed for the previous 12 years, and it was found that the same mismatch between the datasets had occurred.
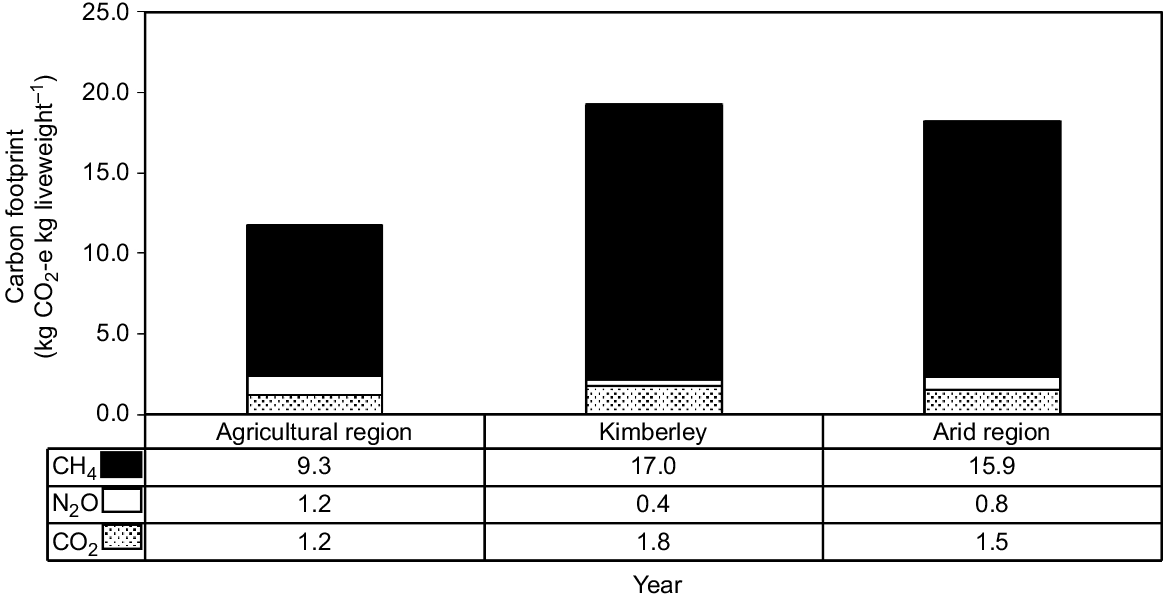
Baseline emissions
The mean GHG CF (excluding LU and dLUC) for cattle production in WA was 15.3 kg CO2-e/kg LW. The Agricultural region had a 36–39% lower CF than did the Arid region and the Kimberley (Fig. 2). The GHG emission profile (excluding LU and dLUC) was dominated by enteric methane (79–87%), followed by nitrous oxide (8–10%) and carbon dioxide (2–10%). Most enteric-methane emissions occurred during the breeding and backgrounding stages, with feedlot cattle contributing 2% of enteric methane to the emission profile. The contribution of carbon dioxide was greater in the Agricultural region, reflecting a more intensive production system. Removals were −8.5 kg CO2-e/kg LW for the state average, but could not be reported at a regional scale because of a lack of resolution in the underlying datasets.
Carbon footprint (kg CO2-e per kg of LW sold, excluding LU and dLUC) across the WA regions; Agricultural region, Kimberley and the Arid regions.
Greenhouse-gas emissions from the WA beef herd were estimated to be 4.7 Mt CO2-e (AR5) (excluding LU and dLUC) for the average of FY 2018 and FY 2019. Modelled enteric-methane and manure emissions were 26% greater than those of the NGGI for 2018 and 2019. Total GHG emissions from LU and dLUC attributed to cattle production in WA were estimated to be −2.7 Mt CO2-e, producing a net emission profile of 2.0 Mt CO2–e.
Several studies have shown that the Moe and Tyrrell (1979) equation predicts higher emissions than Australian feedlot conditions (Beauchemin and McGinn 2005; McGinn et al. 2008; Bai et al. 2015). Since this time, further research has been conducted specifically to understand methane emissions from Australian feedlot cattle fed modern, commercial diets, by using respiration chambers. This has resulted in a more complete understanding of enteric-methane emission levels from Australian feedlot cattle and is currently being used to work on a revision to the inventory methods. To address this limitation to the analysis, we applied a sensitivity analysis by using the Gavrilova et al. (2019) methane conversion factor of 13.6 g CH4/kg DMI. This reduced enteric-methane emissions from feedlot cattle by 73%, but overall had an impact of <1% on the mean GHG CF for cattle production in WA.
Emission reduction scenarios
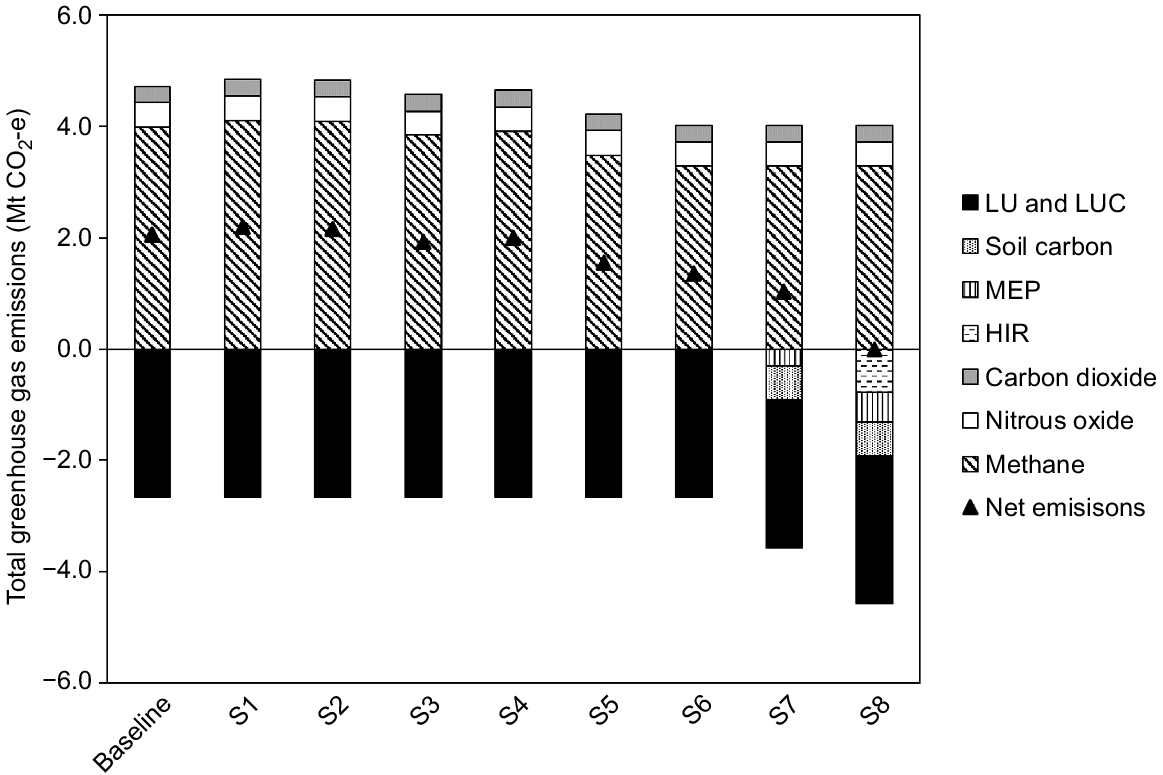
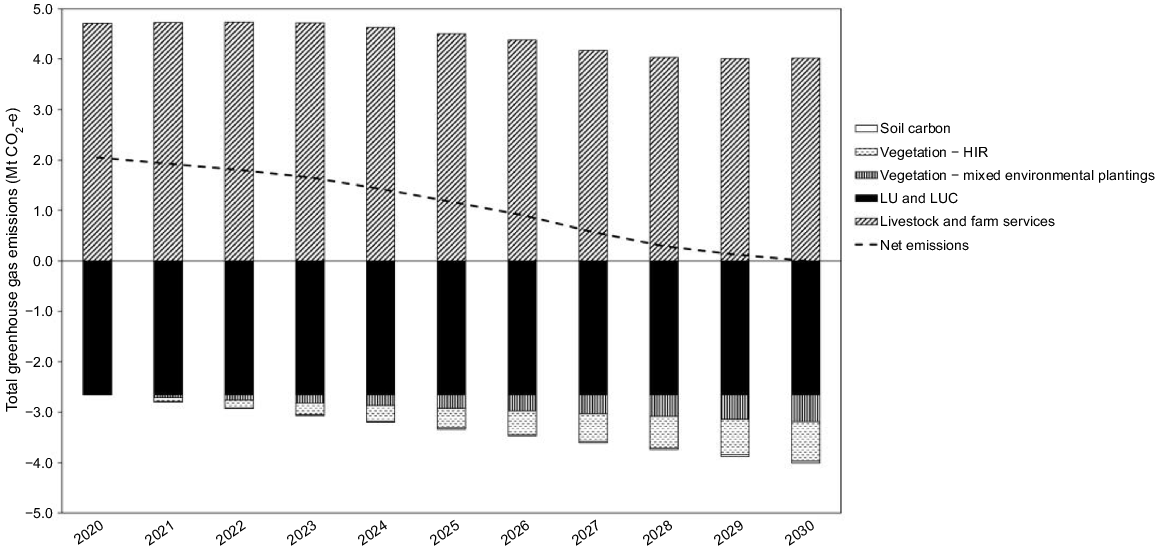
The results of the emission reduction scenarios are shown in Tables 2 and 3 and Fig. 3. Productivity improvements in the Agricultural region resulted in a 4% reduction in the state CF (S2). Implementing supplementary feeding in northern and central pastoral systems to reduce the age of live-export cattle (S3) and divert northern cattle into feedlot supply chains (S4) reduced the state CF by 7% and 8% respectively. Enteric-methane mitigation technologies reduced CF by 14%. The combination of herd-management changes and anti-methanogenic supplements resulted in a 25% reduction in CF.
Emission reduction scenarios for the WA beef industry. Baseline, current reported values; S1, business as usual with an increase in herd size; S2, productivity improvements in the Agricultural region; S3, supplementary feeding of first-drop calves destined for live export from northern production systems to reach live-export weight (kg) at <2 years of age; S4, supplementary feeding of second-drop calves (originally destined for live export) from northern production systems to reach feedlot entry weight (400 kg); S5, feed supplement scenario (70% enteric-methane mitigation in feedlot and 14% enteric-methane mitigation in grass); S6, combination of herd-productivity changes and enteric-methane mitigation; S7, 50% emission reduction by using a combination of herd-productivity changes, enteric-methane mitigation and sequestration from soil and vegetation; S8, 100% emission reduction by using a combination of herd-productivity changes, enteric-methane mitigation and sequestration from soil and vegetation.
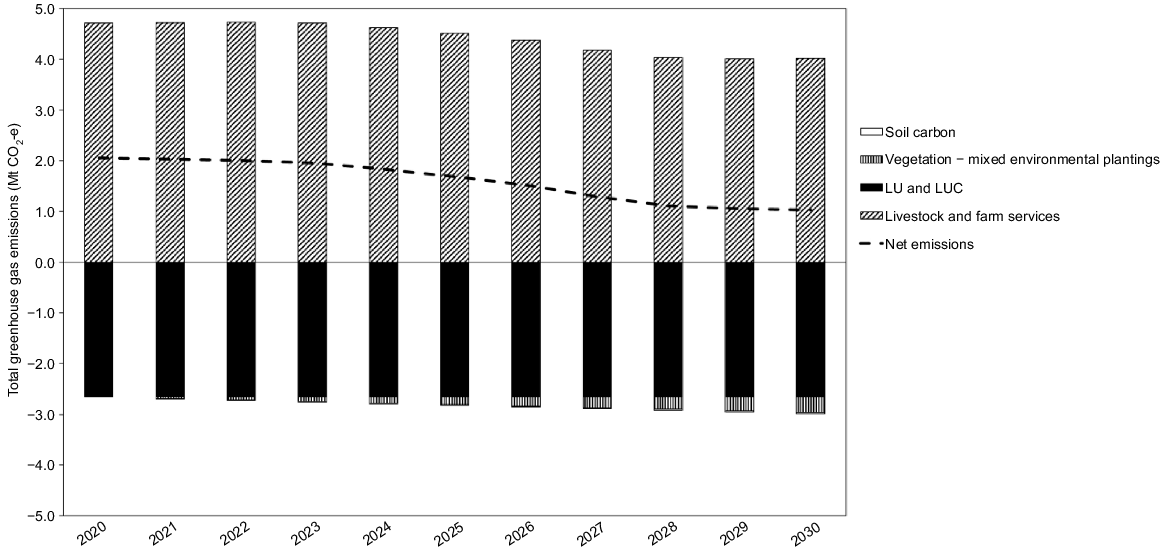
A 50% emission reduction required ~36 500 ha of land in the Agricultural region to be managed for MEP and ~205 500 ha of improved management activities to increase soil carbon sequestration. This study found that a 100% emission reduction pathway could be achieved if ~65 000 ha of land in the Agricultural region were managed for MEP, ~289 000 ha used improved management strategies that increase soil carbon sequestration in the Agricultural region and 711 000 ha of land were managed for native regeneration in extensive pastoral zones. Further research is required to determine whether sequestration is possible across these areas at the sequestration rate defined. Restrictions may also exist because of pastoral lease conditions. If less land or lower sequestration rates are achievable in practice than estimated here, breakthroughs in the efficacy and delivery of anti-methanogenic supplements will be required, together with more substantial improvements in herd management to achieve these goals. The 50% and 100% emission reduction pathways to 2030 are shown in Figs 4 and 5.
Discussion
The CF for the WA beef herd was 17% higher than the national average of 13.1 kg CO2-e/kg (Wiedemann et al. 2023), noting that the latter studied slaughter cattle only, and inclusion of live-export cattle in the WA analysis, that had not reached slaughter weight, had the effect of increasing the CF.
Differences among production systems
Most domestic slaughter cattle in WA were from the Agricultural region, which had a 10% lower CF (11.8 kg CO2-e/kg LW) than the national average (13.1 kg CO2-e/kg LW) (Wiedemann et al. 2023). The range in CF across the state was largely explained by differences between the southern and northern cattle production systems. The southern production system is characterised by high-quality forage pastures, which enable improved reproductive performance and higher growth rates than for cattle in central and northern pastoral systems (DPIRD 2022). Productivity improvements reduced the age of cattle from breeding and backgrounding into pasture or feedlot finishing, where they were slaughtered for domestic or international consumption. In the Agricultural region, live-export cattle or interstate transfers represent a small proportion of the herd for alternative market options when prices may be more favourable. The improved LWG and weight for age at slaughter of cattle from the Agricultural region were partly driven by a more intensified production system (ABARES 2020). These productivity improvements compensated for the increase in carbon dioxide from intensification.
The central and northern pastoral systems were characterised by extensive and low-input management practises, with over 80% of cattle being transported interstate or internationally via live export. The live-export market is heavily restricted by climate, particularly in the state’s north. Cattle can be transported to ports or via land only outside the most severe periods during the wet season (from November/December to March/April). Limitations to forage quantity and quality during feed gaps can reduce growth rates and cause weight loss in some regions (Stockdale et al. 2012). Consultation with industry experts indicated that cattle sold via live export reached an average weight of 313 kg at approximately 24 months. Most live-export cattle were from the Kimberley, followed by the Arid region, which is partly influenced by transport limitation (Stockdale et al. 2012). The limitations of live transport via overseas borders and the 350 kg weight limit to live-export cattle to countries such as Indonesia (Payne and Whitaker 2016) resulted in higher CFs than for domestic slaughter production systems from the same regions. Feedlot-finishing inventory data for Indonesia (Eady 2011) were applied to determine the impact of these live-export cattle at slaughter weight. This resulted in a 14–10% reduction in the CF for the Kimberley and Arid regions. Nonetheless, these impacts remained significantly higher than in southern regions. Improved reproductive performance and higher growth rates would reduce the CF and may also increase the profitability of the northern beef industry (Stockdale et al. 2012). Further information on strategies to increase productivity in Australian rangelands has been discussed in the literature (Purvis 1986; Bell et al. 2014; Hunt et al. 2014; Ash et al. 2015; Holmes 2015; Walsh and Cowley 2016; Greenwood et al. 2018; Friedel and Morton 2022).
In the Kimberley and Arid regions, emissions from carbon dioxide contributed 2% and 5% respectively, to the emission profile, being reflective of a less intensive production system with fewer inputs. While there is an opportunity to intensify production to reduce the CF, currently, various environmental, geographical, and regulatory barriers exist that restrict the implementation of more intensified production systems in the WA central and northern pastoral systems. For example, pastoral leases restrict the development of irrigation. If regulatory change were implemented, herd-performance and CF improvements might be achieved. Additionally, distinct wet and dry seasons restrict access to large areas of properties on flood plains, hindering management or the introduction of improved pastures. The isolation of the central and northern beef production systems from the state’s southern feedlot-finishing and domestic slaughter facilities means that the transfer of cattle via live export offers more practical/attractive market opportunities (Eady 2011; Stockdale et al. 2012). The high efficiency of the feedlot stage was a key factor that reduced the CF of beef supply chains in the eastern states (Wiedemann et al. 2019). Construction of feedlot finishing facilities and abattoirs closer to the central and northern pastoral regions would allow producers to engage in markets that do not have the specification constraints of the live-export trade, thus decreasing the CF of those cattle by an estimated 7% (S4). Increased lot feeding of domestic cattle would enable greater uptake of methane mitigation technologies, such as Asparagopsis and Bovaer, thus further reducing emissions (de Almeida et al. 2021).
Western Australia was affected by longer-term rainfall deficiencies during this period (FY 2018 and FY 2019) (Bureau of Meteorology 2023). The Agricultural region was more affected than the Kimberley and Pilbara during this time. Drought years can reduce producitivity of the herd through increased mortalities, lower birth rates and lower ADG and farms often operate a more intensive system with supplementary feeding to reduce this risk (Hughes et al. 2019). For this reason, the results presented in this study may appear higher than an average year. The GHG mitigation scenarios also provide insight into the effect of producitivity improvements and performance that is reflective of a standard year.
Herd-inventory discrepancies
The present study provided a state-level case study, and showed major discrepancies between the number of cattle required to produce the reported herd turnoff and ABS farm survey data (ABS 2020a). This analysis supports two previous studies that identified similar discrepancies in the national statistics (Wiedemann et al. 2019; Fordyce et al. 2021). Total cattle numbers are a major driver of emission estimations used in the NGGI and need to be improved to accurately understand the industry emission profile.
Wiedemann et al. (2019) found that the ABS Agricultural Commodities Survey currently underestimates the national beef cattle herd by an estimated 10–32%. They found a major discrepancy between long-term reported calves <1 year reported by ABS and the total animals for slaughter or live export estimated by Wiedemann et al. (2019). A long-term analysis by these authors indicated that ABS farm surveys underestimated the category ‘calves <1 year’ by 59–70% compared with long-term herd output. A separate study (Fordyce et al. 2021) has also shown significant underestimations of the ABS-reported cattle numbers, concluding that in the period from 1975 to 2020, the beef cattle herd was, on average, 56% higher than that reported by ABS and 75% higher than that reported by ABARES.
The extent of the underestimation for the WA beef cattle population means that emissions are also underestimated in the NGGI by approximately 1.5 Mt CO2-e. The implication of this finding is that state reporting of herd performance and GHG emissions requires a new method to determine herd numbers. This could be achieved via new data-reporting structures and require additional data surveys to address gaps, particularly in the Arid and northern regions.
GHG mitigation scenarios
The herd-management scenarios were constructed such that the environmental, geographical, and regulatory limitations addressed above were considered. Individually, none of the investigated herd-management strategies and methane mitigation technologies achieved more than a 15% emission reduction at full adoption. Therefore, a combination of these strategies must be used to achieve meaningful emission reductions.
Of the herd-management practices investigated, improvements in productivity and reproduction in the Agricultural region offer the lowest barriers to adoption and implementation. However, the breeding and productivity performance were already high for cattle in the Agricultural region, and this will not extend indefinitely. Strategies to mitigate enteric-methane emissions from livestock have been comprehensively discussed in the literature (Beauchemin et al. 2022; Almeida et al. 2023; FAO 2023) and include, but are not limited to, nutritional management of breeding animals, improving quality of available forage, genetic improvements and the introduction of enteric-methane supressing forages and pastures and enteric-methane supressing feed supplements.
As discussed, significant regulatory and physical barriers exist that limit improvements in breeding performance and productivity of cattle in the Kimberley and Arid regions. If these were overcome, this was estimated to decrease CF by 8–10%. Several studies have explored improvements in productivity in the northern Australian beef herd (Thomson 1999; Bentley et al. 2008; Materne et al. 2017; RNRM 2017; Materne 2019) and keys strategies include managing total grazing pressure, matching stocking rate to carrying capacity, spelling pastures to maintain ground cover, weaning calves, culling unproductive females, introduction of infrastructure to manage grazing pressure, water points and mustering efficiency. Bentley et al. (2008) found that improvements to extensive breeding operations in a Northern Territory/Queensland supply chain reduced methane emissions by 30%. This was affected by productivity improvements, including an increase in weaning rates from 55% to 80% over 25 years. The two northern herd-productivity scenarios (S3 and S4) in this study assumed improvements in weaning rates much smaller than this (Table 2). If the productivity improvements that have occurred over time in the Northern Territory and Queensland supply chains could be replicated in the WA beef-supply chain and extended beyond the 2030 timeline in the present study, this may result in decreased emissions to levels comparable to national averages (Wiedemann et al. 2019). The State Government would need to implement policies that ease regulatory restrictions on infrastructure, such as water conservation and pressurised irrigation, for cattle properties operating on pastoral lease land, for this to be achieved. Furthermore, pastures such as Leucaena offer potential to improve productivity and directly reduce methane emissions (Harrison et al. 2015). This could be readily adapted if trials of sterile varieties prove successful.
Residual emissions would need to be balanced with the sequestration of carbon in soil and vegetation (S7 and S8). Currently, methods crediting the abatement from management of MEP and native regeneration are costly and complex, making it unviable for many smaller agricultural businesses. Strategies to incentivise smaller land-holders to take part in offset practices would contribute a small but important part towards net emission reductions. Northern production systems generally operate on large properties, with sections of marginal grazing land that could investigate opportunities for native regeneration projects. In comparison, MEP would be suited to productive land in the state’s south. However, eligibility and sequestration potential are not well understood at present (Roxburgh et al. 2020). The same factors causing low productivity in the state’s central and northern pastoral zones will also reduce vegetation growth and, subsequently, carbon sequestration rates. Identifying whether suitable areas exist to sequester carbon through managed native regeneration in the state’s pastoral zones is essential to developing emission reduction strategies. Any such analysis must consider how cattle and vegetation could be co-managed to maintain production. If these opportunities are limited, increased research into in-field mitigation technologies will be required to achieve net emission reduction targets in the foreseeable future.
The higher emissions that this study found, than the currently reported values (Commonwealth of Australia 2022b), indicate that pathways to carbon neutrality for the WA beef industry would require additional offsets and abatement. The projected emission reduction pathways to 50% and 100% carbon neutrality by 2030 give an indication of the rate of implementation of herd-management practises, adoption of methane mitigation strategies, and scale of managed MEP, native regeneration, and improved management activities that would increase soil carbon sequestration.
Sigmoid adoption rates of herd-management practices and methane mitigation technologies meant that emission reductions reached a plateau in the projection 2030 in the 50% emission reduction scenario. Without the continued implementation of additional strategies in herd management and methane mitigation technologies, herd emissions may increase with the rising production of beef beyond 2030. This also provides further justification for the need for sequestration in vegetation and soil to balance residual emissions. Continued emission reductions in herds may be achieved if the in-field efficacy of methane mitigation technologies were greater than the assumptions in this study, and research is underway to investigate options to achieve this.
Achieving a significant reduction in emissions towards carbon neutrality and net-zero emissions would require industry transformation. The adoption rates required to achieve this by 2030 are not plausible, when compared with the current understanding of adoption rates for technologies in Australian agriculture (Kuehne et al. 2017; Hansen et al. 2023). This raises an important challenge for industry. At the time of publishing, 2030 is 6 years away. With emission levels being found to be higher in this study in the baseline, and abatement more difficult to achieve, we conclude that the 2030 timeline is not achievable. This study did not examine specific timelines and adoption rates, but this work is urgently needed if industry, Governments and other stakeholders are going to provide pathways that can be followed in practice. Further to this, studies have modelled methane’s contribution to global warming (Reisinger 2018; Reisinger and Clark 2018; Rogelj et al. 2018; Cain et al. 2021; Reisinger et al. 2021) and there is consensus that no additional warming can be met by identifying a non-zero methane emission reduction target (Smith et al. 2012).
This is important to remain competitive compared with other edible proteins, to increase and maintain market access for exports and to meet changing consumer and Government expectations locally and overseas. Industry transformation will need to be underpinned by Government, industry and private sector support, together with markets that reward premium environmental performance. Incremental reduction in the CF of beef through improved efficiency may be implemented cost-effectively, and, across the nation, and has resulted in steady reductions in the CF of beef of approximately 0.5% per annum over 40 years (Wiedemann et al. 2023). However, increased costs will exist to deliver substantially lower emissions or carbon neutrality, and funding this transition will require investment in technology, adoption and practice change through multiple funding avenues, including via branded product that achieves market premiums or access to higher-value markets that value improved environmental performance.
Conclusions
The present study is the first analysis of CF and net emissions in the WA beef industry. Herd inventory analysis showled that the WA herd was 36% larger than reported by ABS. Total emissions for the state were 29% higher than reported in the NGGI, primarily driven by WA having a larger herd than reported by ABS. This indicates the need for an updated state inventory using new data sources. A detailed understanding of the role of removals in reducing net emissions in this study was limited by the lack of datasets that clearly co-link livestock production regions with vegetation management. Considering the important role of removals into the future, this is an area requiring further work to improve data sources.
Scenario modelling showed that substantial improvements could be made in region-specific CF, reducing the state average of 15.3–11.4 kg CO2-e (excluding LU and dLUC) through a combination of herd-management strategies and methane mitigation technologies, with improvements in the productivity of the northern herd causing large reductions to CF. Achieving industry-wide net emission reduction requires significant vegetation and soil to achieve the transition to carbon neutrality. Considering the higher baseline emissions, short-term goals such as carbon neutrality by 2030 were not considered achievable, because of the required adoption rate of new technologies and very substantial changes in land management required in the next 2–3 years to achieve the required net reductions. Further examination of actionable adoption of technology and new management practices to achieve net emission reduction, combined with consideration of potentially lower rates of emission reductions for methane to achieve a ‘no additional warming’ position, is needed. Regardless of the specific timeline, significant investment in technology and adoption will be required to underpin industry transformation, supported by Government, industry and new market initiatives to support low-carbon and carbon-neutral beef.
Data availability
Data from ABARES and ABS is publicly available. Some data informing weights of slaughter and export cattle are confidential and are not available.
Declaration of funding
The study was funded by the Western Australian Department of Primary Industries and Regional Development.
Acknowledgements
The authors acknowledge Mandy Curnow and Kate Pritchett for their assistance in all aspects of this project, from facilitating consultation with industry experts to providing data vital to the analysis of the WA beef herd. The authors extend their thanks to the members of consultation panels, who provided valuable insight into the intricacies of the WA beef herd.
References
ABARES (2020) Farm data portal: farm survey data for beef, lamb and sheep industries: all beef industries combined. Australian Bureau of Agricultural and Resource Economics and Sciences, Australia. Available at https://www.awe.gov.au/abares/data/farm-data-portal
ABARES (2021) Farm survey data for beef, lamb and sheep industries. Australian Bureau of Agricultural and Resource Economics and Sciences, Australia. Available at http://apps.agriculture.gov.au/mla/
ABARES (2022) Farm surveys definitions and methods. Australian Bureau of Agricultural and Resource Economics and Sciences, Australia. Available at https://www.awe.gov.au/abares/research-topics/surveys/farm-definitions-methods#definitions-of-items
ABS (2021) Statistical area level 2. Available at https://www.abs.gov.au/statistics/standards/australian-statistical-geography-standard-asgs-edition-3/jul2021-jun2026/main-structure-and-greater-capital-city-statistical-areas/statistical-area-level-2
ABS (2022a) 7215.0 – livestock products, Australia. Australian Bureau of Statistics. Available at https://www.abs.gov.au/statistics/industry/agriculture/livestock-products-australia
ABS (2022b) 7215.0 – livestock products, Australia. Table 9. Red meat produced – beef: all series (tonnes). Australian Bureau of Statistics, Australia. Available at https://www.abs.gov.au/statistics/industry/agriculture/livestock-products-australia/latest-release#data-download
Alemu AW, Shreck AL, Booker CW, McGinn SM, Pekrul LKD, Kindermann M, Beauchemin KA (2021) Use of 3-nitrooxypropanol in a commercial feedlot to decrease enteric methane emissions from cattle fed a corn-based finishing diet. Journal of Animal Science 99, skaa394.
| Crossref | Google Scholar |
Almeida AK, Cowley FC, Hegarty RS (2023) A regional-scale assessment of nutritional-system strategies for abatement of enteric methane from grazing livestock. Animal Production Science 63, 1461-1472.
| Crossref | Google Scholar |
Ash A, Hunt L, McDonald C, Scanlan J, Bell L, Cowley R, Watson I, McIvor J, MacLeod N (2015) Boosting the productivity and profitability of northern Australian beef enterprises: exploring innovation options using simulation modelling and systems analysis. Agricultural Systems 139, 50-65.
| Crossref | Google Scholar |
Australian Government (2020) Full carbon accounting model (FullCAM). 2020 public release. Version 6.20.03.0827. Available at https://www.industry.gov.au/data-and-publications/full-carbon-accounting-model-fullcam
Bai M, Flesch TK, McGinn SM, Chen D (2015) A snapshot of greenhouse gas emissions from a cattle feedlot. Journal of Environmental Quality 44, 1974-1978.
| Crossref | Google Scholar | PubMed |
Beauchemin KA, McGinn SM (2005) Methane emissions from feedlot cattle fed barley or corn diets. Journal of Animal Science 83, 653-661.
| Crossref | Google Scholar | PubMed |
Beauchemin KA, Ungerfeld EM, Abdalla AL, Alvarez C, Arndt C, Becquet P, Benchaar C, Berndt A, Mauricio RM, McAllister TA, Oyhantçabal W, Salami SA, Shalloo L, Sun Y, Tricarico J, Uwizeye A, De Camillis C, Bernoux M, Robinson T, Kebreab E (2022) Invited review: current enteric methane mitigation options. Journal of Dairy Science 105, 9297-9326.
| Crossref | Google Scholar | PubMed |
Bell LW, Hayes RC, Pembleton KG, Waters CM (2014) Opportunities and challenges in Australian grasslands: pathways to achieve future sustainability and productivity imperatives. Crop & Pasture Science 65, 489-507.
| Crossref | Google Scholar |
Bentley D, Hegarty RS, Alford AR (2008) Managing livestock enterprises in Australia’s extensive rangelands for greenhouse gas and environment outcomes: a pastoral company perspective. Australian Journal of Experimental Agriculture 48, 60-64.
| Crossref | Google Scholar |
Bureau of Meteorology (2023) Previous droughts. Available at http://www.bom.gov.au/climate/drought/knowledge-centre/previous-droughts.shtml
Cain M, Jenkins S, Allen MR, Lynch J, Frame DJ, Macey AH, Peters GP (2021) Methane and the Paris Agreement temperature goals. Philosophical Transactions of the Royal Society A: Mathematical, Physical and Engineering Sciences 380, 20200456.
| Crossref | Google Scholar |
Charmley E, Williams SRO, Moate PJ, Hegarty RS, Herd RM, Oddy VH, Reyenga P, Staunton KM, Anderson A, Hannah MC (2016) A universal equation to predict methane production of forage-fed cattle in Australia. Animal Production Science 56, 169-180.
| Crossref | Google Scholar |
Commonwealth of Australia (2022a) National inventory report 2020. Vol. 1. Available at https://www.dcceew.gov.au/climate-change/publications/national-inventory-report-2020
Commonwealth of Australia (2022b) National greenhouse gas inventory – Paris Aareement inventory. (Australian Greenhouse Emissions Information System) Available at https://ageis.climatechange.gov.au/
Cottle DJ, Nolan JV, Wiedemann SG (2011) Ruminant enteric methane mitigation: a review. Animal Production Science 51, 491-514.
| Crossref | Google Scholar |
CSIRO (2018) Water resource assessment for the Fitzroy catchment. (Commonwealth Scientific and Industrial Research Organisation: Australia) Available at &https://www.csiro.au/~/media/Major-initiatives/Northern-Australia/NAWRA-Summary-Reports/18-00186_LW_NAWRASummary24pp_Fitzroy_WEB_180709.pdf?la=en&hash=3F098B14F5DDD248D44B035FC0E785DBDF7F09E4
DAWE (2022) All livestock exports. (Department of Agriculture, Water and the Environment: Australia) Available at https://www.awe.gov.au/biosecurity-trade/export/controlled-goods/live-animals/live-animal-export-statistics/livestock-exports-by-market
Department of Primary Industries and Regional Development (2023) Sectoral Emissions Reduction Strategies (SERS) and the agricultural sector. Available at https://www.agric.wa.gov.au/climate-land-water/sectoral-emissions-reduction-strategies-sers-and-agricultural-sector
DPIRD (2022) The Western Australian beef industry. Available at https://www.agric.wa.gov.au/export-services/western-australian-beef-industry#:~:text=Western Australia (WA) has a,of bulls%2C steers and calves
FAO (2023) Methane emissions in livestock and rice systems – sources, quantification, mitigation and metrics. (FAO) Available at https://doi.org/10.4060/cc7607en
Fordyce G, Shephard R, Moravek T, McGowan MR (2021) Australian cattle herd: a new perspective on structure, performance and production. Animal Production Science 63, 410-421.
| Crossref | Google Scholar |
Friedel MH, Morton SR (2022) A history of CSIRO’S Central Australian Laboratory, 1: 1953-80: pastoral land research. Historical Records of Australian Science 34, 36-49.
| Crossref | Google Scholar |
Gavrilova O, Leip A, Dong O, MacDonald J, Alfredo C, Bravo G, Amon B, Rosales R, Prado A, Lima M, Oyhantcabal W, Weerden T, Widiawati Y (2019) Emissions from livestock and manure management. In ‘2019 refinement to the 2006 IPCC guidelines for national greenhouse gas inventories. Vol. 4. Agriculture, Forestry and Other Land Use’. (Eds E Calvo Buendia, K Tanabe, A Kranjc, J Baasansuren, M Fukuda, S Ngarize, A Osako, Y Pyroshenko, P Shermanau, S Federici) pp. 10.90–10.209. (Institute for Global Environmental Strategies: Japan)
Greenwood PL, Gardner GE, Ferguson DM (2018) Current situation and future prospects for the Australian beef industry – a review. Asian–Australasian Journal of Animal Sciences 31, 992-1006.
| Crossref | Google Scholar | PubMed |
Hansen BD, Leonard E, Mitchell MC, Easton J, Shariati N, Mortlock MY, Schaefer M, Lamb DW (2023) Current status of and future opportunities for digital agriculture in Australia. Crop & Pasture Science 74, 524-537.
| Crossref | Google Scholar |
Harrison MT, McSweeney C, Tomkins NW, Eckard RJ (2015) Improving greenhouse gas emissions intensities of subtropical and tropical beef farming systems using Leucaena leucocephala. Agricultural Systems 136, 138-146.
| Crossref | Google Scholar |
Holmes PR (2015) Rangeland pastoralism in northern Australia: change and sustainability. The Rangeland Journal 37, 609-616.
| Crossref | Google Scholar |
Hughes N, Galeano D, Hatfield-Dodds S (2019) ABARES insights: the effects of drought and climate variability on Australian farms. Available at https://www.agriculture.gov.au/abares/products/insights/effects-of-drought-and-climate-variability-on-Australian-farms
Hunt L, Ash A, McLeod N, McDonald C, Scanlan J, Bell L, Cowley R, Watson I, McIvor J (2014) Research opportunities for sustainable productivity improvement in the northern beef industry: a scoping study. (Meat & Livestock Australia: Sydney, NSW, Australia) Available at http://era.daf.qld.gov.au/id/eprint/6105/
IPCC (2013) AR5 climate change 2013: the physical science basis. (IPCC) Available at https://www.ipcc.ch
ISO (2022) Net zero guidelines. International Organization for Standardization (ISO), Geneva, Switzerland. Available at https://www.iso.org/netzero
Kuehne G, Llewellyn R, Pannell DJ, Wilkinson R, Dolling P, Ouzman J, Ewing M (2017) Predicting farmer uptake of new agricultural practices: a tool for research, extension and policy. Agricultural Systems 156, 115-125.
| Crossref | Google Scholar |
Martin F, Saavedra F (2018) Irrigated agriculture. In ‘Water policy in Chile. Vol. 21. Global Issues in Water Policy’. (Ed. G Donoso) pp. 165–177. (Springer) doi:10.1007/978-3-319-76702-4_11
Materne C (2019) Beyond the dry times – old man plains field day 2019. Alice Springs, Northern Territory. Available at https://futurebeef.com.au/old-man-plains-field-day-beyond-the-dry-times/
Mayberry D, Bartlett H, Moss J, Davison T, Herrero M (2019) Pathways to carbon-neutrality for the Australian red meat sector. Agricultural Systems 175, 13-21.
| Crossref | Google Scholar |
McGinn SM, Chen D, Loh Z, Hill J, Beauchemin KA, Denmead OT (2008) Methane emissions from feedlot cattle in Australia and Canada. Australian Journal of Experimental Agriculture 48, 183-185.
| Crossref | Google Scholar |
Moe PW, Tyrrell HF (1979) Methane production in dairy cows. Journal of Dairy Science 62, 1583-1586.
| Crossref | Google Scholar |
OECD/FAO (2022) OECD–FAO agricultural outlook 2022–2031. (OECD) Available at https://doi.org/10.1787/f1b0b29c-en
Pré-Consultants (2021) ‘SimaPro 9.3 Software.’ (Pré-Consultants: Amersfoort, Netherlands) Available at https://simapro.com/
Purvis JR (1986) Nuture the land: my philosophies of pastoral management in central Australia. The Rangeland Journal 8, 110-117.
| Crossref | Google Scholar |
Reisinger A, Clark H (2018) How much do direct livestock emissions actually contribute to global warming. Global Change Biology 24, 1749-1761.
| Crossref | Google Scholar | PubMed |
Reisinger A, Clark H, Cowie AL, Emmet-Booth J, Gonzalez Fischer C, Herrero M, Howden M, Leahy S (2021) How necessary and feasible are reductions of methane emissions from livestock to support stringent temperature goals? Philosophical Transactions of the Royal Society A: Mathematical, Physical and Engineering Sciences 379, 20200452.
| Crossref | Google Scholar |
Rogelj J, Shindell D, Jiang K, Fifita S, Forster P, Ginzburg V, Handa C, Kheshgi H, Kobayashi S, Kriegler E, Mundaca L, Séférian R, Vilariño M (2018) Mitigation pathways compatible with 1.5°C in the context of sustainable development. In ‘Global Warming of 1.5°C an IPCC special report on the impacts of global warming of 1.5°C above pre-industrial levels and related global greenhouse gas emission pathways, in the context of strengthening the global response to the threat of climate change’. (Eds V Masson-Delmotte, P Zhai, H-O Pörtner, D Roberts, J Skea, PR Shukla, A Pirani, W Moufouma-Okia, C Péan, R Pidcock, S Connors, JBR Matthews, Y Chen, X Zhou, MI Gomis, E Lonnoy, T Maycock, M Tignor, T Waterfield) pp. 93–174. (Intergovernmental Panel on Climate Change)
Roxburgh S, England J, Evans D, Nolan M, Opie K, Paul K, Reeson A, Cook G, Thomas D (2020) Potential future supply of carbon offsets in the land sector in Australia. (CSIRO) Available at https://doi.org/10.25919/h4xk-9r08
Smith SM, Lowe JA, Bowerman NHA, Gohar LK, Huntingford C, Allen MR (2012) Equivalence of greenhouse-gas emissions for peak temperature limits. Nature Climate Change 2, 535-538.
| Crossref | Google Scholar |
Thomson A (1999) Cattle production in the Gascoyne and interior regions of Western Australia; a report on the Cunyu demographic study (1990-1998) Australia; a report on the Cunyu demographic study (1990-1998) and the Mt Clere Producer Demonstration Site (1993-1997) and the Mt Clere Producer Demonstration Site (1993-1997). (Department of Agriculture Western Australia) Available at https://library.dpird.wa.gov.au/misc_pbns/162/
United Nations (2015) Adoption of the Paris Agreement. In ‘21st Conference of the Parties’. pp. 24–45. (United Nations: Paris, France) doi:10.4324/9789276082569-2
Walsh D, Cowley R (2016) Optimising beef business performance in northern Australia: what can 30 years of commercial innovation teach us? The Rangeland Journal 38, 291-305.
| Crossref | Google Scholar |
Wiedemann SG, Henry BK, McGahan EJ, Grant T, Murphy CM, Niethe G (2015) Resource use and greenhouse gas intensity of Australian beef production: 1981–2010. Agricultural Systems 133, 109-118.
| Crossref | Google Scholar |
Wiedemann S, McGahan E, Murphy C, Yan M (2016) Resource use and environmental impacts from beef production in eastern Australia investigated using life cycle assessment. Animal Production Science 56, 882-894.
| Crossref | Google Scholar |
Wiedemann S, Davis R, McGahan E, Murphy C, Redding M (2017) Resource use and greenhouse gas emissions from grain-finishing beef cattle in seven Australian feedlots: a life cycle assessment. Animal Production Science 57, 1149-1162.
| Crossref | Google Scholar |
Wiedemann S, Longworth E, Campbell D, Duff K (2022a) Carbon footprint and reduction options for Harvest Road Group operations. Available at https://www.mla.com.au/research-and-development/reports/2022/harvest-road-group-carbon-neutral-supply-chains-2025/