

Overview on Spectral Line Source Finding and Visualisation
B. S. KoribalskiCSIRO Astronomy & Space Science, Australia Telescope National Facility, PO Box 76, Epping, NSW 1710, Australia. Email: Baerbel.Koribalski@csiro.au
Publications of the Astronomical Society of Australia 29(3) 359-370 https://doi.org/10.1071/AS12030
Submitted: 3 April 2012 Accepted: 5 July 2012 Published: 15 August 2012
Journal Compilation © Astronomical Society of Australia 2012
Abstract
Here I will outline successes and challenges for finding spectral line sources in large data cubes that are dominated by noise. This is a 3D challenge as the sources we wish to catalog are spread over several spatial pixels and spectral channels. While 2D searches can be applied, e.g. channel by channel, optimal searches take into account the 3-dimensional nature of the sources. In this overview I will focus on Hi 21-cm spectral line source detection in extragalactic surveys, in particular HIPASS, the Hi Parkes All-Sky Survey and WALLABY, the ASKAP Hi All-Sky Survey. I use the original HIPASS data to highlight the diversity of spectral signatures of galaxies and gaseous clouds, both in emission and absorption. Among others, I report the discovery of a 680 km s–1 wide Hi absorption trough in the megamaser galaxy NGC 5793. Issues such as source confusion and baseline ripples, typically encountered in single-dish Hi surveys, are much reduced in interferometric Hi surveys. Several large Hi emission and absorption surveys are planned for the Australian Square Kilometre Array Pathfinder (ASKAP): here we focus on WALLABY, the 21-cm survey of the sky (δ < +30°; z < 0.26) which will take about one year of observing time with ASKAP. Novel phased array feeds (‘radio cameras’) will provide 30 deg2 instantaneous field-of-view. WALLABY is expected to detect more than 500 000 galaxies, unveil their large-scale structures and cosmological parameters, detect their extended, low-surface-brightness disks as well as gas streams and filaments between galaxies. It is a precursor for future Hi surveys with SKA Phase I and II, exploring galaxy formation and evolution. The compilation of highly reliable and complete source catalogs will require sophisticated source-finding algorithms as well as accurate source parametrisation.
Keywords: galaxies — methods: data analysis — radio lines: galaxies — surveys
1 Introduction
In recent years many remarkable galaxy surveys at optical and infrared wavelengths have become available. The Sloan Digital Sky Survey (SDSS, York et al. 2000) databases currently hold many millions of galaxies and nearly one million optical spectra (Eisenstein et al. 2011). McConnachie et al. (2009) extracted 29 million galaxies from SDSS DR6 to study Hickson Compact Groups and identified nearly 400 000 galaxy groups. Over 1.5 million galaxies are listed in the 2MASS Extended Source Catalog (XSC, Jarrett et al. 2000), and a WISE Extended Source Catalog has recently been released (Jarrett et al. 2012a, b). Multi-colour optical sky surveys such as PanSTARRS (Stubbs et al. 2010) and SkyMapper (Keller et al. 2007) are under way.
The NASA Extragalactic Database (NED) currently holds over 100 million objects classified as galaxies (M. Schmitz, private communication), and the Lyon Extragalactic Database (LEDA) contains at least 1.5 million bona-fide galaxies. In comparison, the total number of Hi 21-cm detected galaxies is small: several tens of thousands (Meyer et al. 2004; Springob et al. 2005; Wong et al. 2006; Haynes et al. 2011). The intrinsic faintness of the electron spin-flip transition of neutral atomic hydrogen (rest frequency 1.42 GHz) makes it difficult to detect Hi emission from individual galaxies at large distances. To study the Hi content of galaxies and diffuse Hi filaments between galaxies, we need radio synthesis telescopes with large collecting areas, low-noise receivers and large fields of view. Such requirements provide a range of engineering and computing challenges (Chippendale et al. 2010; Cornwell 2007; Schinckel et al. 2012, in preparation).
While we have come a long way since the discovery of the 21-cm spectral line by Ewen & Purcell in 1951, detecting a Milky Way-like galaxy at redshift z = 1 in Hi emission will require the Square Kilometre Array (Obreschkow, Heywood & Rawlings 2011). Several large radio surveys have been proposed for SKA pathfinder and precursor telescopes and are currently undergoing intense design studies. The latter include evaluating and improving source-finding algorithms which are needed to extract scientifically useful (i.e. highly reliable and complete) source catalogs from the large survey volumes.
This paper is organised as follows: in Section 2 I will briefly introduce the SKA Pathfinder Hi All-Sky Surveys (WALLABY and WNSHS), followed by an overview on source finding issues and algorithms in Section 3. In Section 4, I use the Hi Parkes All-Sky Survey (HIPASS, Barnes et al. 2001; Koribalski et al. 2004) to illustrate the diversity of galaxy Hi profiles and present new detections (see Figures 1–3). An overview of 3D visualisation tools, to explore source catalogs and data cubes, is given in Section 5.

|

|

|
2 SKA Pathfinder Hi Surveys
ASKAP, the Australian SKA Pathfinder (DeBoer et al. 2009), consists of 36 × 12-m antennas and is located in the Murchinson Shire of Western Australia. As of June 2012 the construction of all ASKAP antennas is completed. Of the 36 antennas, 30 are located within a circle of ~2 km diameter, while six antennas are at larger distances providing baselines up to 6 km. Each ASKAP dish will be equipped with novel Chequerboard phased array feeds (PAFs). We expect the first six Mk1 PAFs (the co-called BETA array) to be ready for engineering testing by the end of 2012, with science commissioning to be integrated when feasible. The instantaneous field-of-view of the ASKAP PAFs is 5.5 × 5.5-deg, i.e. 30 deg2 (Chippendale et al. 2010), making ASKAP a 21-cm survey machine. The WSRT APERTIF upgrade employs Vivaldi PAFs, delivering a field-of-view of 8 deg2 (Verheijen et al. 2008). The system temperature specification of the ASKAP PAFs is 50 K over the full band, with future PAF generations promising much higher performance.
WALLABY, the Widefield ASKAP L-band Legacy All-sky Blind surveY (led by Bärbel Koribalski & Lister Staveley-Smith; see Koribalski et al. 2009), will cover 75% of the sky (–90° < δ < +30°) over a frequency range from 1.13 to 1.43 GHz (corresponding to –2000 < cz < 77 000 km s–1) at resolutions of 30″ and 4 km s–1. For further details see Table 1. WALLABY will be carried out using the inner 30 antennas of ASKAP, which provide excellent uv-coverage and baselines up to 2 km. High-resolution (10″) ASKAP Hi observations using the full 36-antenna array will require further computing upgrades.

|
WNSHS, the Westerbork Northern Sky Hi Survey (led by Guyla Józsa; see Józsa et al. 2010), will cover a large fraction of the northern sky (δ > +27°) with APERTIF (Verheijen et al. 2008) over the same frequency range as WALLABY with ASKAP. Both Hi surveys combined will achieve a true all-sky survey with unprecedented resolution and depth. The science goals of both surveys are well developed and complement, as well as enhance, each other.
WALLABY and WNSHS are made possible by the development of phased array feeds, delivering a much larger field-of-view than single feed horns or multi-beam systems. A comparison of Hi survey parameters for HIPASS, WALLABY, and WNSHS is given in Table 1.
WALLABY will take approximately one year (i.e. 8 hours per pointing) and deliver an rms noise of 1.6 mJy beam–1 per 4 km s–1 channel. We estimate that more than 500 000 gas-rich galaxies can be individually detected within the WALLABY volume (Johnston et al. 2008; Duffy et al. 2012; Koribalski et al. 2012). The WALLABY team will examine the Hi properties and large-scale distributions of galaxies out to a redshift of z = 0.26 (equivalent to a look-back time of ~3 Gyr) in order to study: (1) galaxy formation and the missing satellite problem in the Local Group; (2) evolution and star-formation in galaxies; (3) mergers and interactions in galaxies; (4) the Hi mass function and its variation with galaxy density; (5) physical processes governing the distribution and evolution of cool gas at low redshift; (6) cosmological parameters relating to gas-rich galaxies; and (7) the nature of the cosmic web. WALLABY will detect dwarf galaxies (MHI = 108 M⊙) out to a distance of ~60 Mpc, massive galaxies (M*HI = 6 × 10⁹ M⊙) to ~500 Mpc, and super-massive galaxies like Malin 1 (MHI = 5 × 10¹⁰ M⊙) to the survey ‘edge’ of 1 Gpc. The mean sample redshift is expected to be z = 0.05 (200 Mpc).
3 Source-Finding Considerations
Reliability and completeness are of high importance when compiling source catalogs as knowing both is essential for the statistical analysis and interpretation of source properties. The process of finding sources can be considered one of many important steps (e.g. data pre-processing, source finding and characterisation, cataloging/post-processing) in the production of astronomical source catalogs.
The largest data volumes will come from wide-field spectral line surveys such as WALLABY and WNSHS, while radio continuum and polarisation surveys are typically an order of magnitude smaller. Apart from GASKAP, the Galactic ASKAP Survey1 (Dickey et al. 2012), ASKAP 21-cm surveys will use the full 300-MHz bandwidth. To achieve ~4-km s–1 velocity resolution, the extragalactic Hi surveys, WALLABY, WNSHS and also the Deep Investigations of Neutral Gas Origins (DINGO) survey, require the 300-MHz bandwidth to be divided into 16 384 channels.
In contrast, radio continuum surveys such as EMU, the Evolutionary Map of the Universe Survey (Norris et al. 2011), use the same band divided into 300 channels, each 1 MHz wide. EMU and WALLABY are likely to jointly survey the sky at 21-cm. While the WALLABY team expects to individually detect more than half a million gas-rich galaxies within the survey volume (3.26 Gpc3; see Section 2), the EMU team expects to detect ~70 million sources.
Huynh et al. (2012) explore 2D source finding algorithms such as sfind (Hopkins et al. 2002), S-Extractor (Bertin & Arnouts 1996), and duchamp (Whiting 2008; Whiting 2012), optimised for compact continuum sources. The high continuum source density means that confusion, dynamic range, and source identification (which is essential to gather optical redshifts) are key issues. Hancock et al. (2012) look into compact continuum source-finding and compare s-extractor, miriad imsad (Sault et al. 1995), sfind and Aegean. The Circle Hough Transform is explored by Hollitt & Johnston-Hollitt (2012) for the detection of extended and diffuse objects such as supernova remnants, radio galaxies and relics. Molinari et al. (2011) look into source extraction and photometry for continuum surveys at mid- and far-infrared as well as sub-millimetre wavelengths. They present a new method, cutex for CUrvature Thresholding EXtractor, to detect sources in the presence of intense and highly variable fore/background emission, in particular in the Galactic Plane (see also Marsh & Jarrett 2012).
Neither source confusion nor dynamic range are concerns for WALLABY. But, as the 21-cm line of atomic neutral hydrogen is intrinsically very faint, finding and characterising Hi clouds, filaments, and galaxies of various sizes in the 3D data cubes, is difficult. The 3D shape of Hi sources — in WALLABY galaxies are always extended over numerous velocity channels — typically provides a ‘contiguous block of voxels’ which is distinguishable from white noise. The Hi emission line traces the warm neutral hydrogen gas in galaxies whose observed velocity dispersion is typically 10 ± 2 km s–1 (Tamburro et al. 2009). This means that an Hi emission signal from a galaxy (even a face-on galaxy; see Petric & Rupen 2007) will always extend over at least two 4 km s–1 wide channels and generally over more than three channels. The ASKAP synthesized beam (~10″/30″ for the 6-/2-km arrays, respectively) is then sampled by at least three pixels in each spatial direction.
duchamp (Whiting 2008; Whiting 2012) is one of a number of programs for finding and characterising astronomical sources in images and data cubes. For ASKAP 21-cm data, a specific version of duchamp, called selavy, is being developed in extensive consultation with the ASKAP Survey Science Projects (see Whiting & Humphreys 2012). Basic testing of duchamp using (1) a set of spatially unresolved sources with narrow Gaussian spectra and (2) a set of spatially resolved sources with double-horn spectra was carried out by Westmeier, Popping & Serra (2012). To improve both the reliability and completeness of source finding over a broad range of parameters, a range of algorithms, based on wavelets, Kuiper and Kolmogorov-Smirnov tests, Bayesian statistics, etc., are being explored.
Among the new 3D algorithms are the Characterised Noise Hi (cnhi) source-finder (Jurek 2012), the 2D–1D Wavelet Reconstruction (Flöer & Winkel 2012), and the Smooth and Clip (S+C) technique (Serra et al. 2012; Popping et al. 2012). A combination of these techniques is currently being investigated. Serra, Jurek & Flöer (2012) look into the reliability of source finding algorithms using a statistical analysis of the noise characteristics in Hi data cubes. Pre-processing techniques such as iterative median smoothing and wavelet de-noising are discussed by Jurek & Brown (2012). A comprehensive comparison of the above mentioned source-finding algorithms has been conducted by Popping et al. (2012) using a range of thresholds and smoothing options.
Overall, the development of efficient and reliable 3D source finding tools will provide a major advance to the analysis of any large spectral line data set. It is very important to be able to search data cubes without adopting any prior knowledge of source properties (e.g. galaxy positions from optical or infrared catalogs). Such an open approach ensures a large variety of sources (in the Hi context, these are different types of galaxies and Hi filaments/clouds) is catalogued and is essential to avoid bias towards a narrow range of sources. Targeted searches, based on prior knowledge of the respective sources, would complement the open approach and address specific science goals.
Some surveys require highly specialised algorithms, for example searching for maser emission in HOPS, the H2O Galactic Plane Survey (Walsh et al. 2012), detection thresholds and bias correction for polarised continuum sources (George, Stil & Keller 2012), as well as finding and characterising sources in 4-colour data from WISE, the Wide-field Infrared Survey Explorer (Marsh & Jarrett 2012). Radio transients require yet other considerations; Keith et al. (2010) describe sophisticated pulsar searches in single-dish surveys, while Bannister & Cornwell (2011) introduce two new algorithms for the detection of transients in interferometric surveys.
Targeted searches may focus on particular spatial and/or spectral source shapes (e.g. very wide double-horn profiles, extended filaments or equi-distant recombination lines) using highly optimised search algorithms with build-in assumptions (so-called priors). For example, Allison, Sadler & Whiting (2012a) and Allison et al. (2012b) use Bayesian statistics to search for Hi absorption lines in spectra towards bright radio continuum sources. This will be of great importance for SKA pathfinder surveys like FLASH, the First Large Absorption Survey in Hi led by E. Sadler. Another example is provided by Hurley-Walker et al. (2012) who use Bayesian analysis with specific priors to search for the SZ effect from galaxy clusters.
The developments described above are targeted at optimising source detection for WALLABY and WNSHS. They will also be useful for deep interferometric Hi surveys, such as DINGO (led by M. Meyer), and LADUMA (led by S. Blyth & B. Holwerda), single-dish Hi surveys, such as HIPASS (Barnes et al. 2001; Koribalski et al. 2004), HIJASS (Lang et al. 2003; Wolfinger, Kilborn & Koribalski 2012), and EBHIS (Winkel et al. 2010), and many other large-volume Hi surveys.
4 HIPASS Source Finding
The development of a powerful 13-beam receiver system (Tsys ≈ 20 K) plus versatile correlator on the 64-m Parkes telescope instigated an era of large-scale 21-cm surveys of our Galaxy and the Local Universe. The Hi Parkes All-Sky Survey (HIPASS) is the largest and most prominent of the Parkes Hi surveys. It covers the whole sky to a declination limit of δ = 25° over a velocity range from –1280 to 12 700 km s–1. The Parkes gridded beam is ~15.5 arcmin (to sample the beam adequately a pixel size of 4 arcmin is used), the velocity resolution is 18 km s–1, and the rms noise is ~13 mJy beam–1 per channel (for a typical integration time of 8 minutes). See Barnes et al. (2001) for a detailed description of the HIPASS observations, calibration and imaging techniques.
Current galaxy catalogs include the HIPASS Bright Galaxy Catalog (HIPASS BGC; Koribalski et al. 2004; Ryan-Weber et al. 2002; Zwaan et al. 2003), the southern HIPASS catalog (HICAT, Meyer et al. 2004) and the northern HIPASS catalog (NHICAT; Wong et al. 2006). Together these catalogs, which are highly reliable (Zwaan et al. 2004), contain more than 5000 HI-rich galaxies and a few Hi clouds (e.g. HIPASS J0731–69; Ryder et al. 2001). In addition, Parkes Hi multibeam surveys of the Zone of Avoidance (ZOA) have catalogued more than 1000 galaxies (Staveley-Smith et al. 1998; Henning et al. 2000; Juraszek et al. 2000; Donley et al. 2005). Compact and extended populations of Galactic high-velocity clouds (HVCs) were catalogued by Putman et al. (2002).
Because our aim was to produce highly reliable HIPASS catalogs, many faint Hi sources have not (yet) been catalogued (see Figures 1 and 2). Furthermore, gas-rich galaxies with velocities less than ~300 km s–1 lie outside the parameter space considered for (N)HICAT (see Figure 3). This limit was chosen to avoid confusion with Galactic HVCs.
An advanced HIPASS data reduction is under way (Calabretta et al. 2012, in preparation), aiming to reduce on- and off-source spectral ripple as well as improve the bandpass calibration, survey sensitivity and source parametrisation. Our goal is to obtain much deeper HIPASS catalogs by employing the sophisticated source-finding algorithms discussed in this PASA Special Issue. A comparison of the original HIPASS data with the new version for several areas is under way.
4.1 New HIPASS Sources
In this section, I use HIPASS data to highlight the diversity of spectral signatures of galaxies and gaseous clouds, both in emission and absorption. I present some previously uncatalogued HIPASS detections of galaxies. Their low signal-to-noise and/or low velocity prevented inclusion in the published catalogs which were compiled following a blind search and verification based on the HIPASS data alone (see Meyer et al. 2004; Wong et al. 2006).The new HIPASS detections of galaxy groups, pairs and individual spirals are shown in Figures 1–3. HIPASS names are assigned as previously, using their fitted Hi position. Detailed source descriptions are given in the Appendix, and their HIPASS properties are summarised in Table 2.

|
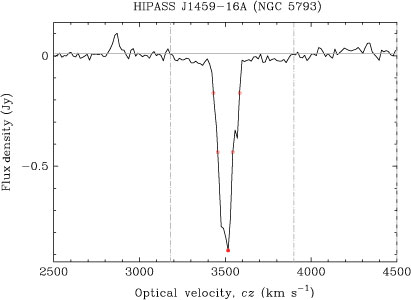
Galaxies with notable Hi absorption features detected in HIPASS are briefly discussed by Koribalski et al. (2004; Section 3.6). Prominent examples are NGC 253 (HIPASS J0047–25), NGC 3256 (HIPASS J1028–43), NGC 4945 (HIPASS J1305–49), Circinus (HIPASS J1413–65) and NGC 5128 (HIPASS J1324–42). Some galaxies with bright radio nuclei, such as NGC 5793 (HIPASS J1459–16A), are easily detected in Hi absorption but not seen in Hi emission, highlighting the fact that such galaxies would be missing from any Hi peak-flux limited catalogs despite their substantial Hi content. Because of the large Parkes beam (15.5 arcmin) HIPASS spectra of individual nearby galaxies with bright radio continuum emission may show a combination of Hi emission from the galaxy disk and Hi absorption against the star-forming nuclear region (examples are shown in Figure 2 and discussed in the Appendix).
Here I report the discovery of a 680 km s–1 wide Hi absorption trough in the megamaser galaxy NGC 5793. This feature is seen in addition to the well-known narrow Hi absorption line reported by Pihlström et al. (2000). Figures 4 and 5 show the respective HIPASS spectra; further details are given in the Appendix.
|
|
Galaxies in the Virgo cluster have systemic velocities typically ranging from –700 to +2700 km s–1. Notably, at velocities around zero, single-dish Hi observations are confused by Galactic Hi emission and HVCs, and the galaxy Hi properties can be hard to measure accurately. The HIPASS spectra of nine Virgo galaxies are shown in Figure 3 and their properties are summarised in Table 2. Independent distance estimates to Virgo galaxies range from about 16 to 24 Mpc.
4.2 Statistical Techniques
To study the properties of astronomical sources below the survey detection threshold, statistical approaches such as stacking and intensity mapping are used. For example, Pen et al. (2009) use the HIPASS data to co-add Hi spectra at the positions of 27 417 optical galaxies, after shifting their systemic velocities to a common restframe. As expected, this results in a large Hi signal, dominated by the bright Hi emission of individually detected galaxies. After removing all galaxies listed in HICAT (Meyer et al. 2004) the co-added Hi signal is detected at high significance (M. Meyer, private communication). The deep ASKAP Hi survey DINGO will detect most Hi sources through stacking of spectra from already known galaxies with accurate velocities).
Another technique to study Hi emission in and between galaxies over large volumes is known as intensity mapping. Instead of aiming to individually detect galaxies, which requires high angular resolution and sensitivity, this approach can be employed to measure the collective emission of many galaxies at low angular resolution (several tens of Mpc). The 21-cm intensity mapping allows the 3D measurement of large scale structures and velocity/flow fields to large redshifts.
5 Visualisation
Visual data exploration and discovery is used across all sciences with a large range of tools and algorithms available. Each discipline requires suitable software to analyse their data, the complexity and volume of which is growing steadily. Here I look into astronomical software packages and specific algorithms that allow the visualisation of galaxy data (incl. numerical simulations) from individual objects to survey catalogs.
3D visualisations of several thousand catalogued HIPASS galaxies (see Section 4) were created by Mark Calabretta and are available online2. The animations depict the distribution of gas-rich galaxies in the nearby Universe (z < 0.03), taking into account their positions, velocities/distances and Hi masses. Large-scale structures such as the Supergalactic Plane and the Local Void (see Koribalski et al. 2004) are clearly visible. In future we should be able to replace each source, currently depicted by a sphere, by a 3D multi-wavelength rendering of the respective galaxy.
Dolag et al. (2008) outline the wide-ranging benefits of data visualisation, in particular 3D rendering of complex data sets, and introduce the splotch public ray-tracing software (see description below). They emphasize the need for tools to visualise scientific data in a comprehensive, self-describing, rich and appealing way. splotch is a powerful package to do this (see also Jin et al. 2010).
Multi-wavelength images and spectral line data cubes of galaxies allow us to measure their stellar, gas and dark matter properties. Visualisation packages such as karma (see below) provide a range of tools to interactively view 2D and 3D data sets as well as apply mathematical operations. This allows not only the quick inspection and evaluation of multiple images, spectra and cubes, but also the production of beautiful multi-color images and animations.
To improve our understanding of galaxy formation and evolution, we need to include models and theoretical knowledge together with observations of galaxy disks and halos. By fitting and modelling the observed gas distribution and kinematics of extended galaxy disks, we derive their 3-dimensional shapes and rotational velocities (e.g. Józsa 2007; Kamphuis et al. 2011). Visualisation can then be employed to combine the actual data with our derived knowledge to re-construct the most likely 3D representation of each galaxy. By adding time as the fourth dimension one can also visualize the evolution of galaxies and the Universe (e.g. see the 4D Universe visualisation by Dolag et al. 2008).
A large range of astronomical visualisation packages is available, most of which are not discussed here. VO-compatible applications such as aladin, skyview, topcat, and voplot are well suited to viewing images, spectra and catalogs. Here I briefly highlight a few other visualisation tools:
|
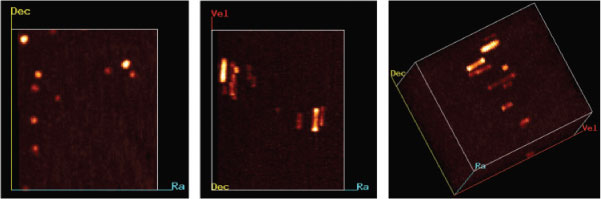
KARMA is a widely used, interactive software toolkit3 for the exploration and analysis of multi-frequency astrophysical images, spectra and data cubes (Gooch et al. 1995, 1996). karma is freely available and highly versatile, including a diverse range of software tools (e.g. kvis, xray, koords, kpvslice, krenzo, kshell). The most popular and probably best known tool is kvis, capable to visualise multi-wavelength images (FITS format and others) as well as spectral line data cubes. The xray program allows to volume render, animate, and explore spectral line (e.g. Hi cubes (examples are given in Figure 6). The strength of karma lies in the rapid and intuitive inspection of small data cubes and images through interactive visualisation. No further developments are planned, limiting the usefulness of the package for future data sets. The tools (and people) exist to write a much enhanced software package, which would be widely used and benefit many researchers.
SPLOTCH is a powerful and very flexible ray-tracer software tool4 which supports the visualisation of large-scale cosmological simulation data (Dolag et al. 2008, 2011; Jin et al. 2010). It is publicly available and continues to be enhanced. A small team is currently working on supporting the visualisation of multi-frequency observational data to achieve realistic 3D views and fly-throughs of nearby galaxies and galaxy groups. Large-scale astrophysical data sets coming from particle-based simulations have been successfully explored.
PARAVIEW is a fully parallel, open-source visualisation toolkit5, used for analyzing and visualizing cosmological simulations (see, e.g. Woodring et al. 2011).
S2PLOT is an advanced 3D plotting library6 with support for standard and enhanced display devices (Barnes et al. 2006). It provides techniques for displaying and interactively exploring astrophysical 3D data sets; for examples see Fluke, English & Barnes (2010).
CHROMOSCOPE is an interactive tool7 that facilitates the exploration and comparison of multi-wavelength fits images of astronomical data sets on various scales. For example applications see Walsh et al. (2012).
VisIVO is an integrated suite of software tools for the visualisation of astrophysical data tables (Becciani et al. 2010). Its web portal, VisIVOWeb, allows users to create customized views of 3D renderings (Costa et al. 2011). In contrast to splotch neither visivo8 nor tipsy9 are designed to lead to ray-tracing like images (Dolag et al. 2008).
Specific visualisation challenges for WALLABY are addressed by Fluke, Barnes & Hassan (2010), and Hassan & Fluke (2011). In this PASA Special Issue Hassan, Fluke & Barnes (2012) look into real-time 3D volume rendering of large (TBytes) astronomical data cubes.
6 Summary and Outlook
The large data volumes (images, cubes, and time series) expected from ASKAP and other SKA Pathfinders will require sophisticated source finding algorithms and visualisation tools. I presented an overview on the current state of astronomical source finding with emphasis on spectral line source finding for extragalactic Hi surveys. This snapshot highlights the many developments underway (e.g. Jurek 2012; Flöer & Winkel 2012; Allison et al. 2012a), exploring new techniques and testing these comprehensively (Westmeier et al. 2012, Popping et al. 2012). Not only are future source finding algorithms required to be highly reliable and complete, they also have to be fast. The challenge to find faint and/or unusual sources remains. To illustrate the difficulty of finding faint Hi emission and/or absorption signals in large, noise-dominated data cubes, I searched several HIPASS cubes and discussed the new detections. The data cubes produced by WALLABY (δ < +30°; z < 0.26), one of several large 21-cm surveys planned for ASKAP, will be so large that automated source-finding is essential. Visualisation will play a major role throughout the process of data calibration, source finding and source analysis. The algorithms used for the visualisation of large data cubes (e.g. to enable data quality control and error recognition, to find extended source structures, large-scale filaments and voids) are also required to be fast, as well as intuitive, interactive, and reliable. I gave an overview of some visualisation tools, many of which are also under development to allow both the analysis and interpretation of large data volumes, including ASKAP 21-cm surveys.
Acknowledgments
This research has made extensive use of the NASA/IPAC Extragalactic Database (NED) which is operated by the Jet Propulsion Laboratory, Caltech, under contract with the National Aeronautics and Space Administration.
The Digitised Sky Survey was produced by the Space Telescope Science Institute (STScI) and is based on photographic data from the UK Schmidt Telescope, the Royal Observatory Edinburgh, the UK Science and Engineering Research Council, and the Anglo-Australian Observatory.
I thank all colleagues for their contributions to this PASA Special Issue. It took much longer than expected to complete all papers, but hopefully this issue will provide a comprehensive resource in the field of source finding and visualisation as well as encourage many new ideas and further developments.
I like to particularly thank the referee for carefully reading the my submitted manuscript and making numerous suggestions which led to a much improved paper. Furthermore, I thank Chris Fluke, Tobias Westmeier, Paolo Serra, Ivy Wong and Russell Jurek for comments on the content of the paper.
I also like to thank Mark Wieringa and the ATNF computing team for many useful updates to the miriad software.
References
Allison, J. R., Sadler, E. M. and Whiting, M. T., 2012a, PASA, 29, 221| Crossref | GoogleScholarGoogle Scholar |
Allison, J. R. et al., 2012b, MNRAS, 423, 2601
| Crossref | GoogleScholarGoogle Scholar | 1:CAS:528:DC%2BC38XhtlWqurrJ&md5=43d3b6683e5bc92546f37555b4bd6b5bCAS |
Bajaja, E. et al., 1984, A&A, 141, 309
| 1:CAS:528:DyaL2MXoslSqtA%3D%3D&md5=8a481d1fde1e879d97b2486ea283e8f2CAS |
Bannister, K. W. and Cornwell, T. J., 2011, ApJS, 196, 16
| Crossref | GoogleScholarGoogle Scholar |
Barnes, D. G. et al., 2001, MNRAS, 322, 486
| Crossref | GoogleScholarGoogle Scholar |
Barnes, D. G., Fluke, C. J., Bourke, P. D. and Parry, O. T., 2006, PASA, 23, 82
| Crossref | GoogleScholarGoogle Scholar |
Becciani, U. et al., 2010, PASP, 122, 119
| Crossref | GoogleScholarGoogle Scholar |
Bertin, E. and Arnouts, S., 1996, A&AS, 317, 393
Cayatte, V., van Gorkom, J. H., Balkowski, C. and Kotanyi, C., 1990, AJ, 100, 604
| 1:CAS:528:DyaK3cXls1Wrsbc%3D&md5=a6ee77902756f150bed66313b0754158CAS |
Chippendale, A., et al., 2010, IEEE Symposium, 648
Chung, A., van Gorkom, J. H., Kenney, J. D. P., Crowl, H. and Vollmer, B., 2009, AJ, 138, 1741
| 1:CAS:528:DC%2BC3cXjsV2gsw%3D%3D&md5=256edd49df0c6cb54ec667353dc0a333CAS |
Cornwell, T., 2007, ASPC, 376, 223
Costa, A., Becciani, U., Gheller, C., Massimino, P., Krokos, M. and Grillo, A., 2011, ASPC, 442, 617
DeBoer, D., et al., 2009, IEEE, 97, 1507
Dickey, J. M., et al., 2012, PASA, in press
Dolag, K., Reinecke, M., Gheller, C. and Imboden, S., 2008, NJPh, 10, 125006
Dolag, K., Reinecke, M., Gheller, C., Rivi, M., Krokos, M. and Jin, Z., 2011, NJPh, 10, 125006
Donley, J. L. et al., 2005, AJ, 129, 220
| 1:CAS:528:DC%2BD2MXhs1egs78%3D&md5=e2749741b0548600ac66296f32823842CAS |
Duffy, A. R., Meyer, M. J., Staveley-Smith, L., Bernyk, M., Croton, D. J., Koribalski, B. S. and Westerlund, S., 2012, MNRAS, ,
Eisenstein, D. J. et al., 2011, AJ, 142, 72
Emonts, B. H. C. et al., 2008, MNRAS, 387, 197
| Crossref | GoogleScholarGoogle Scholar | 1:CAS:528:DC%2BD1cXosVGnsbo%3D&md5=82e5dc35abe5c0d92ad322571a53c444CAS |
Emonts, B. H. C., Burnett, C., Morganti, R. and Struve, C., 2012, MNRAS, 421, 1421
| Crossref | GoogleScholarGoogle Scholar | 1:CAS:528:DC%2BC38XmsFOkurk%3D&md5=f0797dd9c72971c73be550bda186b277CAS |
Flöer, L. and Winkel, B., 2012, PASA, 29, 244
| Crossref | GoogleScholarGoogle Scholar |
Fluke, C., English, J. and Barnes, D. G., 2010, in ADASSXIX ASPCS, 434, 167
Fluke, C., Barnes, D. G. & Hassan, A. H., 2010, in Proc. 6th IEEE International Conf. on e-Science Workshops (e-ScienceW 2010), Brisbane, Queensland, Australia, 7–10 December 2010, pp. 15–20, arXiv:astro-ph/1012.2901
Gardner, F. F. and Whiteoak, J. B., 1986, MNRAS, 221, 537
| 1:CAS:528:DyaL28Xlt1elsbc%3D&md5=244e1ecc9b1ff2f9680a03d58a3b11a4CAS |
George, S. J., Stil, J. M. and Keller, B. W., 2012, PASA, 29, 214
| Crossref | GoogleScholarGoogle Scholar |
Gooch, R., 1995, ASPC, 77, 144
Gooch, R., 1996, ASPC, 101, 80
| Crossref | GoogleScholarGoogle Scholar |
Hagiwara, Y., Kohno, K., Kawabe, R. and Nakai, N., 1997, PASJ, 49, 171
| 1:CAS:528:DyaK2sXjslCjsbg%3D&md5=b477048726d26ac46e88333a09eb53acCAS |
Hancock, P., Murphy, T., Gaensler, B. M., Hopkins, A. and Curran, J. R., 2012, MNRAS, 422, 1812
| Crossref | GoogleScholarGoogle Scholar |
Hassan, A. and Fluke, C., 2011, PASA, 28, 150
Hassan, A., Fluke, C. and Barnes, D. G., 2012, PASA, 29, 340
| Crossref | GoogleScholarGoogle Scholar |
Haynes, M. P. et al., 2011, AJ, 142, 170
Henning, P. A. et al., 2000, AJ, 119, 2686
| 1:CAS:528:DC%2BD3cXlsFyms78%3D&md5=412f785a5023af80117b78ceaaaa3ddeCAS |
Hollitt, C. P. and Johnston-Hollitt, M., 2012, PASA, 29, 309
| Crossref | GoogleScholarGoogle Scholar |
Hopkins, A. M., Miller, C. J., Connolly, A. J., Genovese, C., Nichol, R. C. and Wasserman, L., 2002, AJ, 123, 1086
Hurley-Walker, et al., 2012, MNRAS, 419, 2921
| Crossref | GoogleScholarGoogle Scholar |
Huynh, M., Hopkins, A., Norris, R., Hancock, P., Murphy, T., Jurek, R. and Whiting, M .T., 2012, PASA, 29, 229
| Crossref | GoogleScholarGoogle Scholar |
Jarrett, T. H. et al., 2000, AJ, 120, 298
Jarrett, T. H. et al., 2012a, AJ, 144, 68
Jarrett, T. H. et al., 2012b, AJ, ,
Jin, Z., Krokos, M., Rivi, M., Gheller, C., Dolag, K. & Reinecke, M., 2010, ICCS 2010 Conference (Amsterdam: Elsevier), Volume 1, Issue 1, arXiv:astro-ph/1004.1302
Johnston, S. et al., 2008, ExA, 22, 151
Józsa, G., 2007, A&A, 468, 903
Józsa, G., et al., 2010, WSRT APERTIF Expression of Interest
Juraszek, S. J. et al., 2000, AJ, 119, 1627
| 1:CAS:528:DC%2BD3cXjtVansL8%3D&md5=43fd9cbdf12faff791a622d6c43dbd78CAS |
Jurek, R., 2012, PASA, 29, 251
| Crossref | GoogleScholarGoogle Scholar |
Jurek, R. and Brown, S., 2012, PASA, 29, 352
| Crossref | GoogleScholarGoogle Scholar |
Kamphuis, P., Peletier, R. F., van der Kruit, P. C. and Heald, G. H., 2011, MNRAS, 414, 3444
| Crossref | GoogleScholarGoogle Scholar | 1:CAS:528:DC%2BC3MXhtVKiu7bF&md5=15b0969b37032dc4b7fe082db6ae1d07CAS |
Keith, M. J. et al., 2010, MNRAS, 409, 619
| Crossref | GoogleScholarGoogle Scholar |
Keller, S. et al., 2007, PASA, 24, 1
| Crossref | GoogleScholarGoogle Scholar |
Koribalski, B. S. et al., 2004, AJ, 128, 16
| 1:CAS:528:DC%2BD2cXmsVagt7Y%3D&md5=7e2f111351d39252b92d0fdc54b66155CAS |
Koribalski, B. S., et al., 2009, ASKAP Survey Science Project: WALLABY proposal
Koribalski, B. S., et al., 2012, in preparation
Lang, R. H. et al., 2003, MNRAS, 342, 738
| Crossref | GoogleScholarGoogle Scholar | 1:CAS:528:DC%2BD3sXlvFeis7Y%3D&md5=d202651020d31ddd97047963455d9743CAS |
Marsh, K. A. and Jarrett, T. H., 2012, PASA, 29, 269
| Crossref | GoogleScholarGoogle Scholar |
McConnachie, et al., 2009, MNRAS, 395, 255
| Crossref | GoogleScholarGoogle Scholar |
Meyer, M. et al., 2004, MNRAS, 350, 1195
| Crossref | GoogleScholarGoogle Scholar | 1:CAS:528:DC%2BD2cXls1Sjurc%3D&md5=a45ea5e988dc074b2b07256ef6e8123aCAS |
Molinari, S., Schisano, E., Faustini, F., Pestalozzi, M., di Giorgio, A. M. and Liu, S., 2011, A&A, 530, 133
Morganti, R., Oosterloo, T. and Tsvetanov, Z., 1998, AJ, 115, 915
| 1:CAS:528:DyaK1cXitFars7g%3D&md5=15761a490912108e4f8f33636b6bb452CAS |
Morganti, R., Oosterloo, T. A., Tadhunter, C. N., van Moorsel, G. and Emonts, B., 2005, A&A, 439, 521
| 1:CAS:528:DC%2BD2MXhtVegsrnF&md5=7ff2e54d8ab0079ad60fa61da5f3728bCAS |
Morganti, R. et al., 2011, A&A, 535, 97
Norris, R. P. et al., 2011, PASA, 28, 215
| Crossref | GoogleScholarGoogle Scholar |
Obreschkow, D., Heywood, I. and Rawlings, S., 2011, ApJ, 743, 84
| Crossref | GoogleScholarGoogle Scholar |
Oosterloo, T. A., Morganti, R., Tzioumis, A., Reynolds, J., King, E., McCulloch, P. and Tsvetanov, Z., 2000, AJ, 119, 2085
| 1:CAS:528:DC%2BD3cXlsFGhu74%3D&md5=616529e59d356818b9d1ca2a15c7a8f6CAS |
Oosterloo, T. A., Morganti, R., Sadler, E., van der Hulst, T. and Serra, P., 2007, A&A, 465, 787
| 1:CAS:528:DC%2BD2sXlvFyku74%3D&md5=a59c169b506404f295018e222b9b821bCAS |
Pen, U.-L., Staveley-Smith, L., Peterson, J. B. and Chang, T., 2009, MNRAS, 394, L6
Petric, A. O. and Rupen, M. P., 2007, AJ, 134, 1952
| 1:CAS:528:DC%2BD2sXhsVSkurrO&md5=5be3444a95ac24aac744c12f1dc1dfe9CAS |
Pihlström, Y. M., 2001, PhD Thesis, Chalmers University of Technology, Sweden
Pihlström, Y. M., Conway, J. E., Booth, R. S., Diamond, P. J. and Koribalski, B. S., 2000, A&A, 357, 7
Popping, A., Jurek, R., Westmeier, T., Serra, P., Flöer, L., Meyer, M. and Koribalski, B., 2012, PASA, 29, 318
| Crossref | GoogleScholarGoogle Scholar |
Putman, M. E. et al., 2002, AJ, 123, 873
Ryan-Weber, E. et al., 2002, AJ, 124, 1954
Ryan-Weber, E. et al., 2004, AJ, 127, 1431
Ryder, S. D. et al., 2001, ApJ, 555, 232
| Crossref | GoogleScholarGoogle Scholar |
Sault, R. J., Teuben, P. J. and Wright, M. C. H., 1995, ASPC, 77, 433
Schneider, S. E., Thuan, T. X., Magri, C. and Wadiak, J. E., 1990, ApJS, 72, 245
| Crossref | GoogleScholarGoogle Scholar | 1:CAS:528:DyaK3cXhs1ynsbg%3D&md5=6847eb7ec1757b50dc0402cbb833ebfbCAS |
Schweizer, F., van Gorkom, J. and Seitzer, P., 1989, ApJ, 338, 770
| Crossref | GoogleScholarGoogle Scholar | 1:CAS:528:DyaL1MXhs1ejt7c%3D&md5=b27be561adbf4951d8b8f69a61184600CAS |
Serra, P., Jurek, R. and Flöer, L., 2012, PASA, 29, 296
| Crossref | GoogleScholarGoogle Scholar |
Serra, P. et al., 2012, MNRAS, 422, 1835
| Crossref | GoogleScholarGoogle Scholar | 1:CAS:528:DC%2BC38XhtVWjs7nL&md5=64fde65abc89e9e3bb2c46769072258fCAS |
Springob, C. M., Haynes, M. P., Giovanelli, R. and Kent, B. R., 2005, ApJS, 160, 149
| Crossref | GoogleScholarGoogle Scholar | 1:CAS:528:DC%2BD2MXhtVOltLrM&md5=cad0e3887dc85b70c3c31524f2de3d8fCAS |
Staveley-Smith, L. et al., 1998, AJ, 116, 2717
| 1:CAS:528:DyaK1MXjslKjsw%3D%3D&md5=800ca58a41de952c4202c0fdbd02a2aaCAS |
Stubbs, C. W. et al., 2010, ApJS, 191, 376
| Crossref | GoogleScholarGoogle Scholar | 1:CAS:528:DC%2BC3MXnvV2lsA%3D%3D&md5=bf546860881b5eed79e89a96ec472913CAS |
Tamburro, D., Rix, H.-W., Leroy, A. K., MacLow, M. M., Walter, F., Kennicutt, R. C., Brinks, E. and de Blok, W. J. G., 2009, AJ, 137, 4424
| 1:CAS:528:DC%2BD1MXlslOjsLg%3D&md5=c45a35436eac98661cf02ed158fcd370CAS |
Taylor, G. B. et al., 2002, ApJ, 574, 88
| Crossref | GoogleScholarGoogle Scholar | 1:CAS:528:DC%2BD38XmtlGnsLc%3D&md5=a8189f9414e0f941b747c680dd273f5cCAS |
Taylor, G. B., Peck, A. B., Ulvestad, J. S. and O’Dea, C. P., 2004, ApJ, 612, 780
| Crossref | GoogleScholarGoogle Scholar | 1:CAS:528:DC%2BD2cXpt1aiur0%3D&md5=71dcbfe916a425b947e2183ca4a17e0bCAS |
van Gorkom, J. H. et al., 1989, AJ, 97, 708
| 1:CAS:528:DyaL1MXhsVChsbo%3D&md5=887b041fe616660f408377d0f902ad35CAS |
Verheijen, M., Oosterloo, T. A., van Cappellen, W. A., Bakker, L., Ivashina, M. V. and van der Hulst, J. M., 2008, AIPC, 1035, 265
| 1:CAS:528:DC%2BD1cXpslSjt7s%3D&md5=7c0ea63b8a7ed621fd049d877fc5e414CAS |
Walsh, A., Purcell, C., Longmore, S., Jordan, C. H. and Lowe, V., 2012, PASA, 29, 262
| Crossref | GoogleScholarGoogle Scholar |
Warmels, R. H., 1988a, A&AS, 72, 19
| 1:CAS:528:DyaL1cXhtVems7k%3D&md5=b5227250f16104f0cca5e3df158f7d1eCAS |
Warmels, R. H., 1988b, A&AS, 72, 57
| 1:CAS:528:DyaL1cXhtVems7Y%3D&md5=8f96925629d18a330a4bc279653266adCAS |
Waugh, M. et al., 2002, MNRAS, 337, 641
| Crossref | GoogleScholarGoogle Scholar | 1:CAS:528:DC%2BD3sXjtFSjsw%3D%3D&md5=4a6f496fcd00b17609c683762ac9c9cdCAS |
Westmeier, T., Popping, A. and Serra, P., 2012, PASA, 29, 276
| Crossref | GoogleScholarGoogle Scholar |
Whiting, M., 2008, in Galaxies in the Local Volume, Ap&SS Proc., ed. B. Koribalski & H. Jerjen (Springer), 343
Whiting, M., 2012, MNRAS, 421, 3242
| Crossref | GoogleScholarGoogle Scholar | 1:CAS:528:DC%2BC38XnvVGju7s%3D&md5=346776d3f9eb27b7cafef9e3afe75be9CAS |
Whiting, M. and Humphreys, B., 2012, PASA, 29, 371
| Crossref | GoogleScholarGoogle Scholar |
Winkel, B., Kalberla, P. M. W., Kerp, J. and Flöer, L., 2010, ApJS, 188, 488
| Crossref | GoogleScholarGoogle Scholar | 1:CAS:528:DC%2BC3cXpt1Oqt78%3D&md5=89f325aff4f99cd368dc8a7afbeb7a82CAS |
Wolfinger, K., Kilborn, V. and Koribalski, B. S., 2012, MNRAS, ,
Wong, I. et al., 2006, MNRAS, 371, 1855
| Crossref | GoogleScholarGoogle Scholar | 1:CAS:528:DC%2BD28Xht1SgsrzI&md5=c64b696dc430728dd24b9d57619c15d1CAS |
Woodring, J., Heitmann, K., Ahrens, J., Fasel, P., Hsu, C.-H., Habib, S. and Pope, A., 2011, ApJS, 195, 11
| Crossref | GoogleScholarGoogle Scholar |
York, D. G. et al., 2000, AJ, 120, 1579
Zwaan, M. A. et al., 2003, AJ, 125, 2842
| 1:CAS:528:DC%2BD3sXlsVShtb8%3D&md5=5b9a2e5ced3b226b18660a2fe3d870e7CAS |
Zwaan, M. A. et al., 2004, MNRAS, 350, 1210
| Crossref | GoogleScholarGoogle Scholar | 1:CAS:528:DC%2BD2cXls1Sju70%3D&md5=206e778a5b1e251e3285272b0d2f0ad1CAS |
1 Within their proposed 7.3-MHz band, centred on the Galactic Hi line, GASKAP will also be able to detect nearby, gas-rich galaxies at high velocity resolution (0.25 km s–1). This is of great benefit to the kinematical study of low-mass dwarf galaxies which rotate slowly and often display high turbulence and non-circular motions.
2 www.atnf.csiro.au/people/mcalabre/animations
3 www.atnf.csiro.au/computing/software/karma
4 www.mpa-garching.mpg.de/~kdolag/splotch
5 www.paraview.org
6 astronomy.swin.edu.au/s2plot
7 www.chromoscope.net
8 visivoweb.oact.inaf.it/visivoweb
9 www-hpcc.astro.washington.edu/tools/tipsy/tipsy.html
Appendix
The new HIPASS detections are briefly described here. Table 2 lists their Hi emission and absorption properties, as fitted with the miriad task mbspect. For further details see Section 4.1.
HIPASS J0354–36a Extended Hi emission (see Figure 1, left) is detected from the region encompassing the galaxies IC 2006 (vopt = 1381 km s–1) and ESO359-G005 (vopt = 1399 km s–1). Both are members of the Fornax cluster which was studied in detail by Waugh et al. (2002). IC 2006 is an S0 galaxy with a 5-arcmin diameter Hi ring (Schweizer, van Gorkom & Seitzer 1989); the dwarf irregular galaxy ESO359-G005 is a gas-rich companion. I measure a total Hi flux density of ~9.8 Jy km s–1 (corresponding to an Hi mass of 1.6 × 10⁹ M⊙ assuming a distance of 26 Mpc), about twice the amount detected by Schweizer et al. (1989). Other prominent S0 galaxies with (partial) Hi rings are NGC 1490 (HIPASS J0352–66) and NGC 1533 (HIPASS J0409–56), see Oosterloo et al. (2007) and Ryan-Weber et al. (2004), respectively.
HIPASS J1239–11 Wide Hi emission (see Figure 1, right) from the Sombrero galaxy (M 104, NGC 4594; vopt = 1082 km s–1) is detected in HIPASS, even though the Hi spectrum is strongly affected by baseline ripple. Most prominent are the two Hi peaks of the double-horn spectrum, separated by nearly 800 km s–1. The Hi emission appears to extend along the edge-on dust ring of this beautiful early-type galaxy (Bajaja et al. 1984). There is also a hint of narrow Hi absorption (~1138 km s–1) against its Sy 2 nucleus.
The following HIPASS galaxies (see Figure 2) show both faint Hi emission and absorption features. Their parametrisation is difficult and remains tentative. In most cases, interferometric Hi data for these sources exist in the literature. For further studies of galaxies with associated Hi absorption, see van Gorkom et al. (1989), Pihlström (2001), Taylor et al. (2002), and Morganti et al. (2005).
HIPASS J1459–16A Wide (680 km s–1) and narrow (150 km s–1) Hi absorption features are detected towards the well-known water megamaser galaxy NGC 5793 (PKS B1456–164; vopt = 3491 km s–1). Figures 4 and 5 show the respective HIPASS spectra. The Hi velocity range seen in absorption, ~3200 to 3880 km s–1, is broader than that of the known H2O masers (Hagiwara et al. 1997) and may indicate a much higher rotational velocity of the nuclear ring and consequently a much larger central mass than previously estimated. This is a spectacular discovery which requires further investigation. There are clear similarities to the Hi absorption systems found in PKS 1814–637 and discussed by Morganti et al. (2011). The much narrower but extremely deep Hi absorption line seen towards NGC 5793 is discussed by Pihlström et al. (2000); see also Gardner & Whiteoak (1986) and Koribalski et al. (2004). — NGC 5793 has several neighbours, two of which are detected in HIPASS: the Sb galaxy NGC 5815 (vopt = 2995 km s–1) and the dIrr galaxy 6dF J1459410–164235 (vopt = 2857 km s–1). The E0 galaxy NGC 5796 is probably Hi poor.
HIPASS J2052–57 Hi emission and blue-shifted Hi absorption is detected towards the Sy 2 galaxy IC 5063 (PKS B2048–572; vopt = 3402 km s–1). The latter is indicative of fast gas outflow; for a detailed discussion see Morganti, Oosterloo & Tsvetanov (1998) and Oosterloo et al. (2000). Note that RFI at 1408 MHz (~2650 km s–1) also affects the displayed HIPASS spectrum.
HIPASS J1140+17 Wide Hi emission and narrow Hi absorption is detected towards the FR-I galaxy NGC 3801 (PKS B1137+180; vopt = 3494 km s–1). For a detailed discussion of NGC 3801 and its gas-rich environment see Emonts et al. (2012). Six galaxies and two Hi clouds contribute to the emission of HIPASS J1140+17 (from ~3100 to 4000 km s–1).
HIPASS J0133–36 Wide Hi emission and narrow Hi absorption is also detected towards the FR-II radio galaxy NGC 612 (PKS 0131–36; vopt = 8925 km s–1). The mid-point of the Hi emission agrees with that of the narrow Hi absorption (~8789 km s–1). For a detailed study see Emonts et al. (2008). We note a ~100 km s–1 offset to their Hi absorption line measurement. The HIPASS FHI measurement, comprising NGC 612 and neighbouring galaxies, is ~13 Jy km s–1, corresponding to 4.7 × 10¹⁰ M⊙ (assuming D = 125 Mpc).
HIPASS J2229–18 Weak Hi absorption over a wide velocity range, from ~6900 to 7650 km s–1, appears to be detected towards the gigamaser galaxy TXS 2226–184 (vopt = 7551 km s–1). With the majority of the absorption clearly blue-shifted with respect to the systemic velocity, gas outflow is a likely explanation. VLA Hi measurements reveal a much narrower (420 km s–1) absorption feature (Taylor et al. 2002, 2004). Further Hi data are needed to confirm this result.
HIPASS detections of galaxies in and near the Virgo cluster (see Figure 3) are discussed below. Extensive Hi studies were carried out by Warmels (1988a, b), Cayatte et al. (1990) and Chung et al. (2009).
HIPASS J1213+14 Cayatte et al. (1990) report on VLA Hi observations of the large spiral galaxy M 98 (NGC 4192). They find the gas distribution to be warped, extending nearly 15 arcmin in diameter over a velocity range from about –360 to +120 km s–1 (see also Chung et al. 2009). Assuming a distance of 16 Mpc, we derive an Hi mass of 4.6 × 10⁹ M⊙. Our HIPASS spectrum is highly contaminated by bright Galactic Hi emission in the velocity range from about –100 to +60 km s–1 as well as HVCs at higher velocities.
HIPASS J1217+12 IC 3105 is a small edge-on galaxy at a distance of 14 Mpc. Our FHI value agrees well with the Arecibo Hi measurements by Schneider et al. (1990). We derive an Hi mass of 3.2 × 10⁸ M⊙.
HIPASS J1221+11 NGC 4294/9 is an interacting galaxy pair with extended Hi emission from both galaxies (Chung et al. 2009). The projected separation between NGC 4294 (vsys = 363 km s–1) and NGC 4299 (vsys = 227 km s–1) is 5.6 arcmin. Our HIPASS FHI measurement of approximately 44 Jy km s–1 for the system (HIPASS J1221+11; Wong et al. 2006) agrees well with the FHI values (27 and 18 Jy km s–1) given by Chung et al. from VLA Hi data, but is likely an underestimate.
HIPASS J1233+15 NGC 4523 is Magellanic dwarf galaxy at a distance of 17 Mpc. Our FHI value agrees well with previous Hi measurements. We derive an Hi mass of 1.4 × 10⁹ M⊙.
HIPASS J1242+14 NGC 4633/4 is an interacting galaxy pair detected with the WSRT in Hi emission over a velocity range from –50 to +410 km s–1 by Oosterloo & Shostak (1993). The projected separation between NGC 4634 (vsys = 115 km s–1) and NGC 4633 (vsys = 297 km s–1) is 3.8 arcmin. Our HIPASS FHI measurement of 12 Jy km s–1 is slightly lower than the sum of the FHI values (7.4 and 5.8 Jy km s–1) given by Oosterloo & Shostak. Our underestimate is due to Galactic Hi emission at velocities below +140 km s–1 affecting our ability to estimate the blue-shifted Hi emission from NGC 4634.
HIPASS J1258+14 UGC 08091 is a dwarf irregular galaxy at a distance of about 2 Mpc. It lies in the foreground of the Virgo cluster. Our FHI value agrees well with previous Hi measurements. We derive an Hi mass of 8.5 × 10⁶ M⊙.