

From mallees to mountain ash, specific leaf area is coordinated with eucalypt tree stature, resprouting, stem construction, and fruit size
Antoinette M. Portelli A , Saras M. Windecker A , Laura J. Pollock B , Will C. Neal C , William K. Morris A D , Rohan Khot A and Peter A. Vesk A *
A
B
C
D
Abstract
The radiation of eucalypts into almost every Australian environment offers valuable insights to plant ecological strategies.
We aimed to assess the degree to which functional traits across different organs are independent or reflect coordinated strategies in southern eucalypts.
We applied ordinary and phylogenetic generalised least squares regressions to 164 southern Australian taxa, examining the network of pairwise relationships between 10 functional traits representing aspects of stature, leaf economics, reproduction and post-fire regeneration. We examined coordination and modularity in this network and estimated how phylogeny affects observed trait correlations.
Stem and stature traits were generally independent of reproductive traits, with Specific Leaf Area the most connected trait, being correlated with traits from all organs. Resprouting ability was also connected to several traits. Species able to resprout basally, but not epicormically, were on average shorter, stouter, with higher stem sapwood density, thinner bark, smaller leaves and lower Specific Leaf Area than those able to resprout using both methods. Taxa resembled their relatives; phylogenetic signal was significant for all continuous traits except Relative Height, ranging from Pagel’s Lambda λ = 0.37 (Relative Bark Thickness) to λ = 0.82 (Specific Leaf Area). Phylogenetic analyses showed weakened correlations for most (but not all) trait pairs. However, most moderate relationships on the trait correlation network also displayed correlated evolution.
Stature, stem, leaf and reproductive traits and fire response of eucalypts are somewhat coordinated, principally through leaf economics. Trait combinations that confer ecological competence on eucalypt taxa in present-day conditions are likely to have been similarly favoured throughout their evolutionary history.
This supports theory of coordinated plant strategies.
Keywords: correlated traits, eucalypts, fire response, functional traits, PGLS, phylogenetic signal, plant ecology, plant evolution, plant strategies, southern Australia.
Introduction
Eucalypts comprising the genera Eucalyptus L’Hér., Corymbia K.D. Hill & L.A.S. Johnson, and Angophora Cav. represent a remarkable radiation of approximately 900 species, with Eucalyptus dating back to at least the Eocene (~52 Mya) (Gandolfo et al. 2011) and the eucalypt group to the Late Cretaceous (Ladiges et al. 2003). Dominating most woody vegetation in the Australian landscape, their open forests and woodlands cover much of the land mass excluding only the driest deserts, saline areas, and most closed forests (Williams and Woinarski 1997; Montreal Process Implementation Group for Australia and National Forest Inventory Steering Committee 2018). Studying functional ecology of the eucalypts is important intrinsically, to their conservation, and to the ecosystems and organisms, including people, that depend on them (Keane et al. 2000; Werner et al. 2008; Bayle 2019). Eucalypts serve as a model clade for understanding ecological radiation, owing to the large and growing knowledge of phylogeny, functional traits and distribution and function (Cavender-Bares 2019). Relationships between functional traits (sensuWestoby and Wright 2006; Violle et al. 2007) observed across larger datasets (see Díaz et al. 2016; Kleyer et al. 2019) may not hold uniformly at more local geographic or taxonomic scales (Messier et al. 2017a). The broadly dry, fire-prone, and often nutrient-deficient environment in which the eucalypts have evolved is likely to have influenced ecological strategies that may be reflected in their functional traits and how they have evolved through time (Beadle 1966; Burrows 2013; Dantas and Pausas 2013; Bui et al. 2017). More specific hypotheses about the interplay of landscape and evolution for ecological and life history strategies, such as OCBIL theory, also prompt study of functional ecology of eucalypts (OCBIL: ‘old, climatically buffered, infertile landscapes’; Hopper 2009, 2021). Here we aim to characterise patterns of functional traits and their evolutionary patterns in a large subset of eucalypts of southern Australia.
Much work has investigated single, or suites of, traits representing the same organ or function. A number of axes of variation in trait-based trade-offs have since emerged, such as: the leaf economics spectrum relating to leaf carbon assimilation vs leaf longevity (Wright et al. 2004); wood economics relating wood density to hydraulic and mechanical stress tolerance vs growth (Chave et al. 2009); and the seed mass vs seed output trade-off (Westoby et al. 2002; Muller-Landau 2010). In the eucalypts, particular study has also focused on traits related to similar aspects of plant ecology such as stem hydraulics (Pfautsch et al. 2016; Fernández et al. 2019), leaf and photosynthetic characteristics (Asao et al. 2020), bark (Lawes et al. 2021), and fruit and seed characteristics (Murray and Gill 2001), as well as fire response (Nicolle 2006) and buds (Burrows 2013). Fire responses of plants have received considerable focus (Clarke et al. 2013, 2015; Lawes et al. 2022) but with rather less attention to their connection to other functional traits (though, see Pausas et al. 2016). A notable exception is the finding that plants that resprout are shorter than non-resprouters (Midgley 1996; Kruger et al. 1997).
We use the term ‘coordination’ to refer to functional relationships that occur between traits owing to some hypothesised causal process, such as the trade-offs underlying ecological strategies (Westoby et al. 2002; Westoby and Wright 2006; Reich 2014). We use the term ‘correlation’ to refer to the observed statistical relationship between two variables. Coordination may be expected within organs, such as the leaf economics spectrum characterising conservative vs acquisitive carbon assimilation strategies (Wright et al. 2004). Correlation between traits in a spatially extensive dataset may result from coordinated shifts in two traits responding to an environmental gradient, as observed for specific leaf area and leaf size both declining to low rainfall (Fonseca et al. 2000).
However, there is reason to believe that neither traits nor the axes they represent occur independently, but in integrated combinations within the whole-plant system that are all subject to natural selection simultaneously (Givnish 1988; Messier et al. 2017b). Because many plant traits relate to multiple aspects of ecological strategy and physical constraints, their interrelationships likely form complex constellations rather than independent discrete axes (Messier et al. 2017b; Kleyer et al. 2019; Caminha-Paiva et al. 2021). We expect strong coordination among some traits measured on the same organs due to allometric constraints (e.g. large seeds can only be borne by large fruits; Cornelissen 1999) or reflecting allocation trade-offs (e.g. stem sapwood density may be lower among trees capable of greater maximum height in a vertical light gradient; Falster and Westoby 2005). Coordination may also exist between organs. Corner’s rules highlight that larger twigs are needed to bear bigger appendages, whether they are leaves or fruit (Corner 1949). Thin twigs cannot support big leaves nor big fruits, but the relationship between size of those organs – leaves and fruit – may be triangular and not a linear correlation (Cornelissen 1999). Reich (2014) argued that a continuum of fast–slow growth strategies reflecting acquisitive to conservative resource use manifests across all organs (leaf, stems and roots).
Evidence for coordination includes a global analysis of woody plant form and function, which reports moderate, positive correlations (r > 0.3) among leaf size, plant height and seed mass and between leaf size and specific leaf area (Díaz et al. 2016). Studies utilising trait network analyses demonstrate that traits across organs (leaves, fruits stems and roots) and function (allocation economics, architecture, regeneration) may be coordinated (Messier et al. 2017a; Kleyer et al. 2019).
To explore the interrelations of different dimensions of ecological strategy, we studied multiple, easily measured allocation traits in eucalypts representing strategies related to stature, stem allocation, leaf size and economics, along with regeneration, through fruit and seed and post-fire resprouting ability. A full list of traits used in this study and their functional significance can be found in Table 1.
Trait | Method of measurement | Represented strategy dimension | |
|---|---|---|---|
Stature traits | |||
Maximum height (MH) | Downloaded from EUCLID database (Slee et al. 2015) | Growing tall confers a competitive advantage for light from above. But it incurs costs of investment in support and supply (Givnish 1982; Loehle 2000; Westoby et al. 2002; Falster and Westoby 2003). Greater height growth is associated with site ‘productivity’ (Moles et al. 2009) and might be expected to coordinate with more ‘productive’ than ‘conservative’ strategies. Frequent disturbances causing loss of canopy or stem, limit height. | |
Relative height (RH) | Height (H, m) of individual trees was first measured via clinometer along with girth (G) at breast height. Relative Height at 100 cm girth was calculated via the allometric equation RH = H × (100/G)0.55 determined from data across all species | Stem growth vs investment in secondary growth or thick bark etc. Tall or lanky vs stout or corky (Dantas and Pausas 2013) | |
Stem traits | |||
Stem sapwood density (SD) | Measured as dry mass (g) of an approximately 1 cm diameter × 10 cm long section of twig divided by fresh volume (mL) measured using the displacement method | Stem growth vs defence, or cavitation resistance (Chave et al. 2009) Resistance to competition (Kunstler et al. 2016) | |
Relative bark thickness (RBT) | Bark thickness (BT) on individual trees was measured in mm using a bark thickness gauge 5 times at breast height along with girth. Relative Bark Thickness at 100 cm girth was calculated according to the allometric equation: RBT = BT × (100/G)0.52 determined from data across all species | Stem growth vs defence, especially surface fire, likely associated with epicormic sprouting (Lawes et al. 2013) Lanky vs stout (Pausas 2015) | |
Leaf traits | |||
Specific leaf area (SLA) | Area of fresh leaf (mm2) including petiole divided by dry mass (mg) after oven drying at 60–70°C for 72 h | Photosynthetic assimilation vs leaf longevity (i.e. leaf economics spectrum) (Westoby et al. 2002; Wright et al. 2004) | |
Leaf area (LA) | Area of a single fresh leaf including petiole (cm2) measured with leaf area meter | Light interception, heat balance (Wright et al. 2017) | |
Leaf mass (LM) | Mass (g) of a single leaf including petiole after oven drying at 60–70°C for 72 h | Coordination of leaf size and support from twigs (Corner 1949) | |
Reproductive traits | |||
Fruit wall width (FWW) | Minimum thickness (mm) of outer layer of fruit below valves | Protection of seeds from heat of fire; seed reproduction prioritised vs vegetative reproduction (Murray and Gill 2001) | |
Fruit mass (FM) | Mass of single fruit found by averaging mass of five replicate empty fruits (mg) weighed simultaneously | Fruit size scales with and constrains seed size, also seed protection (Lord and Westoby 2006) Coordination with supporting twigs (Corner 1949). | |
Seed mass (SM) | Average seed mass found by dividing total mass of 10 seeds (mg) weighed simultaneously | Tolerance–fecundity trade-off (Moles and Westoby 2006; Muller-Landau 2010) Persistence of seedlings in adverse conditions vs dispersal to more locations | |
Fire response | Field observation of individuals of different ages in wild populations found in Nicolle’s survey (Nicolle 2006) or other sources (see Table S2.3) | Ability and mode of resprouting in response to fire (Clarke et al. 2013) Lignotuber/basal-only resprouter, Combination resprouter, or Obligate Seeder (Nicolle 2006) Persistence vs investment in future generations (Bellingham and Sparrow 2000) | |
Analyses of traits, their interrelations, and trait–environment relations across extant species reflect species’ competence in current environments (Westoby and Wright 2006). That is, the observed trait combinations enable a plant species to make a living in the present-day ecological milieu. We have previously demonstrated the use of traits to explain and predict eucalypt species distributions along environmental gradients (Pollock et al. 2012, 2018; Vesk et al. 2021). However, studying the evolution of traits through phylogeny (i.e. ‘tree-based’ thinking) offers opportunities to gauge the generality of inferences across clades, especially important when studying closely related taxa. In Eucalyptus, many traits differ notably between subgenera, for example: traits related to resistance to herbivory and pathogens, hydraulics, nutrient usage, as well as tolerance of flooding and salinity (Noble 1989; Hill et al. 2001). In contrast, the structure of epicormic strands is thought to be relatively uniform across the eucalypt genera Angophora, Corymbia and Eucalyptus (Burrows 2013) and yet other traits may vary equally within all clades. Shared ancestry may influence contemporary relationships between traits; if related taxa are similar in multiple traits, they are likely to have inherited their trait combinations rather than represent independent occasions where trait combinations evolved (Felsenstein 1985; Grafen 1989). Accounting for the varying degrees to which traits show such phylogenetic patterns, termed phylogenetic signal (Münkemüller et al. 2012), allows more accurate estimates of correlated evolution of traits (Rohle 2006). By correlated evolution we mean the pattern of changes in two traits across divergences throughout a phylogenetic tree being correlated. For instance, across divergences in a phylogeny, where one lineage shifts to lighter seeds, does it also (on average) shift to shorter maximum height? When studying taxa like the eucalypts that include some prolific lineages, functional relationships across the tips of the phylogeny will tend to reflect those prolific lineages. Such patterns may or may not generalise across other taxa. Investigating phylogenetic signal can reveal the extent to which functional relationships observed among extant/contemporary taxa may be driven by small numbers of prolific lineages. Further, the relationships that are estimated when accounting for phylogeny may be expected to have more generality across taxa. To further the understanding of eucalypts, their functioning and the role of phylogenetic signal, we collected and analysed a dataset of southern Australian eucalypts comprising ~20% of all eucalypt taxa to:
Examine relationships among 11 functional traits (Table 1) encompassing stature, stem, leaf and regeneration aspects of plant ecological strategy, using pairwise correlations and network analyses.
Examine the phylogenetic signal within each of these traits.
Determine how the shared ancestry of taxa affects these trait–trait relationships, thus allowing us to identify which traits displayed correlated evolution, providing strong evidence for general functional trade-offs.
Materials and methods
Study taxa and traits
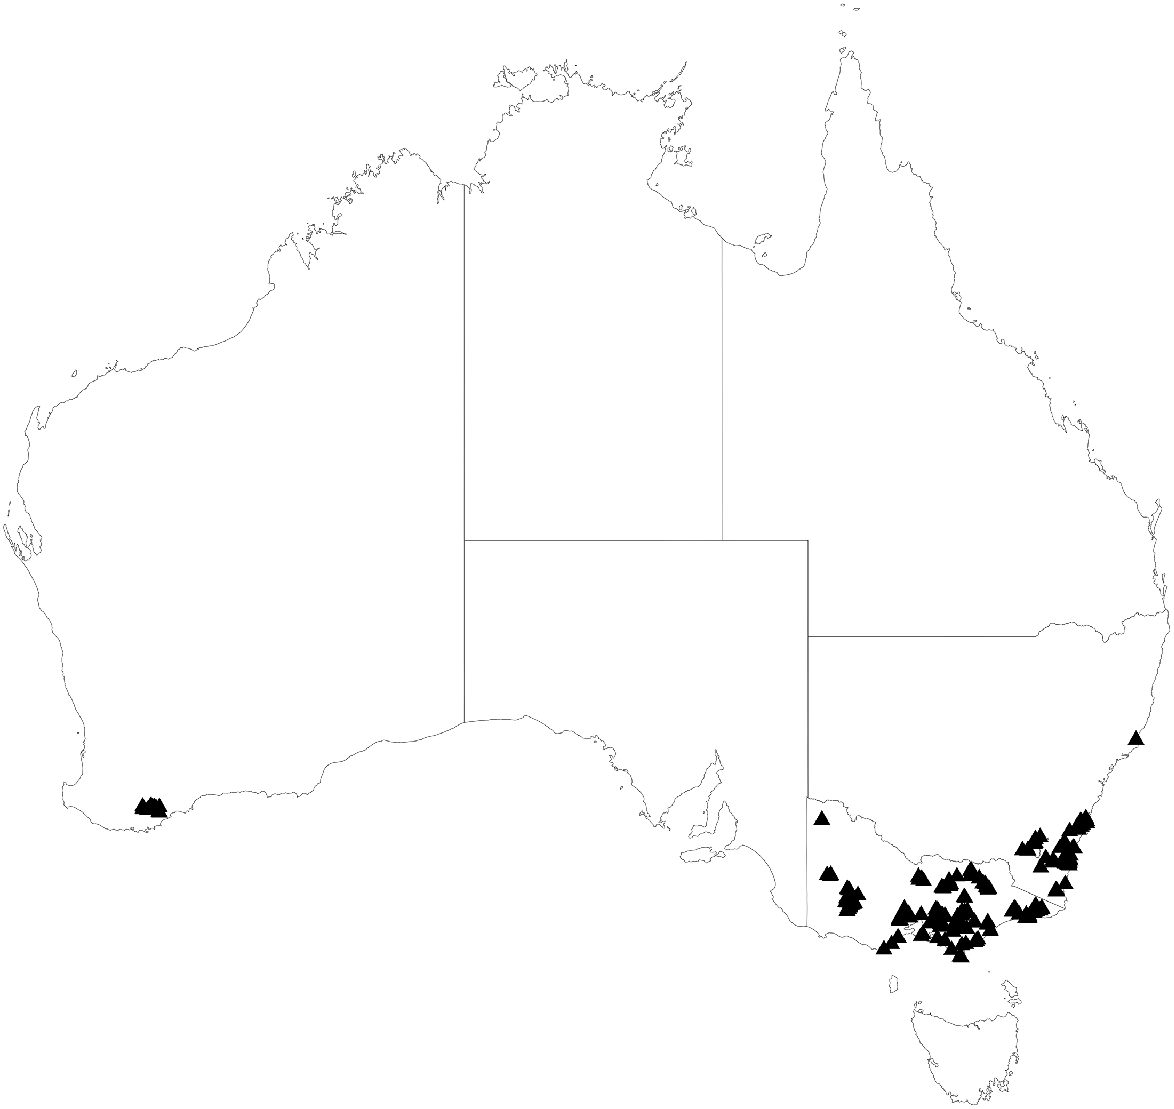
Traits were primarily measured on field surveys and collections by the authors and others over several years associated with distinct campaigns (Pollock et al. 2012, 2018; Vesk et al. 2021; Vesk et al. unpubl. data). For this study, we used a subset of this dataset, including measurements from 1942 trees across 164 eucalypt taxa, following Brooker (2000) and Nicolle (2019), including Angophora (2 taxa), Corymbia (5 taxa) and Eucalyptus (157 taxa), along with two other Myrtaceae tree species important in the south-eastern forests, Lophostemon confertus and Syncarpia glomulifera subsp. glomulifera. These were collected predominantly around the southern Great Dividing Range in south-eastern Australia, but also included smaller collections in the Gariwerd Grampians, Millewa Mallee region, and Koi Kyenunu-ruff Stirling National Park in Western Australia (Fig. 1). This included several regions of high species richness and endemism for the genus Eucalyptus and mostly corresponds to the alpine and mainland subregions within the South-east bioregion defined by González-Orozco et al. (2014), though some samples also fall into the South-west bioregion.
Collecting locations for samples of 164 eucalypt taxa for which we collected trait data. Regions sampled include alpine, mallee and coastal environments as well as regions of species richness and endemism in South-western WA, Gariwerd Grampians and South-Eastern NSW.
Sampled traits included those in the Leaf-Height-Seed scheme (Westoby 1998) but extended to associated traits for each of these strategy axes including leaf size, bark thickness, fruit mass and fruit wall width, wood density and stature. Details on trait measurement or extraction can be found in Table 1 and, although this was predominantly consistent across collecting campaigns, fruit wall width data were not available for 14 taxa collected in the Millewa Mallee region. Some fruit and seed masses for the Millewa Mallee also were made from herbarium material (Pollock et al. 2018). Relative height, relative bark thickness, stem density and fruit wall width data were also not available for some 11 taxa sampled exclusively in the Millewa Mallee region. The remaining traits were measured in almost all taxa. We added Maximum Height based on values extracted from the EUCLID database (Slee et al. 2015).
For all continuous traits, we characterised each taxon with trait medians, first taking the median by individual tree and then by taxon. Where taxa in the trait dataset were not resolved to subspecies level, we did so by reference to distribution information (Western Australian Herbarium 1998; VicFlora 2021). We calculated the median maximum height of all subspecies. The remaining six taxa were assigned maximum heights based on that of their closest relatives or other databases such as the current accessible EUCLID website (Slee et al. 2015) or local flora databases such as Florabase and VicFlora (Western Australian Herbarium 1998; VicFlora 2021). A list of the taxa for which maximum height was inferred and a more detailed description of how this was done in each case can be found in Supplementary Table S1. To aid in comparison, all trait data were log-transformed, mean-centred and scaled by dividing by one standard deviation prior to analysis.
Fire-response strategies were added for each taxon designating it either an obligate seeder, lignotuber-only (or basal-only) resprouter, stem-only (epicormic only) resprouter, or combination (basal and epicormic) resprouter based upon the definitions and census conducted by Nicolle (2006). Eleven taxa identified by Nicolle to be resprouters of ‘Variable’ type, were included within the combination resprouter category. To include relationships between fire response strategy and other traits in our network analysis, we also defined basal-only resprouting (BOS) behaviour as a binary variable with basal-only resprouters coded as 1 and species known to exhibit other strategies combined and coded as 0. Before scaling to match the variance of the other variables, the mean and standard deviation were 0.25 and 0.43, respectively. We believe this dichotomy was the most useful among fire response strategies due to preliminary data showing that basal-only resprouters had the greatest difference in their traits compared to the remaining categories (see Fig. S2) and our dataset contained enough species exhibiting these strategies to have reasonable statistical power. Further discussion and the full justification of fire-response categorisation is in Supplement 2.
Phylogenetic tree
Calculation of phylogenetic signal requires a phylogenetic tree of all taxa with included trait data to measure genetic distance between them. We constructed a phylogenetic tree from several published phylogenies, supplemented with taxonomic information. We used a recent phylogeny of the eucalypts based on Bayesian analysis of both nuclear (internal and external transcribed spacer, ITS and ETS) and plastid (matK and psbA-trnH) DNA regions, and which included many of the taxa in our trait data set (Thornhill et al. 2019). We note that the tree of Thornhill et al. (2019) (their fig. 4) was forced by their methodology to be fully resolved and not all nodes would have had character support. We accessed the tree associated with the Thornhill et al. (2019) paper from Knerr and Thornhill (2019), pruned this tree to the taxa from our trait dataset or their closest relatives (159 taxa in total), and combined it with a smaller (39 taxa), but well-supported, chloroplast-DNA phylogeny (Bayly et al. 2013) in order to confer greater statistical support to deeper divergences. Before the trees were combined, taxon names were verified against the Australian Plant Census (Council of Heads of Australasian Herbaria 2021) and branch lengths removed to avoid inconsistencies between different sources, as root depths were different. We then merged the two phylogenies using supertree methods (implemented with R package phangorn; Schliep 2011; R Core Team 2021) using Matrix Representation Parsimony (Baum 1992; Ragan 1992). To avoid the effects of random resolution of polytomies in the output supertrees (either originating from inherent phylogenetic uncertainty within the input trees or from regions of disagreement between them) we ran the supertree function 100 times and used the strict consensus (with ape package; Paradis and Schliep 2019), which was considered the most conservative approach.
We assumed species to be monophyletic for the purposes of positioning taxa, and so, although only 113 taxa in the trait dataset had an exact representative in either input tree, 43 taxa could be positioned on the final tree based on the position of members of the same species or by identifying orthographic variants. When the trait dataset and phylogeny used names that were not both resolved down to subspecies level, we used other subspecies or the species name to position these taxa. We positioned the remaining 13 taxa on the tree based on the positions of their proposed closest relatives. Although various phylogenetic and taxonomic sources disagreed considerably about which taxa were closest relatives, testing taxa with the most extreme trait values in different potential positions revealed only a marginal effect on phylogenetic signal compared to its uncertainty (see Table S3.1). Hence, even large uncertainty in taxon positions is unlikely to significantly affect results. Where closest relatives were determined using other published phylogenies (Jones et al. 2016; Fahey et al. 2022), only the sections of those phylogenies that were not yet resolved by previous methods (i.e. the immediate sister taxa to those of interest) were considered. Any disagreements these other phylogenies had regarding the relative positions of other taxa we had already resolved were ignored. More detail on the justification of the position of each such taxon can be found in Table S3.2 along with any other taxa whose position was similarly inferred.
Trait data for four taxa were ultimately excluded from this analysis due to a lack of phylogenetic information to position them on the tree, resulting in a final dataset of 164 taxa (Supplement 4). Finally, to enable computation of phylogenetic distance, we recalculated branch lengths for the resulting tree using the ‘Grafen’ method (Grafen 1989), which allows branch length calculation for purely topological trees. The final version of the tree used in this analysis can be found in Fig. S5.
Statistical analysis
We estimated phylogenetic signal for each continuous trait using Pagel’s Lambda (λ) (Pagel 1999), estimated with maximum likelihood (caper package; Orme et al. 2018). Lambda is a scaling factor for the off-diagonal elements of the variance–covariance matrix constructed from the genetic distances between each of the taxa on the phylogeny, relative to the root-to-tip distance. It is a measure of the degree to which the actual covariance structure of the residuals in the model match this expected phylogenetic covariance structure. It varies between 0 and 1, where 0 indicates traits are distributed independently of phylogeny and 1 represents trait values distributed across the tree exactly as expected from Brownian evolution along the lineages. Pagel’s Lambda is robust to phylogenetic uncertainty (i.e. polytomies) and incomplete branch length information (Münkemüller et al. 2012; Molina-Venegas and Rodríguez 2017) and is therefore suitable for this analysis. We also further tested each lambda value to determine if it was significantly different from zero or one.
To quantify the cross-species relationships between traits, we fit Ordinary Least Squares regression models for each combination of pairwise comparisons between each of the 11 traits including the binary BOS variable (‘lm’ function stats package; R Core Team 2021). This was to ensure our measure of correlation strength remained comparable to subsequent regression-based correlation strength estimates from phylogenetically-informed analyses. We used the square root of the coefficient of determination output by the regression models (±√r2) to quantify correlation strength. The difference between the r-values calculated this way for each fitted model compared with the corresponding Pearson’s r were generally negligible, with 40/55 models showing differences of less than 0.05 in magnitude (mean 0.037 and median 0.033). We then visualised the resulting relationships as a network diagram using the R package qgraph (Epskamp et al. 2012), which uses r-values to construct a force-embedded diagram whereby nodes that are more closely related are placed closer together. We restricted the displays to moderate correlations, with |r| > 0.3, to aid visualisation. Note, this is very conservative, equating to P < 0.0004 for the sample sizes for each regression model for each pairwise comparison, which ranged from 150 to 163. We also corrected for multiple comparisons using a Holm adjustment (Holm 1979) for P-values of all models shown in the networks. Several models with P < 0.0004 had adjusted P-values above this, though they were all below 0.05. Hence, we focus on biologically important relationships, following the guidelines from Cohen (1988) of weak (|r| < 0.3), moderate (0.3 > |r| > 0.7) and strong (|r| ≥ 0.7).
To compare traits among fire responses, we used similar regression models. We first compared obligate seeders to all resprouters together, then contrasted obligate seeders to each of the other resprouting categories individually, and finally compared combination resprouters (those that can resprout both basally and epicormically) with lignotuber-only/basal-only resprouters to get the most complete picture of the relative positions of each of these three categories on each of the trait spectra. Although stem-only resprouters were present in our dataset, only four species demonstrated this strategy and hence were excluded from this section of the analysis.
For our phylogenetic analyses, we used Phylogenetic Generalised Least Squares models (Grafen 1989), a variation of generalised linear models that uses phylogenetic distance between taxa to determine the expected error structure of the data and produce phylogenetically-informed estimates of correlation. We fit pairwise Phylogenetic Generalised Least Squares models (with caper package; Orme et al. 2018) for each of the relationships between pairs of traits to determine relationships and compare with the cross-species regression models.
For each model, a Pagel’s lambda value for the covariance matrix of the residuals was estimated via maximum likelihood along with the remaining regression parameters.
We then visualised these relationships using the same force-embedded network diagram described for the cross-species analysis. The lambda value calculated for and used in the model varied significantly depending on which trait was treated as the dependent or independent variable, so we used the model with the highest phylogenetic signal of the two in the network. Being a subset of generalised least squares models and as such having no way to calculate a comparable coefficient of determination to those of ordinary least squares models, a ‘pseudo r-squared’ value was estimated by comparing the model to a null intercept-only model with the same covariance matrix (i.e. given the same lambda value and covariance matrix calculated for the bivariate model instead of what it would be for a true intercept-only model).
Phylogenetic models were also then used to examine the differences in trait values between the different fire-response categories to compare the results to the similar cross-species analysis. Obligate seeders were again compared to resprouters as a whole and then separately to each resprouter category, after which the combination sprouters were then also compared to lignotuber/basal-only resprouters.
All data manipulation and analyses were conducted within the R statistical computing environment (R Core Team 2021). All the code to reproduce our analyses and results can be found on GitHub at http://www.github.com/EucTraitEcology/euc_phylo_traits.
Results
Traits varied considerably in their ranges across eucalypt species (Fig. 2). The most variable traits included Seed Mass (500-fold) and Fruit Mass (200-fold), Leaf Area and Relative Bark Thickness (nearly 40-fold), and Seed Mass, Leaf Mass, and Maximum Height (30-fold). The least variable trait was Stem Density, which varied roughly 1.5-fold. Specific Leaf Area showed five-fold variation, similar to Relative Height.
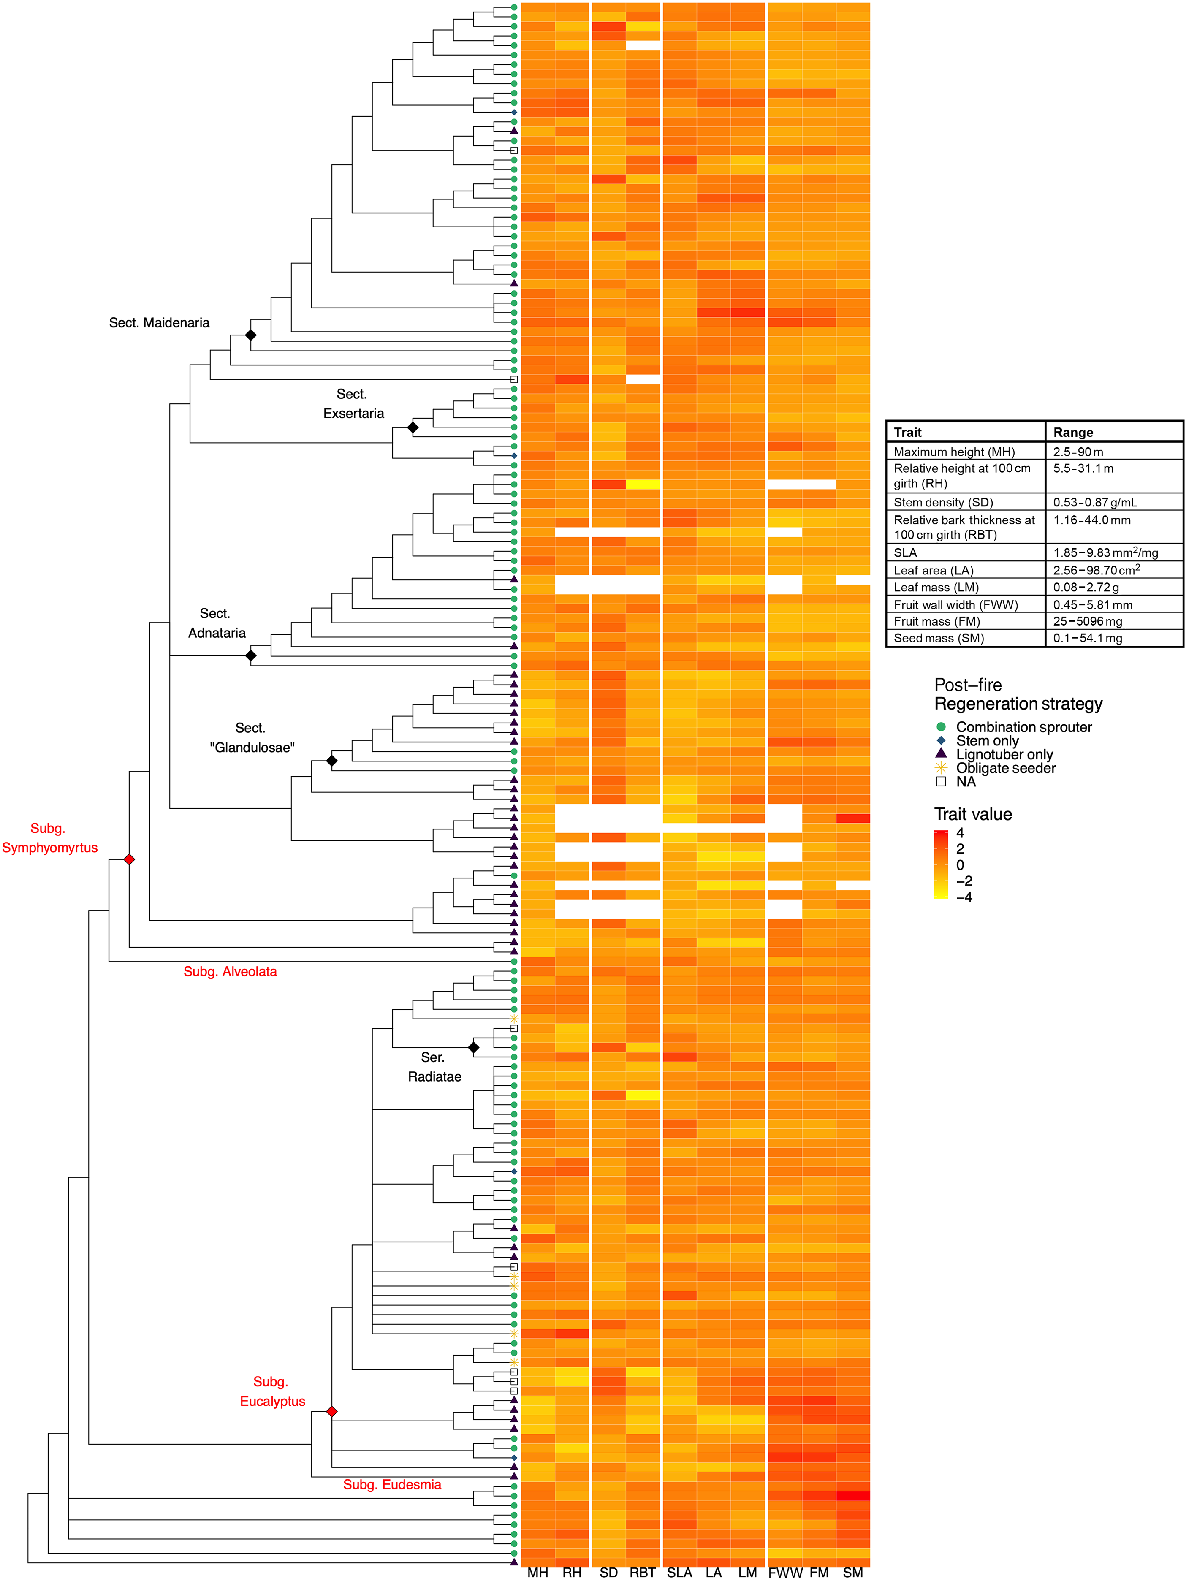
Distribution of 10 continuous traits and fire-response category across a phylogeny of 164 eucalypt taxa. Abbreviations follow Table 1. Trait values have been log-transformed and scaled for comparison in the heatmap and the Table displays untransformed trait ranges. For inclusion of taxon labels see Fig. S6. Some subgenera, following Nicolle (2019), are indicated in red font and diamonds, and some lower taxonomic levels in black font and diamonds.
Effect of phylogeny on individual traits
A summary of the scaled trait values for continuous traits and fire-response categories and how they are distributed across the phylogeny is presented in Fig. 2. Being a primarily molecular phylogeny, many taxonomic groups delineated within well-known classifications were not preserved. Yet, many groups such as genera Angophora and Corymbia, all subgenera of Eucalyptus, and various sections within subgenus Symphyomyrtus (Brooker 2000) could still be recognised. The genera Corymbia and Angophora could be seen with characteristically large, heavy fruits and seeds along with our single eudesmid (E. subgenus EudesmiaBrooker 2000), Eucalyptus pleurocarpa, and the other basal monocalypts (Eucalyptus subgenus EucalyptusBrooker 2000). Early diverging monocalypts (mainly Eucalyptus Sect. Longistylus Brooker 2000) generally had lower values for Maximum Height, Specific Leaf Area, Relative Bark Thickness, Relative Height, Leaf Area and Leaf Mass along with greater values of Stem Sapwood Density. A similar phenomenon was noted within the symphyomyrts (E. subgenus Symphyomyrtus), where section Dumaria (Brooker 2000) and section Bisectae (Brooker 2000) had similar clustering of basal-only resprouting coupled with lower values of Maximum Height, Specific Leaf Area, Leaf Area, Relative Bark Thickness and Relative Height, and higher values of Stem Density. There were only five obligate seeders in our dataset, all of which are monocalypts, not resolved as closely related in the phylogeny, and also classified in different sections. Most taxa were combination resprouters, with basal-resprouting taxa nested within the same clades.
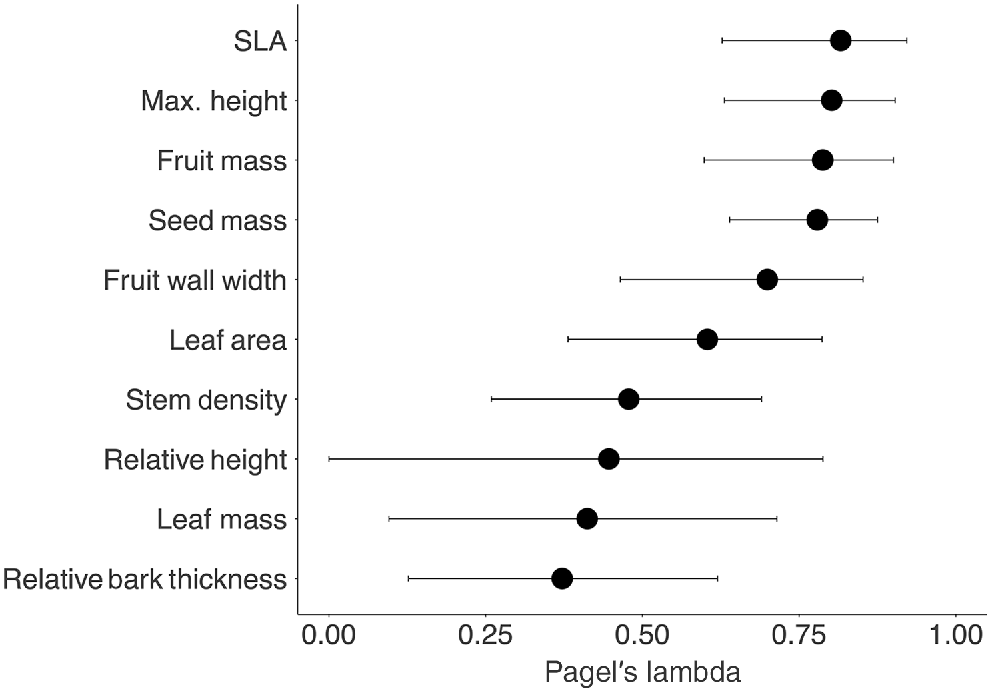
Closely related eucalypt taxa tended to have similar trait values, but to varying degrees. Phylogenetic signal for each of the ten continuous traits (i.e. excluding fire response) ranged from weak in the case of Relative Bark Thickness (λ = 0.37), Leaf Mass (λ = 0.41) and Relative Height (λ = 0.45) to moderately strong for Specific Leaf Area (λ = 0.82) and Maximum Height (λ = 0.80) (Fig. 3). An entirely Brownian model of trait evolution, whereby present-day trait values could be correlated perfectly to ancestry, was rejected for all traits (λ < 1, P < 0.0001). For all traits except Relative Height, we could reject an absence of phylogenetic signal (H0: λ = 0, P < 0.05).
Trait relationships
Overall, we found evidence for considerable coordination among traits. No traits were entirely independent – all traits correlated with at least one other trait with at least moderate strength |r| > 0.3 in both cross-species and phylogenetic analyses. Strengths of relationships varied widely (r2: <0.001–0.82) and effect sizes (slope magnitudes) ranged from 0.04 to 0.908 for cross-species analyses and from 0.009 to 1.03 for phylogenetic analyses respectively. Stronger relationships had larger effect sizes (slopes closer to one). Phylogenetic signal in trait relationships varied considerably (λ = 0.000001–0.864) even between models with the same dependent variable. A full summary of all regression coefficients for all trait relationships along with a matrix plot of correlation strength is available in Supplement 7.
Correlation networks (Fig. 4) displayed the number and strength of correlations between traits of at least moderate strength with thicker lines for stronger relationships and the position of the trait reflecting the overall strength of all correlations. Correlation networks showed several similarities in the trait relationships found using cross-species analyses (Fig. 4a) and those using phylogenetic analyses (Fig. 4b). Specific Leaf Area was consistently a hub in the networks, being the most, or among the most, connected traits, showing eight (of 10 possible) moderate correlations in the cross-species analyses (Fig. 4a). Resprouting mode was coordinated with each of leaf, stem and stature traits, indicating the importance of fire response to ecological strategies of eucalypts.
Trait network diagrams of bivariate correlations among eucalypts summarising (a) cross-species correlations and (b) phylogenetic correlations. Network diagrams represent traits as nodes in a network connected by lines (or arcs) of correlations. Stronger correlations appear as thicker lines and shorter distances between traits. The pattern in the network reflects the overall strength of correlations among all traits. So traits with more, stronger correlations with other traits appear connected by more lines and close to other traits. Hence traits that may be considered ‘hubs’, appear near the centre of the network, connected by lines to multiple traits, e.g. specific leaf area. Traits with weaker and/or fewer correlations appear at the edges of the network. Here, line thickness = ±√r2 from regression models, henceforth referred to as r. To aid visualisation, only correlations with |r| > 0.3 are displayed in the network (adjusted P < 0.05), though position of traits is preserved. Abbreviations follow Table 1. Sample sizes for each regression model for each pairwise comparison ranged from 136 to 159. Note that |r| is not comparable across networks, only within a given network.
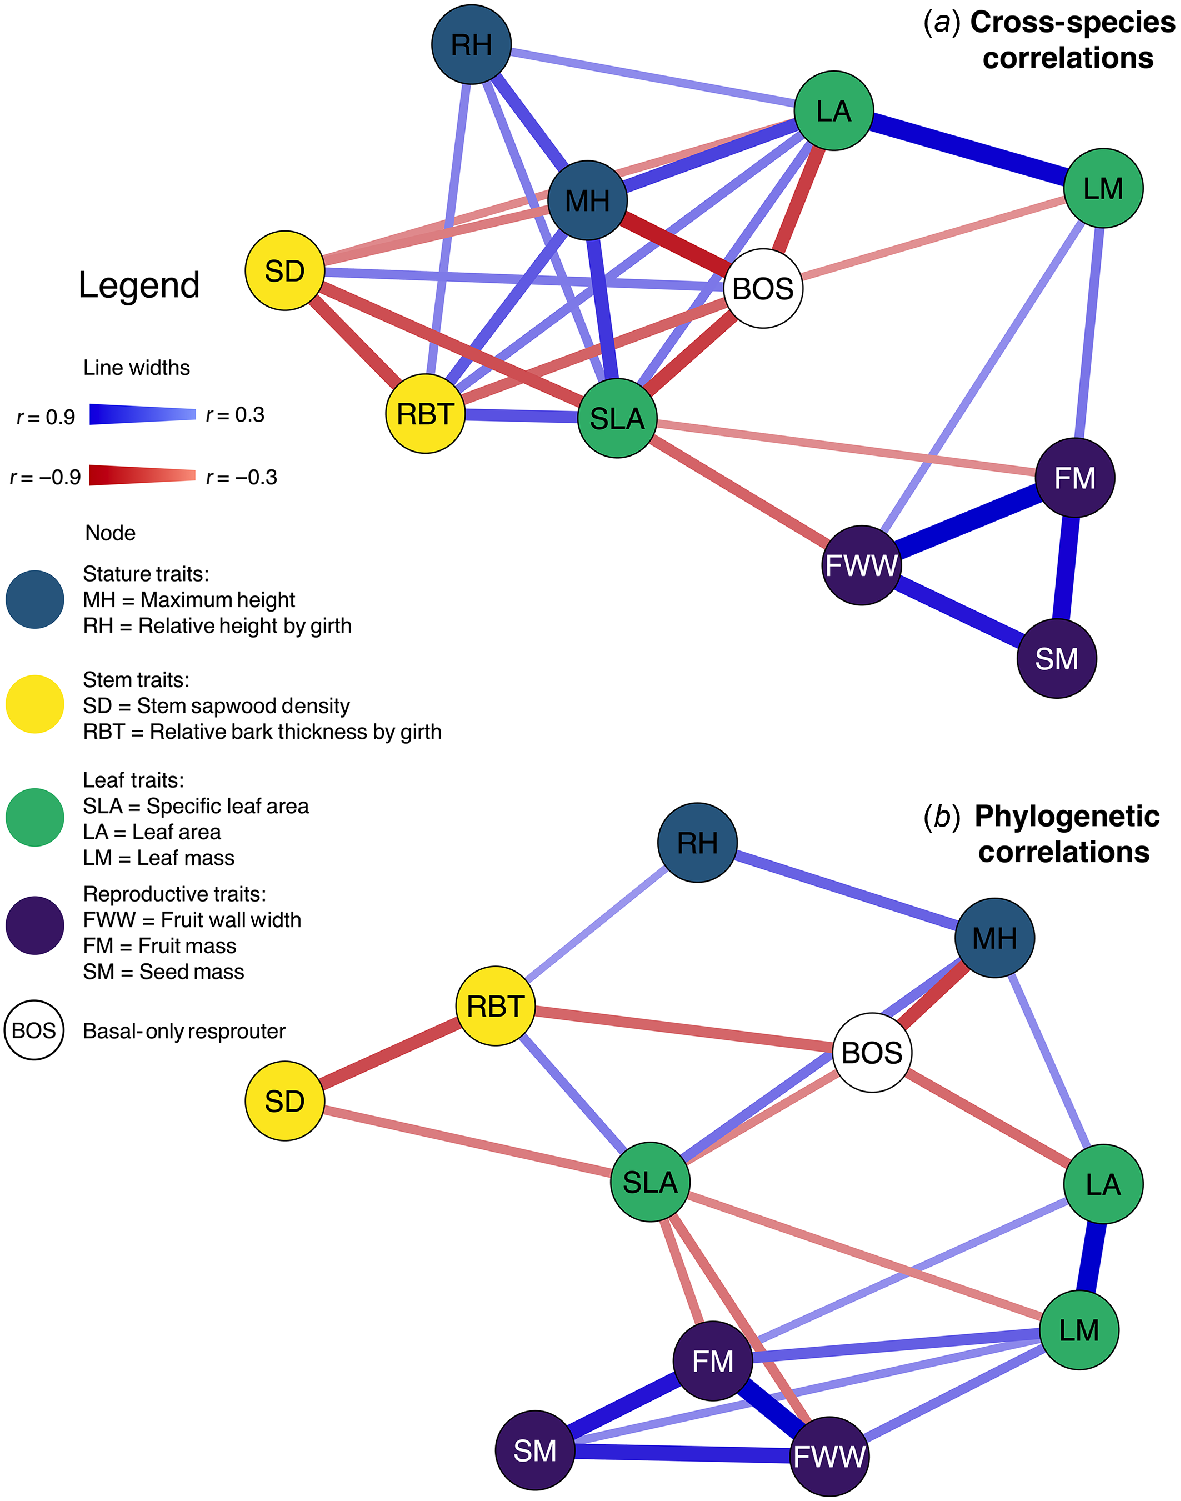
Both networks displayed a general pattern of stem and stature traits (Maximum Height, Relative Height, Stem Density mostly) being positioned on the opposite side of the network to the reproductive traits (Fruit Wall Width, Fruit Mass and Seed Mass) with leaf traits linking the two. This opposition reflects that not only are the stem and stature traits not correlated with reproductive traits, but the patterns of correlation that they each show with the leaf traits differ between those two trait groups. The reproductive traits, Fruit Wall Width, Fruit Mass and Seed Mass showed the greatest correlations (0.7 < r < 0.9) among traits reflecting physical constraints: to make big seeds or to have thick fruit walls, requires larger fruits. Unsurprisingly, Leaf Area and Leaf Mass were also consistently strongly correlated (r > 0.85), being two measures of leaf size. Being connected to the fewest traits, Seed Mass was at the outside in the cross-species networks, and Relative Height and Stem Density were least correlated with other traits in the phylogenetic network. However, all three traits consistently appeared in relatively peripheral positions on both networks, regardless of their number of connections. Full network diagrams for both analyses, showing either all relationships or only those statistically significant, are in Fig. S8.
Although networks of trait relationships were generally consistent between cross-species and phylogenetic methods, they differed in detail. The network based on phylogenetic analyses generally had fewer connections (Fig. 4) and weaker pairwise trait correlations (based on effect size and correlation strength) than the cross-species network (Fig. 5). Relationships between stem, stature and leaf traits, reflecting taller trees being lanky with thick bark and big leaves but low stem density, were particularly weakened in phylogenetic analyses, resulting in a less pronounced trait cluster. The connectedness of Specific Leaf Area became even more apparent in the phylogenetic network as other trait relationships weakened.
Difference in effect strength (indicated by the colour scale) between the cross-species and phylogenetic regressions (|phylogenetic slope| – |cross-species slope|) for each model testing a possible trait pair. The triangle icon on a model indicates a change in effect size that accompanied a change in statistical significance (P > or < 0.05). Note, the phylogenetic models used here for each pair of traits were those that generated the highest lambda value of the two options of assigning dependent and independent variables (see Table S7.2). Trait abbreviations follow Table 1.
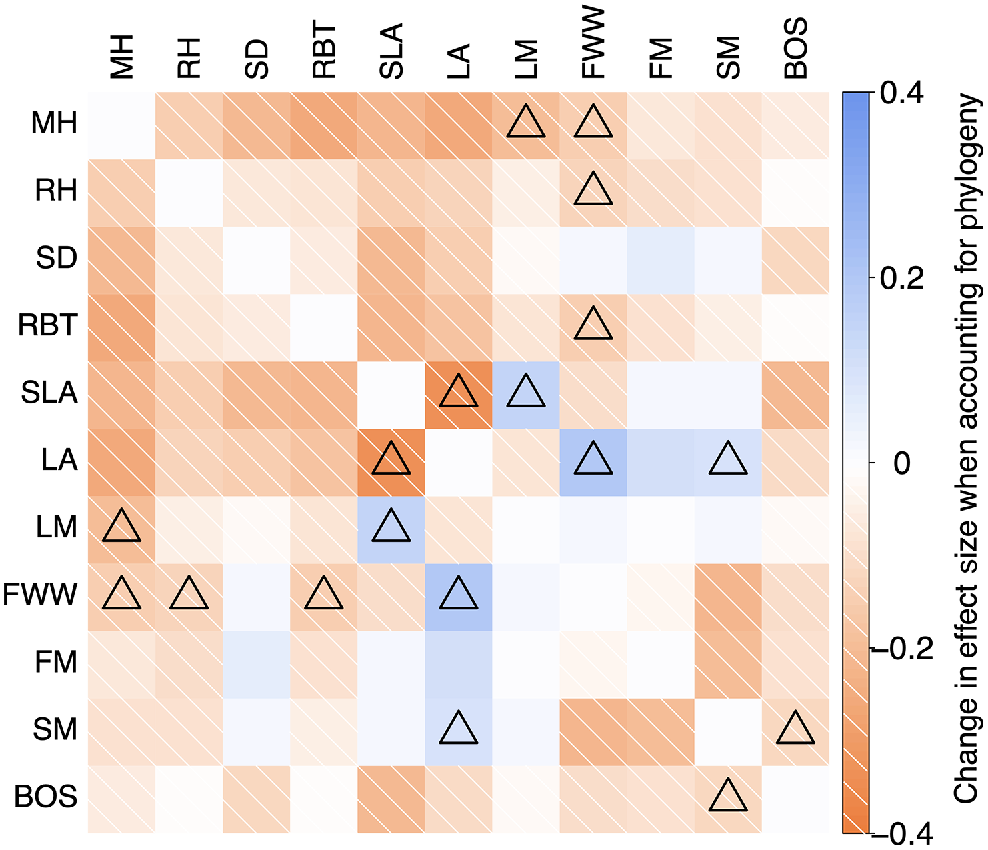
Although stronger and more numerous moderate relationships (|r| > 0.3) emerged in the cross-species analysis, the relationships between leaf traits (Specific Leaf Area, Leaf Area, and Leaf Mass) and reproductive traits (Fruit Wall Width, Fruit Mass, and Seed Mass) had stronger effects when measured using phylogenetic analyses (Fig. 5). Five (of all possible 55) trait–trait correlations were no longer significant (P > 0.05) with phylogenetic analyses, whereas three became significant with phylogenetic analyses. This can also be seen in the networks (Fig. 4) where the stem, stature and leaf traits became farther apart and more sparsely correlated, whereas leaf size traits appear much closer to the reproductive trait cluster and positive correlations between Leaf Mass and Seed Mass as well as Leaf Area and Fruit Mass exceeded r = 0.3.
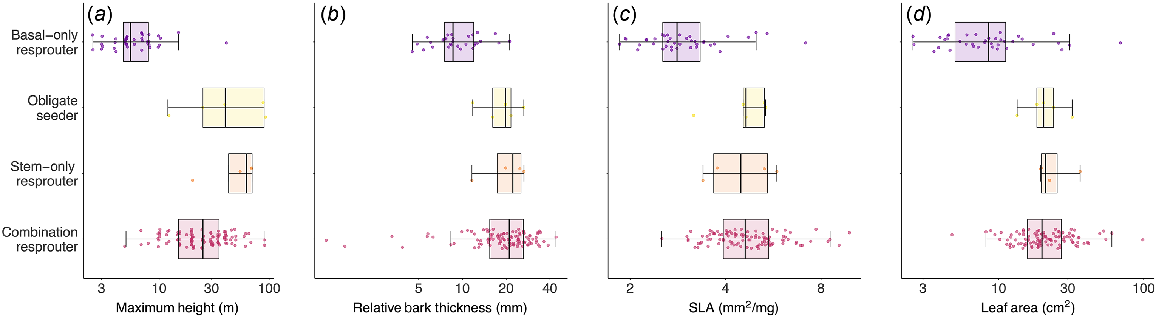
Post-fire regeneration strategies overlapped in trait values, although some notable differences were found especially in stem and leaf traits (Fig. 6) and most of these results were similar between the cross-species and phylogenetic analyses. Obligate seeders tended to fall within the trait ranges of the combination resprouters and were few, so we focus on the resprouters here. Supplementary results and discussion relating to obligate seeders and their traits can be found in Supplement 9. On average, basal-only resprouters differed significantly from combination resprouters; they were shorter (Maximum Height −1.62 ± 0.12 (cross-species effect size ± s.e.); −1.52 ± 0.16 (phylogenetic effect size ± s.e.)), more stout (Relative Height −0.38 ± 0.18; −0.38 ± 0.18), with denser wood (Stem Density 0.89 ± 0.18; 0.65 ± 0.21), thinner bark (Relative Bark Thickness −1.12 ± 0.18; −1.12 ± 0.18), smaller leaves (Leaf Area −1.40 ± 0.15; −1.15 ± 0.19), which were thicker and denser (Specific Leaf Area −1.41 ± 0.15; −0.91 ± 0.19), and lighter (Leaf Mass −0.74 ± 0.18; −0.71 ± 0.21), with thicker fruit walls (Fruit Wall Width 0.76 ± 0.19; 0.54 ± 0.23) in both analyses. The greatest differences between basal-only resprouters and combination resprouters and those where fire response explained the most trait variation, were that basal-only resprouters were shorter (Maximum Height: cross-species r2 = 0.56; phylogenetic r2 = 0.40), had lower Specific Leaf Area (0.37; 0.14), had smaller leaves (Leaf Area: 0.36; 0.20), and thicker bark (Relative Bark Thickness: 0.23; 0.22) (Fig. 6).
Boxplots with data plotted traits showing greatest differences between basal-only and combination resprouters. Distribution shown of (a) Maximum Height, (b) Relative Bark Thickness, (c) Specific Leaf Area, and (d) Fruit Wall Width within obligate seeders, basal-only resprouters, and combination resprouters for 151 eucalypt taxa for which fire-response data was available. Note, though scaled data was used for analysis, the x-axis labels are on the original scale. Whiskers extend from interquartile range (IQR) to the largest value no further than 1.5 times the IQR.
Most trait differences between post-fire regeneration strategies weakened when phylogenetic analysis was used, though without crossing the threshold of P = 0.05. Only in the cross-species analysis did basal-resprouters also have significantly, though weakly, heavier seeds (0.42 ± 0.19) than combination resprouters. This difference was found to be non-significant in the phylogenetic analysis. The full summary of plots showing the distribution of each trait within each fire-response category can be found in Fig. S2.
Discussion
This study examined integrated functional relationships within eucalypts, predominantly genus Eucalyptus in southern Australia, demonstrating the usefulness of network methods that include trait–trait relationships across multiple organs and functions. Our results suggest reproductive traits (Fruit Wall Width, Fruit Mass, and Seed Mass) are strongly correlated with each other, with leaf traits (Specific Leaf Area, Leaf Area) linking them to a loose cluster of stem and stature traits (Stem Density, Relative Bark Thickness, Maximum Height and Relative Height respectively). Many relationships (e.g. Maximum Height–Leaf Area, Leaf Area–Specific Leaf Area, Specific Leaf Area–Stem Density, Leaf Area–Stem Density), though not all (e.g. Seed Mass–Maximum Height, Seed Mass–Specific Leaf Area), were consistent with those measured elsewhere in global datasets (Díaz et al. 2016; Kleyer et al. 2019). Fire response strategies also were correlated with stem and fruit traits. Most traits differed considerably (often >1.5 fold) between basal-only and combination resprouters. Phylogenetic signal was variable across traits and shared ancestry generally resulted in amplified trait relationships among extant taxa, especially between stem and leaf traits. However, these phylogenetic effects were not uniform and rarely altered statistical significance of trait correlations. Despite strong phylogenetic signal on several individual traits and some trait–trait relationships bearing phylogenetic signal, the broad patterns of correlation among stem, leaf and reproductive traits were robust to phylogeny. Hence, traits strongly correlated among extant taxa likely represent correlated evolution throughout the eucalypts.
Broad trait relationships that were robust to phylogeny
Our results suggest that different dimensions of plant ecological strategy relate to one another and the whole plant does represent an integrated phenotype. Here we discuss those relationships that were detectable by both cross-species and phylogenetic analyses, indicating they are robust to phylogeny. We found strong coordination among reproductive structures, as expected considering that accessory costs of reproduction are known to scale proportionally with seed size (Henery and Westoby 2001; Lord and Westoby 2006). We also found strong coordination between both measures of leaf size and all fruit and seed traits. These associations support ‘Corner’s Rules’ in eucalypts (Corner 1949; Wright et al. 2007), suggesting taxa with twigs capable of bearing large, heavy leaves would also be able to have larger and more elaborate fruits. The robust position of Specific Leaf Area as a hub, highly connected to other traits throughout the phylogeny or across its tips, indicates the important role that the leaf economics spectrum (Wright et al. 2004) plays in multiple dimensions of variation within extant eucalypt taxa studied here and through their evolution.
We find that, compared to other analyses, Specific Leaf Area is a highly connected trait acting as a hub in our networks as well as relatively strongly correlated with other traits. Notably, Specific Leaf Area was positively correlated with Maximum Height and negatively with Stem Sapwood Density; these effects remained when considering evolutionary divergences. Compared to several studies in the Neotropics (Wright et al. 2007; Baraloto et al. 2010; Fortunel et al. 2012) and globally (Díaz et al. 2016; Flores-Moreno et al. 2019), we found stronger evidence that species of taller trees supported flimsier leaves and that species with more robust leaves had more dense stems. Why might this be? Two aspects of environment may contribute. Compared to the global climates, our sites do not experience strong seasonality, nor very low temperatures, where deciduousness becomes a profitable strategy. Neither is rainfall sufficiently seasonal to justify seasonal drought deciduousness, as is found in wet–dry tropics (Williams et al. 1997; Eamus et al. 1999). On the other hand, rainfall ranges widely across our sites (e.g. 325 mm mean annual rainfall at Murrayville in northwestern Victoria, to 1368 mm at Falls Creek in the Bogong High Plains of Victoria, data from http://www.bom.gov.au/climate/data/index.shtml). Possibly lower water availability drives a coordinated shift in each of lower Specific Leaf Area, higher Stem Density and shorter Maximum Height.
The commonly reported positive relationship between Maximum Height and Seed Mass (Moles et al. 2005; Wright et al. 2007; Díaz et al. 2016) did not appear in either the cross-species or phylogenetically-informed analysis in the eucalypts we studied. Murray and Gill (2001) found a negative correlation between height and fruit size, in a dataset primarily comprising southwestern WA eucalypts. It is possible that a complex interplay of aridity, nutrient poverty, fire frequency, fire severity, plant height, and recruitment dynamics has affected trait expression in the eucalypts (Murray and Gill 2001; Hopper 2021). Further investigation should help clarify what is driving this difference between eucalypts and other plant groups. Notably, this study is biased in sampling to south-eastern Australia. This bias is present in both the environments sampled, but also phylogeny. We have very few Corymbia, which are predominantly a northern Australian clade. Further work should endeavour to cover more species from northern and western Australia. We also note that our sampling of mallee growth form eucalypts strongly represents subgenus Symphyomyrtus section Bisectae (Brooker 2000) and Eucalyptus sect. Dumaria (L.D.Pryor & L.A.S.Johnson ex Brooker 2000), characteristic of dry regions, whereas those from subgenus Eucalyptus section Eucalyptus (Brooker 2000) characteristic of wetter regions, were less sampled.
Fire response strongly associated with traits and trait shifts through the phylogeny
Our results reveal that post-fire regeneration strategies and the functional traits of eucalypts are strongly intertwined. We focus on combination resprouters and basal-only resprouters and their traits and differences, with discussion of the few obligate seeders in Supplement 9. All patterns of traits differing between fire responses were robust to phylogeny, except the differences in fruit and seed mass of basal-only and combination resprouters. This suggests that differentiation between these fire-response categories in extant taxa is underlain by repeated correlated shifts in fire response and almost all traits.
Several traits were particularly strongly associated with fire responses. Aside from the few obligate seeding species (Supplement 9), our results support an interpretation that tall maximum height is benefitted by epicormic resprouting, distinctive among the eucalypts (Burrows 2013), whereas basal-only resprouting is associated with shorter maximum heights. This is likely because, at greater heights, the time difference to re-establish a canopy after fire by resprouting directly from an already-elevated trunk, compared with having to regrow the entire trunk from the ground, is much greater (Burrows 2013; Pausas and Keeley 2017). The multi-stemmed habit (mallee) common amongst basal-only resprouters also means that for the same investment in woody tissue, the maximum height of the whole plant must be shorter (Midgley 1996; Kruger et al. 1997). Basal-only resprouting needs no thick bark as the stems are regrown following fire, whereas epicormic resprouters (and obligate seeders) benefit from protective bark (Burrows 2002; Vesk and Westoby 2004a; Lawes et al. 2011, 2013; Clarke et al. 2013; Pausas 2015). This also provides a potential explanation for the tallest eucalypts, surprisingly, having the thickest bark overall, especially given the resource-intensive nature of maintaining thick bark as protection (Lawes et al. 2011, 2021; Pausas 2015). It is possible that such tall taxa compromise in other areas such as lower wood density. However, the link between tall species and thick bark may also be artefactual, given that bark thickness was only measured at a single height and many tall taxa (e.g. Eucalyptus regnans, Eucalyptus pilularis) have a ‘skirt’ of thick, rough bark at the base with much thinner bark above. This results in such tall species driving a positive correlation between Maximum Height and thick bark. How representative the thickness of the bark of the skirt is of bark on higher branches is unclear and would be valuable information.
It is worth noting that many of the traits most related to fire response are also known to vary along environmental gradients (Wright et al. 2005; Liu et al. 2019; Lawes et al. 2021) and many of our basal-only resprouters were sampled in more arid environments. This would reduce both Specific Leaf Area and Maximum Height and could account for some of the observed associations between these traits and fire responses. Although numerous studies relate traits to environment (e.g. Wright et al. 2005; Pollock et al. 2012; 2018) and other studies relate traits to fire-response (e.g. Pausas 2015; Lawes et al. 2021), we are not aware of work that does both simultaneously. Further work should aim to clarify the relative effects of fire response and environment on traits.
Traits displayed phylogenetic signal but with varied strength
Our results show that some traits are strongly related to patterns of heredity, but others are less so. The distributions of continuous traits across the phylogeny were also neither purely Brownian nor absent of any phylogenetic influence. Hence, although the evolution of these functional traits is most certainly affected by some form of selection pressure, ancestry remains an important factor driving many aspects of the functional ecology of extant Eucalyptus species.
Although phylogenetic signal for the categorical trait of resprouting could not be calculated, the uniformity of basal-only resprouting within certain lineages is notable, as broad studies across plant phylogeny have found that resprouting in the broad sense is an ancient trait and is labile across broader phylogenies (Vesk and Westoby 2004b; Pausas and Keeley 2014; Lawes et al. 2022). Epicormic resprouting in the eucalypts appears to have evolved from ancestors unable to resprout epicormically (see Crisp et al. 2011). One possible explanation is that the evolution of epicormic resprouting within the eucalypts and relatives presented by Crisp et al. (2011) refers to combination (i.e. epicormic and basal) resprouters, not epicormic resprouting only. Then, basal-only resprouting has repeatedly emerged after subsequent loss of epicormic resprouting ability while retaining basal-resprouting ability.
Highly conserved traits (Maximum Height, Specific Leaf Area, Seed Mass and Fruit Mass) indicated that the eucalypt taxa we studied had most similar maximum height, leaf economics strategies, and fruits and seeds to that of their ancestors and close relatives. Hence, related species are also more likely to have similar tendencies within ‘height growth’ strategies (Moles et al. 2009), leaf economics strategies (Wright et al. 2004), and seed and seedling provisioning strategies (Muller-Landau 2010). Although this does not necessarily indicate slow evolutionary rates for these traits (Ackerly 2009), it may indicate greater phylogenetic inertia (Felsenstein 1985) within these traits.
The associations of traits such as Maximum Height, Specific Leaf Area, and Seed Mass with environmental gradients have been the focus of numerous studies (in eucalypts see e.g. Schulze et al. 2006; Pollock et al. 2012, 2018; Liu et al. 2019). They reveal varied, and apparently scale-dependent patterns of association, with the climatic associations of height being the clearest (Moles 2018). If environment does influence the relative performance of different trait values, then we might expect strong environmental driving forces to overcome phylogenetic inertia more readily, resulting in relatively a weak phylogenetic signal. Yet, we observed strong phylogenetic signals in these traits (see also Ackerly 2004; Pollock et al. 2015). This may indicate that environmental trait optima themselves have phylogenetic signal (Hansen et al. 2008). Alternatively, adaptation may be overridden by community assembly via dispersal, abiotic and biotic filtering of taxa from a wider species pool (Keddy 1992), as has been shown to influence traits of co-occurring Eucalyptus taxa in Gariwerd Grampians (Pollock et al. 2015).
Furthermore, Leaf Mass and Relative Height, which had among the lowest phylogenetic signal, have not been especially associated with environmental gradients, relating more to allometry (Corner 1949) and perhaps light availability and adaptation to herbivory (Dantas and Pausas 2013) respectively. Bark thickness has been shown to be quite labile within species, likely related to fire regime (Lawes and Neumann 2022), which would accord with low phylogenetic signal. Variance partitioning analysis on a large subset of the taxa studied also suggests that Relative Height varied more within than between species (data not shown). Also, stature is well known to be plastic as the form of trees growing in open paddocks compared to dense plantings readily demonstrate. Hence, Relative Height may not be particularly stable for a given species and its use in cross-species studies may require greater intra-specific replication.
We also noted that traits with high phylogenetic signal were not necessarily correlated and the clades in which taxa had most similar trait values were sometimes different. This indicates that any phylogenetic inertia or lag on trait evolution imposed by phylogeny (Felsenstein 1985) was not specific to any one lineage and trait shifts likely occurred at different divergences in the tree.
Phylogenetic signal depends upon both the scale and accuracy of the phylogeny. Depending on the traits of other genera and families, our findings regarding relative degrees of phylogenetic signal of different traits may not apply at higher levels (Cornwell et al. 2014). Hence, the phylogenetic signal discussed here should be interpreted in the context of the eucalypt clade, and predominantly within Eucalyptus and its main subgenera and sections. All assessments of phylogenetic signal (and adjusted correlations depending on it) are also subject to phylogenetic uncertainty. The method by which the phylogeny was built assumed monophyly of species to place the most taxa on the tree. Monophyly may not be reasonable, especially given that different samples of the same eucalypt taxon collected at different locations can form a paraphyletic or even polyphyletic group (Jones et al. 2016). We also assumed bifurcating speciation and divergence, which does not consider the well-established ability of eucalypts to hybridise and undergo more reticulate modes of evolution (Griffin et al. 1988; Jackson et al. 1999; Pollock et al. 2013). We also combined two phylogenies (Bayly et al. 2013, Thornhill et al. 2019) to resolve deep divergences and only used a single tree from Thornhill et al.’s (2019) study and many of the relationships of sections and series within subg. Eucalyptus (Monocalypts), e.g. series Pachyphloia (stringybarks) appear spurious in light of longstanding morphological classification (Brooker 2000) and remain uncertain. We suggest that similar analyses using alternative phylogenies would be a fruitful avenue for future work.
Pattern of correlated evolution generally weaker when accounting for phylogeny, but not always
The strengths of most (but not all) relationships were found to weaken upon accounting for shared ancestry. This was most notably observed in the relationships between Specific Leaf Area, Stem Density, Maximum Height, Relative Bark Thickness and Leaf Area (Fig. 4). Within this subset of traits, a consistent pattern of correlated evolution of shifts to shorter trees were accompanied by shifts to thinner bark, lower Specific Leaf Area and smaller leaves, likely associated with the overall safety vs height dimension, allometry, or environmental affinities (Wright et al. 2005; Liu et al. 2019; Lawes et al. 2021). However, several of the correlations among leaf and stem traits weakened or became negligible among phylogenetically independent divergences on the tree. Thus, many of those associations occurred in more closely related taxa rather than in many independent lineages and are less likely to be generalisable to other clades.
Interestingly, the positive relationships between leaf and fruit (also seed) size strengthened upon accounting for phylogeny (Fig. 5). This suggests coordinated evolution of these traits throughout the evolution of the eucalypts, more than would be suggested by the prevalence of this trait combination within extant taxa. In addition to not being uniform in its amplification, shared ancestry can also obscure certain trait correlations.
Together these results suggest that although details of relationships within trait networks were more vulnerable to effects of shared ancestry, especially if they were weak, changes in statistically significant relationships were observed in only a minority of cases. Only one trait relationship with |r| > 0.3 became non-significant (P > 0.05) after accounting for phylogeny – that between Specific Leaf Area and Leaf Area. This suggests that for eucalypts we can have reasonable confidence that the broad evolutionary relationships between these traits with moderate strength in extant taxa are likely to generalise to other clades and do represent correlated evolution. However, we caution interpreting marginal results or those from small studies (see also Wright et al. 2005).
We hope that this study inspires further work to clarify the evolution of the eucalypt clade and provides a basis for systematic investigation of trait–environment relationships in trees at a subcontinental scale.
Data availability
The authors have archived the data in the Zenodo Digital Repository (https://doi.org/10.5281/zenodo.8313641). Observation-level data have also been uploaded to AusTraits (Falster et al. 2021): https://doi.org/10.5281/zenodo.7583087.
Declaration of funding
We acknowledge funding from Eucalypt Australia through a major project grant, and the Victorian Government Department of Environment, Land, Water and Planning.
Acknowledgements
For help in the field, we thank Danny White, Angela Stock, and Mike Bayly. For advice on constructing the phylogeny, thanks to Todd McLay. We thank Pauline Ladiges, Angela Moles, Isaac Towers and two anonymous reviewers for comments on the manuscript that helped us focus our message. We acknowledge the following Indigenous Peoples on whose lands our data was collected: Djabwurung, Jardwadjali, Wauthurong, Woiworung, Boonwurrung, Taungurong, Kurnai, Bidwell, Waveroo, Wiradjuri, Jaimatang, Ngarigo, Yuin, Ngunawal, Gudungurra, Tharawal, and Wagyl Kaip.
References
Ackerly DD (2004) Adaptation, niche conservatism, and convergence: comparative studies of leaf evolution in the California chaparral. The American Naturalist 163, 654-671.
| Crossref | Google Scholar | PubMed |
Ackerly D (2009) Conservatism and diversification of plant functional traits: evolutionary rates versus phylogenetic signal. Proceedings of the National Academy of Sciences 106, 19699-19706.
| Crossref | Google Scholar |
Asao S, Hayes L, Aspinwall MJ, Rymer PD, Blackman C, Bryant CJ, Cullerne D, Egerton JJG, Fan Y, Innes P, Millar AH, Tucker J, Shah S, Wright IJ, Yvon-Durocher G, Tissue D, Atkin OK (2020) Leaf trait variation is similar among genotypes of Eucalyptus camaldulensis from differing climates and arises in plastic responses to the seasons rather than water availability. New Phytologist 227, 780-793.
| Crossref | Google Scholar | PubMed |
Baraloto C, Timothy Paine CE, Poorter L, Beauchene J, Bonal D, Domenach A-M, Hérault B, Patiño S, Roggy J-C, Chave J (2010) Decoupled leaf and stem economics in rain forest trees. Ecology Letters 13, 1338-1347.
| Crossref | Google Scholar | PubMed |
Baum BR (1992) Combining trees as a way of combining data sets for phylogenetic inference, and the desirability of combining gene trees. Taxon 41, 3-10.
| Crossref | Google Scholar |
Bayle GK (2019) Ecological and social impacts of eucalyptus tree plantation on the environment. Journal of Biodiversity Conservation and Bioresource Management 5, 93-104.
| Crossref | Google Scholar |
Bayly MJ, Rigault P, Spokevicius A, Ladiges PY, Ades PK, Anderson C, Bossinger G, Merchant A, Udovicic F, Woodrow IE, Tibbits J (2013) Chloroplast genome analysis of Australian eucalypts – Eucalyptus, Corymbia, Angophora, Allosyncarpia and Stockwellia (Myrtaceae). Molecular Phylogenetics and Evolution 69, 704-716.
| Crossref | Google Scholar | PubMed |
Beadle NCW (1966) Soil phosphate and its role in molding segments of the Australian flora and vegetation, with special reference to xeromorphy and sclerophylly. Ecology 47, 992-1007.
| Crossref | Google Scholar |
Bellingham PJ, Sparrow AD (2000) Resprouting as a life history strategy in woody plant communities. Oikos 89, 409-416.
| Crossref | Google Scholar |
Brooker MIH (2000) A new classification of the genus Eucalyptus L’Hér. (Myrtaceae). Australian Systematic Botany 13, 79-148.
| Crossref | Google Scholar |
Bui EN, Thornhill AH, González-Orozco CE, Knerr N, Miller JT (2017) Climate and geochemistry as drivers of eucalypt diversification in Australia. Geobiology 15, 427-440.
| Crossref | Google Scholar | PubMed |
Burrows GE (2002) Epicormic strand structure in Angophora, Eucalyptus and Lophostemon (Myrtaceae) – implications for fire resistance and recovery. New Phytologist 153, 111-131.
| Crossref | Google Scholar |
Burrows GE (2013) Buds, bushfires and resprouting in the eucalypts. Australian Journal of Botany 61, 331-349.
| Crossref | Google Scholar |
Caminha-Paiva D, Negreiros D, Barbosa M, Fernandes GW (2021) Functional trait coordination in the ancient and nutrient-impoverished campo rupestre: soil properties drive stem, leaf and architectural traits. Biological Journal of the Linnean Society 133, 531-545.
| Crossref | Google Scholar |
Cavender-Bares J (2019) Diversification, adaptation, and community assembly of the American oaks (Quercus), a model clade for integrating ecology and evolution. New Phytologist 221, 669-692.
| Crossref | Google Scholar | PubMed |
Chave J, Coomes D, Jansen S, Lewis SL, Swenson NG, Zanne AE (2009) Towards a worldwide wood economics spectrum. Ecology Letters 12, 351-366.
| Crossref | Google Scholar | PubMed |
Clarke PJ, Lawes MJ, Midgley JJ, Lamont BB, Ojeda F, Burrows GE, Enright NJ, Knox KJE (2013) Resprouting as a key functional trait: how buds, protection and resources drive persistence after fire. New Phytologist 197, 19-35.
| Crossref | Google Scholar | PubMed |
Clarke PJ, Lawes MJ, Murphy BP, Russell-Smith J, Nano CEM, Bradstock R, Enright NJ, Fontaine JB, Gosper CR, Radford I, Midgley JJ, Gunton RM (2015) A synthesis of postfire recovery traits of woody plants in Australian ecosystems. Science of The Total Environment 534, 31-42.
| Crossref | Google Scholar | PubMed |
Cornelissen JHC (1999) A triangular relationship between leaf size and seed size among woody species: allometry, ontogeny, ecology and taxonomy. Oecologia 118, 248-255.
| Crossref | Google Scholar | PubMed |
Corner EJH (1949) The Durian theory or the origin of the modern tree. Annals of Botany 13, 367-414.
| Crossref | Google Scholar |
Cornwell WK, Westoby M, Falster DS, FitzJohn RG, O’Meara BC, Pennell MW, McGlinn DJ, Eastman JM, Moles AT, Reich PB, Tank DC, Wright IJ, Aarssen L, Beaulieu JM, Kooyman RM, Leishman MR, Miller ET, Niinemets Ü, Oleksyn J, Ordonez A, Royer DL, Smith SA, Stevens PF, Warman L, Wilf P, Zanne AE (2014) Functional distinctiveness of major plant lineages. Journal of Ecology 102, 345-356.
| Crossref | Google Scholar |
Council of Heads of Australasian Herbaria (2021) Australian Plant Census (APC): vascular plants. Available at https://biodiversity.org.au/nsl/services [accessed 5 March 2021]
Crisp MD, Burrows GE, Cook LG, Thornhill AH, Bowman DMJS (2011) Flammable biomes dominated by eucalypts originated at the Cretaceous–Palaeogene boundary. Nature Communications 2, 193.
| Crossref | Google Scholar | PubMed |
Dantas VdL, Pausas JG (2013) The lanky and the corky: fire-escape strategies in savanna woody species. Journal of Ecology 101, 1265-1272.
| Crossref | Google Scholar |
Díaz S, Kattge J, Cornelissen JHC, Wright IJ, Lavorel S, Dray S, Reu B, Kleyer M, Wirth C, Colin Prentice I, Garnier E, Bönisch G, Westoby M, Poorter H, Reich PB, Moles AT, Dickie J, Gillison AN, Zanne AE, Chave J, Joseph Wright S, Sheremet’ev SN, Jactel H, Baraloto C, Cerabolini B, Pierce S, Shipley B, Kirkup D, Casanoves F, Joswig JS, Günther A, Falczuk V, Rüger N, Mahecha MD, Gorné LD (2016) The global spectrum of plant form and function. Nature 529, 167-171.
| Crossref | Google Scholar | PubMed |
Eamus D, Myers B, Duff G, Williams R (1999) A cost-benefit analysis of leaves of eight Australian savanna tree species of differing leaf life-span. Photosynthetica 36, 575-586.
| Crossref | Google Scholar |
Epskamp S, Cramer AOJ, Waldorp LJ, Schmittmann VD, Borsboom D (2012) qgraph: network visualizations of relationships in psychometric data. Journal of Statistical Software 48, 1-18.
| Crossref | Google Scholar |
Fahey PS, Udovicic F, Cantrill DJ, Nicolle D, McLay TGB, Bayly MJ (2022) A phylogenetic investigation of the taxonomically problematic (Eucalyptus odorata complex (E. section Adnataria series Subbuxeales): evidence for extensive interspecific gene flow and reticulate evolution. Australian Systematic Botany 35, 403-435.
| Crossref | Google Scholar |
Falster DS, Westoby M (2003) Plant height and evolutionary games. Trends in Ecology & Evolution 18, 337-343.
| Crossref | Google Scholar |
Falster DS, Westoby M (2005) Alternative height strategies among 45 dicot rain forest species from tropical Queensland, Australia. Journal of Ecology 93, 521-535.
| Crossref | Google Scholar |
Falster D, Gallagher R, Wenk EH, et al. (2021) AusTraits, a curated plant trait database for the Australian flora. Scientific Data 8(1), 254.
| Crossref | Google Scholar |
Felsenstein J (1985) Phylogenies and the comparative method. The American Naturalist 125, 1-15.
| Crossref | Google Scholar |
Fernández ME, Barotto AJ, Martínez Meier A, Gyenge JE, Tesón N, Quiñones Martorello AS, Merlo E, Dalla Salda G, Rozenberg P, Monteoliva S (2019) New insights into wood anatomy and function relationships: how Eucalyptus challenges what we already know. Forest Ecology and Management 454, 117638.
| Crossref | Google Scholar |
Flores-Moreno H, Fazayeli F, Banerjee A, Datta A, Kattge J, Butler EE, Atkin O K, Wythers K, Chen M, Anand M, Bahn M, Byun C, Cornelissen JHC, Craine J, Gonzalez-Melo A, Hattingh WN, Jansen S, Kraft NJB, Kramer K, Laughlin DC, Minden V, Niinemets U, Onipchenko V, Peñuelas J, Soudzilovskaia NA, Dalrymple RL, Reich PB (2019) Robustness of trait connections across environmental gradients and growth forms. Global Ecology and Biogeography 28, 1806-1826.
| Crossref | Google Scholar |
Fonseca CR, Overton JM, Collins B, Westoby M (2000) Shifts in trait-combinations along rainfall and phosphorus gradients. Journal of Ecology 88, 964-977.
| Crossref | Google Scholar |
Fortunel C, Fine PVA, Baraloto C (2012) Leaf, stem and root tissue strategies across 758 Neotropical tree species. Functional Ecology 26, 1153-1161.
| Crossref | Google Scholar |
Gandolfo MA, Hermsen EJ, Zamaloa MC, Nixon KC, González CC, Wilf P, Cúneo NR, Johnson KR (2011) Oldest known Eucalyptus macrofossils are from South America. PLoS ONE 6, e21084.
| Crossref | Google Scholar | PubMed |
Givnish TJ (1982) On the adaptive significance of leaf height in forest herbs. The American Naturalist 120, 353-381.
| Crossref | Google Scholar |
Givnish TJ (1988) Adaptation to sun and shade: a whole-plant perspective. Functional Plant Biology 15, 63-92.
| Crossref | Google Scholar |
González-Orozco CE, Thornhill AH, Knerr N, Laffan S, Miller JT (2014) Biogeographical regions and phytogeography of the eucalypts. Diversity and Distributions 20, 46-58.
| Crossref | Google Scholar |
Grafen A (1989) The phylogenetic regression. Philosophical Transactions of the Royal Society of London. B, Biological Sciences 326, 119-157.
| Crossref | Google Scholar | PubMed |
Griffin AR, Burgess IP, Wolf L (1988) Patterns of natural and manipulated hybridisation in the genus Eucalyptus L’Hérit.—a review. Australian Journal of Botany 36, 41-66.
| Crossref | Google Scholar |
Hansen TF, Pienaar J, Orzack SH (2008) A comparative method for studying adaptation to a randomly evolving environment. Evolution 62, 1965-1977.
| Crossref | Google Scholar | PubMed |
Henery ML, Westoby M (2001) Seed mass and seed nutrient content as predictors of seed output variation between species. Oikos 92, 479-490.
| Crossref | Google Scholar |
Hill J, Attiwill PM, Uren NC, O’Brien ND (2001) Does manganese play a role in the distribution of the eucalypts? Australian Journal of Botany 49, 1-8.
| Crossref | Google Scholar |
Holm S (1979) A simple sequentially rejective multiple test procedure. Scandinavian Journal of Statistics 6, 65-70.
| Google Scholar |
Hopper SD (2009) OCBIL theory: towards an integrated understanding of the evolution, ecology and conservation of biodiversity on old, climatically buffered, infertile landscapes. Plant and Soil 322, 49-86.
| Crossref | Google Scholar |
Hopper SD (2021) Out of the OCBILs: new hypotheses for the evolution, ecology and conservation of the eucalypts. Biological Journal of the Linnean Society 133, 342-372.
| Crossref | Google Scholar |
Jackson HD, Steane DA, Potts BM, Vaillancourt RE (1999) Chloroplast DNA evidence for reticulate evolution in Eucalyptus (Myrtaceae). Molecular Ecology 8, 739-751.
| Crossref | Google Scholar |
Jones RC, Nicolle D, Steane DA, Vaillancourt RE, Potts BM (2016) High density, genome-wide markers and intra-specific replication yield an unprecedented phylogenetic reconstruction of a globally significant, speciose lineage of Eucalyptus. Molecular Phylogenetics and Evolution 105, 63-85.
| Crossref | Google Scholar | PubMed |
Keddy PA (1992) Assembly and response rules: two goals for predictive community ecology. Journal of Vegetation Science 3, 157-164.
| Crossref | Google Scholar |
Kleyer M, Trinogga J, Cebrián-Piqueras MA, Trenkamp A, Fløjgaard C, Ejrnæs R, Bouma TJ, Minden V, Maier M, Mantilla-Contreras J, Albach DC, Blasius B (2019) Trait correlation network analysis identifies biomass allocation traits and stem specific length as hub traits in herbaceous perennial plants. Journal of Ecology 107, 829-842.
| Crossref | Google Scholar |
Knerr N, Thornhill A (2019) Eucalypt phylogenetic data. Available at https://doi.org/10.25919/5C6A53564D748
Kruger LM, Midgley JJ, Cowling RM (1997) Resprouters vs reseeders in South African forest trees; a model based on forest canopy height. Functional Ecology 11, 101-105.
| Crossref | Google Scholar |
Kunstler G, Falster D, Coomes DA, Hui F, Kooyman RM, Laughlin DC, Poorter L, Vanderwel M, Vieilledent G, Wright SJ, Aiba M, Baraloto C, Caspersen J, Cornelissen JHC, Gourlet-Fleury S, Hanewinkel M, Herault B, Kattge J, Kurokawa H, Onoda Y, Peñuelas J, Poorter H, Uriarte M, Richardson S, Ruiz-Benito P, Sun I-F, Ståhl G, Swenson NG, Thompson J, Westerlund B, Wirth C, Zavala MA, Zeng H, Zimmerman JK, Zimmermann NE, Westoby M (2016) Plant functional traits have globally consistent effects on competition. Nature 529, 204-207.
| Crossref | Google Scholar | PubMed |
Ladiges PY, Udovicic F, Nelson G (2003) Australian biogeographical connections and the phylogeny of large genera in the plant family Myrtaceae. Journal of Biogeography 30, 989-998.
| Crossref | Google Scholar |
Lawes MJ, Neumann M (2022) Variation in eucalypt bark allometry across Australia. Australian Journal of Botany 70, 215-230.
| Crossref | Google Scholar |
Lawes MJ, Richards A, Dathe J, Midgley JJ (2011) Bark thickness determines fire resistance of selected tree species from fire-prone tropical savanna in north Australia. Plant Ecology 212, 2057-2069.
| Crossref | Google Scholar |
Lawes MJ, Midgley JJ, Clarke PJ (2013) Costs and benefits of relative bark thickness in relation to fire damage: a savanna/forest contrast. Journal of Ecology 101, 517-524.
| Crossref | Google Scholar |
Lawes MJ, Woolley L-A, Van Holsbeeck S, Murphy BP, Burrows GE, Midgley JJ (2021) Bark functional ecology and its influence on the distribution of Australian half-butt eucalypts. Austral Ecology 46, 1097-1111.
| Crossref | Google Scholar |
Lawes MJ, Crisp MD, Clarke PJ, Murphy BP, Midgley JJ, Russell-Smith J, Nano CEM, Bradstock RA, Enright NJ, Fontaine JB, Gosper CR, Woolley L-A (2022) Appraising widespread resprouting but variable levels of postfire seeding in Australian ecosystems: the effect of phylogeny, fire regime and productivity. Australian Journal of Botany
| Crossref | Google Scholar |
Liu H, Gleason SM, Hao G, Hua L, He P, Goldstein G, Ye Q (2019) Hydraulic traits are coordinated with maximum plant height at the global scale. Science Advances 5, eaav1332.
| Crossref | Google Scholar |
Loehle C (2000) Strategy space and the disturbance spectrum: a life-history model for tree species coexistence. The American Naturalist 156, 14-33.
| Crossref | Google Scholar | PubMed |
Lord JM, Westoby M (2006) Accessory costs of seed production. Oecologia 150, 310-317.
| Crossref | Google Scholar | PubMed |
Messier J, McGill BJ, Enquist BJ, Lechowicz MJ (2017a) Trait variation and integration across scales: is the leaf economic spectrum present at local scales? Ecography 40, 685-697.
| Crossref | Google Scholar |
Messier J, Lechowicz MJ, McGill BJ, Violle C, Enquist BJ (2017b) Interspecific integration of trait dimensions at local scales: the plant phenotype as an integrated network. Journal of Ecology 105, 1775-1790.
| Crossref | Google Scholar |
Midgley JJ (1996) Why the world’s vegetation is not totally dominated by resprouting plants; because resprouters are shorter than reseeders. Ecography 19, 92-95.
| Crossref | Google Scholar |
Moles AT (2018) Being John Harper: using evolutionary ideas to improve understanding of global patterns in plant traits. Journal of Ecology 106, 1-18.
| Crossref | Google Scholar |
Moles AT, Westoby M (2006) Seed size and plant strategy across the whole life cycle. Oikos 113, 91-105.
| Crossref | Google Scholar |
Moles AT, Ackerly DD, Webb CO, Tweddle JC, Dickie JB, Westoby M (2005) A brief history of seed size. Science 307, 576-580.
| Crossref | Google Scholar | PubMed |
Moles AT, Warton DI, Warman L, Swenson NG, Laffan SW, Zanne AE, Pitman A, Hemmings FA, Leishman MR (2009) Global patterns in plant height. Journal of Ecology 97, 923-932.
| Crossref | Google Scholar |
Molina-Venegas R, Rodríguez MÁ (2017) Revisiting phylogenetic signal; strong or negligible impacts of polytomies and branch length information? BMC Evolutionary Biology 17, 53.
| Crossref | Google Scholar |
Muller-Landau HC (2010) The tolerance-fecundity trade-off and the maintenance of diversity in seed size. Proceedings of the National Academy of Sciences 107, 4242-4247.
| Crossref | Google Scholar |
Murray BR, Gill AM (2001) A comparative study of interspecific variation in fruit size among Australian eucalypts. Ecography 24, 651-658.
| Crossref | Google Scholar |
Münkemüller T, Lavergne S, Bzeznik B, Dray S, Jombart T, Schiffers K, Thuiller W (2012) How to measure and test phylogenetic signal: how to measure and test phylogenetic signal. Methods in Ecology and Evolution 3, 743-756.
| Crossref | Google Scholar |
Nicolle D (2006) A classification and census of regenerative strategies in the eucalypts (Angophora, Corymbia and Eucalyptus—Myrtaceae), with special reference to the obligate seeders. Australian Journal of Botany 54, 391-407.
| Crossref | Google Scholar |
Nicolle D (2019) Classification of the Eucalypts (Angophora, Corymbia and Eucalyptus) Version 4. Available at http://www.dn.com.au/Classification-Of-The-Eucalypts.pdf
Noble IR (1989) Ecological traits of the Eucalyptus L’Hérit. subgenera Monocalyptus and Symphyomyrtus. Australian Journal of Botany 37, 207-224.
| Crossref | Google Scholar |
Orme D, Freckleton R, Thomas G, Petzoldt T, Fritz S, Isaac N, Pearse W (2018) caper: comparative analyses of phylogenetics and evolution in R. Available at https://CRAN.R-project.org/package=caper
Pagel M (1999) Inferring the historical patterns of biological evolution. Nature 401, 877-884.
| Crossref | Google Scholar | PubMed |
Paradis E, Schliep K (2019) ape 5.0: an environment for modern phylogenetics and evolutionary analyses in R. Bioinformatics 35, 526-528.
| Crossref | Google Scholar | PubMed |
Pausas JG (2015) Bark thickness and fire regime. Functional Ecology 29, 315-327.
| Crossref | Google Scholar |
Pausas JG, Keeley JE (2014) Evolutionary ecology of resprouting and seeding in fire-prone ecosystems. New Phytologist 204, 55-65.
| Crossref | Google Scholar | PubMed |
Pausas JG, Keeley JE (2017) Epicormic resprouting in fire-prone ecosystems. Trends in Plant Science 22, 1008-1015.
| Crossref | Google Scholar | PubMed |
Pausas JG, Pratt RB, Keeley JE, Jacobsen AL, Ramirez AR, Vilagrosa A, Paula S, Kaneakua-Pia IN, Davis SD (2016) Towards understanding resprouting at the global scale. New Phytologist 209, 945-954.
| Crossref | Google Scholar | PubMed |
Pfautsch S, Harbusch M, Wesolowski A, Smith R, Macfarlane C, Tjoelker MG, Reich PB, Adams MA (2016) Climate determines vascular traits in the ecologically diverse genus Eucalyptus. Ecology Letters 19, 240-248.
| Crossref | Google Scholar | PubMed |
Pollock LJ, Morris WK, Vesk PA (2012) The role of functional traits in species distributions revealed through a hierarchical model. Ecography 35, 716-725.
| Crossref | Google Scholar |
Pollock LJ, Bayly MJ, Nevill PG, Vesk PA (2013) Chloroplast DNA diversity associated with protected slopes and valleys for hybridizing Eucalyptus species on isolated ranges in south-eastern Australia. Journal of Biogeography 40, 155-167.
| Crossref | Google Scholar |
Pollock LJ, Bayly MJ, Vesk PA (2015) The roles of ecological and evolutionary processes in plant community assembly: the environment, hybridization, and introgression influence co-occurrence of Eucalyptus. The American Naturalist 185, 784-796.
| Crossref | Google Scholar | PubMed |
Pollock LJ, Kelly LT, Thomas FM, Soe P, Morris WK, White M, Vesk PA (2018) Combining functional traits, the environment and multiple surveys to understand semi-arid tree distributions. Journal of Vegetation Science 29, 967-977.
| Crossref | Google Scholar |
R Core Team (2021) ‘R: a language and environment for statistical computing.’ (R Foundation for Statistical Computing: Vienna, Austria). Available at https://www.R-project.org/
Ragan MA (1992) Phylogenetic inference based on matrix representation of trees. Molecular Phylogenetics and Evolution 1, 53-58.
| Crossref | Google Scholar | PubMed |
Reich PB (2014) The world-wide ‘fast–slow’ plant economics spectrum: a traits manifesto. Journal of Ecology 102, 275-301.
| Crossref | Google Scholar |
Rohle FJ (2006) A comment on phylogenetic correction. Evolution 60, 1509-1515.
| Crossref | Google Scholar |
Schliep KP (2011) phangorn: phylogenetic analysis in R. Bioinformatics 27, 592-593.
| Crossref | Google Scholar | PubMed |
Schulze E-D, Turner NC, Nicolle D, Schumacher J (2006) Leaf and wood carbon isotope ratios, specific leaf areas and wood growth of Eucalyptus species across a rainfall gradient in Australia. Tree Physiology 26, 479-492.
| Crossref | Google Scholar | PubMed |
Thornhill AH, Crisp MD, Külheim C, Lam KE, Nelson LA, Yeates DK, Miller JT (2019) A dated molecular perspective of eucalypt taxonomy, evolution and diversification. Australian Systematic Botany 32, 29-48.
| Crossref | Google Scholar |
Vesk PA, Westoby M (2004a) Funding the bud bank: a review of the costs of buds. Oikos 106, 200-208.
| Crossref | Google Scholar |
Vesk PA, Westoby M (2004b) Sprouting ability across diverse disturbances and vegetation types worldwide. Journal of Ecology 92, 310-320.
| Crossref | Google Scholar |
Vesk PA, Morris WK, Neal WC, Mokany K, Pollock LJ (2021) Transferability of trait-based species distribution models. Ecography 44, 134-147.
| Crossref | Google Scholar |
VicFlora (2021) Flora of Victoria. Royal Botanical Gardens Victoria. Available at https://vicflora.rbg.vic.gov.au [accessed 28 December 2021]
Violle C, Navas M-L, Vile D, Kazakou E, Fortunel C, Hummel I, Garnier E (2007) Let the concept of trait be functional!. Oikos 116, 882-892.
| Crossref | Google Scholar |
Werner PA, Prior LD, Forner J (2008) Growth and survival of termite-piped Eucalyptus tetrodonta and E. miniata in northern Australia: implications for harvest of trees for didgeridoos. Forest Ecology and Management 256, 328-334.
| Crossref | Google Scholar |
Western Australian Herbarium (1998) Florabase – the Western Australian Flora. Department of Biodiversity, Conservation and Attractions. Available at https://florabase.dpaw.wa.gov.au/ [accessed 28 December 2021]
Westoby M (1998) A leaf-height-seed (LHS) plant ecology strategy scheme. Plant and Soil 199, 213-227.
| Crossref | Google Scholar |
Westoby M, Wright IJ (2006) Land-plant ecology on the basis of functional traits. Trends in Ecology & Evolution 21, 261-268.
| Crossref | Google Scholar | PubMed |
Westoby M, Falster DS, Moles AT, Vesk PA, Wright IJ (2002) Plant ecological strategies: some leading dimensions of variation between species. Annual Review of Ecology and Systematics 33, 125-159.
| Crossref | Google Scholar |
Williams RJ, Myers BA, Muller WJ, Duff GA, Eamus D (1997) Leaf phenology of woody species in a north Australian tropical savanna. Ecology 78, 2542-2558.
| Crossref | Google Scholar |
Wright IJ, Reich PB, Westoby M, Ackerly DD, Baruch Z, Bongers F, Cavender-Bares J, Chapin T, Cornelissen JHC, Diemer M, Flexas J, Garnier E, Groom PK, Gulias J, Hikosaka K, Lamont BB, Lee T, Lee W, Lusk C, Midgley JJ, Navas M-L, Niinemets Ü, Oleksyn J, Osada N, Poorter H, Poot P, Prior L, Pyankov VI, Roumet C, Thomas SC, Tjoelker MG, Veneklaas EJ, Villar R (2004) The worldwide leaf economics spectrum. Nature 428, 821-827.
| Crossref | Google Scholar | PubMed |
Wright IJ, Reich PB, Cornelissen JHC, Falster DS, Groom PK, Hikosaka K, Lee W, Lusk CH, Niinemets Ü, Oleksyn J, Osada N, Poorter H, Warton DI, Westoby M (2005) Modulation of leaf economic traits and trait relationships by climate. Global Ecology and Biogeography 14, 411-421.
| Crossref | Google Scholar |
Wright IJ, Ackerly DD, Bongers F, Harms KE, Ibarra-Manriquez G, Martinez-Ramos M, Mazer SJ, Muller-Landau HC, Paz H, Pitman NCA, Poorter L, Silman MR, Vriesendorp CF, Webb CO, Westoby M, Wright SJ (2007) Relationships among ecologically important dimensions of plant trait variation in seven neotropical forests. Annals of Botany 99, 1003-1015.
| Crossref | Google Scholar | PubMed |
Wright IJ, Dong N, Maire V, Prentice IC, Westoby M, Díaz S, Gallagher RV, Jacobs BF, Kooyman R, Law EA, Leishman MR, Niinemets Ü, Reich PB, Sack L, Villar R, Wang H, Wilf P (2017) Global climatic drivers of leaf size. Science 357, 917-921.
| Crossref | Google Scholar | PubMed |