

Changes in pasture and soil properties with liming and superphosphate application on five soils in the Central Tablelands of New South Wales over 12 years
P. M. Dowling A B F , I. A. Vimpany C D F , M. K. Conyers E F , G. D. Millar A , K. R. Helyar E F , D. L. Michalk A F , H. I. Nicol A F , J. Bradley D F , P. J. Milham D F G and R. C. Hayes E *
A
B
C
D
E
F Retired.
G
Abstract
The decision to lime pastures requires understanding of the benefits and their duration.
To quantify the effects of contrasting rates of superphosphate and lime on soil chemistry and pasture productivity on five acidic soils over 12 years.
The sites were established in 1978 on the Central Tablelands of New South Wales, Australia. Initial treatments of lime were 0, 0.63, 1.25, 2.5 and 5.0 t/ha. Single superphosphate (SSP) was top-dressed annually at 0, 125 and 250 kg/ha.
Across the five sites, initial pH increase due to liming was 0.3 units/t. After 12 years, pH declined to 0.1 pH units/t. Without lime, soil pH declined by ~0.02 units/year. For all lime treatments and sites, the annual decline averaged ~0.07 units/year. Annual applications of SSP were associated with lower soil pH and exchangeable soil K and higher Al saturation, but differences required 2–7 years to emerge. There was an increase in annual dry matter with SSP application. Lime generally increased pasture biomass, with pastures dominated by Trifolium subterraneum. Pasture yields generally increased with exchangeable Ca but yield responses to %Al were more variable.
A single application of lime had many enduring beneficial effects on soil chemistry, still evident 12 years following application and generally proportional to the quantum of lime initially applied. Ongoing applications of SSP led to cumulative changes in some soil properties and resulted in an increase in pasture productivity.
The historical view of lime and SSP being alternative investments is counterproductive. Pasture renovation may be necessary to realise the full benefit of lime and SSP application.
Keywords: Aluminium, calcium, cation exchange capacity, cocksfoot, magnesium, phosphorus, potassium, soil pH, subterranean clover.
Introduction
Perhaps one of the oldest agricultural practices, the application of lime (CaCO3) remains the most cost-effective method of ameliorating soil acidity (Hayes et al. 2023). The resulting increase in pH impacts the availability of many essential nutrients in soils, as well as their rate of uptake in plants (Barrow and Hartemink 2023). Changes in soil physical properties (Chan and Heenan 1998; Roper 2005), soil water (Hayes et al. 2016) and soil biological characteristics (Lee et al. 2022) have, at different times, all been attributed to liming, serving to increase the complexity for the land manager in assessing the benefits or otherwise of liming.
Liming responses in soil occur over relatively long timeframes (Li et al. 2019). Consequently, there is a clear bias in studies of more immediate responses with fewer studies monitoring responses over periods of a decade or more (Holland et al. 2018). Yet, an understanding of the long-term benefit of lime is necessary for land managers to properly assess its feasibility on-farm (Holland and Behrendt 2021). Short-term (<5 years) funding cycles in research present obvious challenges in collecting data over longer periods. Long-term liming experiments, such as MASTER (Managing Acid Soils Through Efficient Rotations) in south-eastern Australia (Li et al. 2003, 2006a, 2006b, 2010, 2019), and at Rothamsted and Woburn in the UK (Holland et al. 2018; Holland and Behrendt 2021), have provided rare and detailed insights into the long-term effects of lime, but such studies are restricted to just a handful of environments globally, presenting challenges when extrapolating to different soils or environments. Knowledge of the enduring legacy of lime is essential for land managers to appropriately understand its benefits.
The assessment of persistent effects is further complicated by confounding interactions with nutrients, which can be primary drivers of plant productivity and persistence. In pastures of south-eastern Australia where legumes remain the major source of nitrogen (N) (Peoples et al. 2012) phosphorus (P) is commonly the next most limiting macro-nutrient of pasture soils (Simpson et al. 2021), with a minority of soils more limited by macronutrients such as sulfur (S) (McLachlan 1955). Deficiencies of both P and S are commonly overcome by regular applications of single superphosphate (8.8% P, 11% S) top-dressed to pastures (Simpson et al. 2021).
The adoption of superphosphate fertilisers post 1930 transformed Australian pastures by addressing the ‘extreme poverty’ evident in most Australian soils (Donald 1965), directly by the addition of P and S (and Ca), and indirectly, through inputs of biological N supplied by the new leguminous pastures that as a consequence could be successfully grown (Donald and Williams 1954). The visible and immediate response to superphosphate observed in pastures led to its widespread use across every Australian State (Donald 1965). It was understandable that graziers in those days often chose to invest in superphosphate rather than lime, particularly given the little that was known about soil acidity prior to the 1970s (Helyar 1976) and the specialised machinery required to spread lime.
As a result of this historical context, there persists an interest in the question of whether superphosphate remains a better investment than lime (e.g. Lieschke 2022). Such a belief is perpetuated by financial analyses using partial budgeting techniques, such as Khairo et al. (2010), which found that in a wool production system, ‘the highest net present value was generated by a low input system involving unlimed soil…’. However, weighing the use of superphosphate vs lime seems an erroneous argument from a biological perspective as superphosphate and lime perform different functions; the former a fertiliser seeking to amend deficiencies of P and S in productive agricultural species (Donald 1965), the latter seeking to ameliorate soil acidity by changing the chemistry of the soil volume (Scott et al. 2000). Indeed, it was soon realised that superphosphate used in conjunction with legume-based pastures led to rapid acidification of soils (Williams 1980), suggesting that a combination of superphosphate and liming might be a more sustainable approach. Yet, whilst several long-run studies have examined aspects of sheep production in superphosphate × lime experiments (Norton et al. 2020, 2023), there is a need for a better understanding of the effects on soil properties and on the pasture response across multiple environments to better inform future financial analyses.
In this study, we analysed data from historical sites, sampled during the 1980s, to answer contemporary questions around the effects of lime, and superphosphate, on pasture productivity and composition that occurred over a 12-year period. Three objectives were to quantify:
The extent and longevity of pH increases, and associated changes in key soil chemical properties including exchangeable cations and Bray P, following lime application across different soils;
Changes in those same properties attributable to regular applications of single superphosphate; and
Long-term changes in pasture biomass and composition attributable to either superphosphate or lime.
Materials and methods
Two field experiments were established at each of five sites to compare five lime rates and three single superphosphate (SSP) rates in randomised complete block designs.
Site details
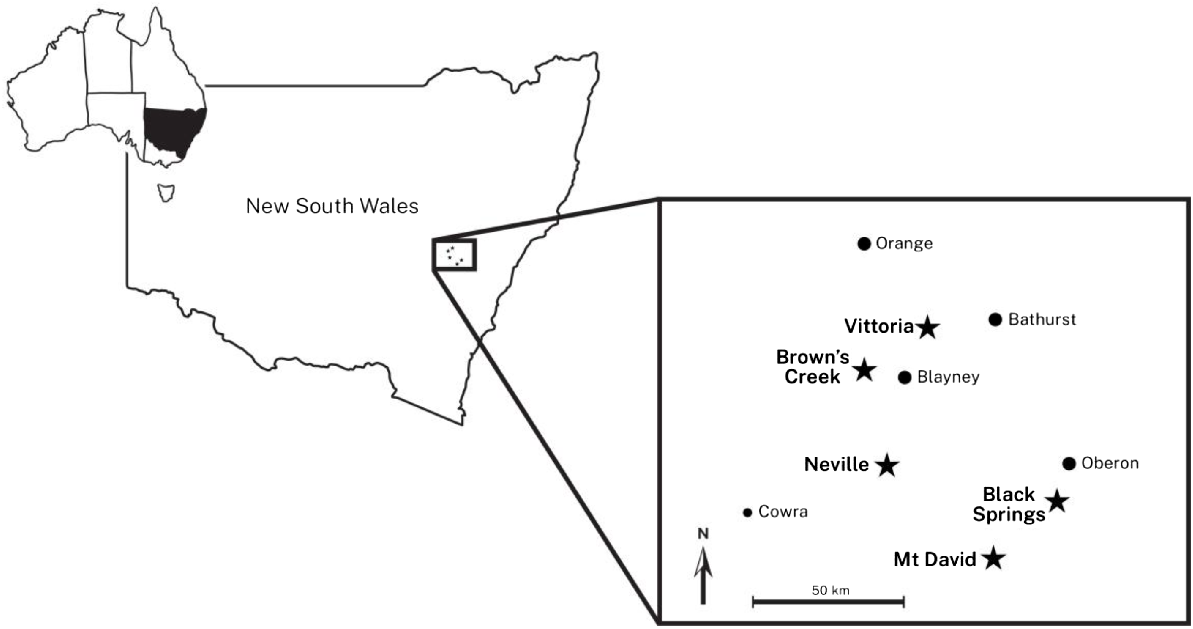
Experimental sites were located on the Central Tablelands of NSW, Australia on soils that represent a range of the more acidic types in the area. The five sites were: (1) Mt. David; (2) Vittoria; (3) Browns Creek; (4) Neville; and (5) Black Springs (Fig. 1). Site locations, soil classifications (Stace et al. 1968; Northcote 1979; Isbell 1996), and selected soil properties are in Table 1. The experiment was conducted in two phases to accommodate changes in pasture composition and to improved pasture sampling methods towards the end of the period. Site meteorological data was inferred using spatial interpolation for each site with records dating from 1930 using Datadrill (see Fig. 2; Jeffrey et al. 2001).
Locations of the five experimental sites ( Mt David, Vittoria, Brown’s Creek, Neville, and Black Springs) on the Central Tablelands of New South Wales, Australia.
| Properties | Mt David | Vittoria | Browns Creek | Neville | Black Springs | |
|---|---|---|---|---|---|---|
| Latitude (S) | 33°54′ | 33°28′ | 33°32′ | 33°44′ | 33°47′ | |
| Longitude (E) | 149°36′ | 149°21′ | 149°07′ | 149°11′ | 149°50′ | |
| Elevation (m) | 1130 | 1000 | 890 | 950 | 1140 | |
| Rainfall A | 845 | 796 | 903 | 938 | 831 | |
| Soil type B | Yellow kandosol | Yellow kandosol | Yellow kandosol | Red kandosol | Red dermosol | |
| Northcote C | Gn 2.34 | Gn 2.34 | Gn 2.34 | Gn 2.14 | Uf 6.12 | |
| Great soil group D | Yellow earth | Yellow earth | Yellow earth | Red earth | Kraznozem | |
| Texture of top 15 cm | Silty clay | Silty clay | Silty clay | Silty clay | Light clay | |
| pH 1979 | 4.30 | 4.38 | 4.15 | 4.23 | 4.33 | |
| pH 1989 | 4.08 | 4.18 | 3.99 | 4.24 | 4.10 | |
| Effective cation exchange capacity (ECEC) 1979 | 3.38 | 5.16 | 2.34 | 3.33 | 4.51 | |
| ECEC 1989 | 3.96 | 4.24 | 3.00 | 3.97 | 4.36 | |
| %Al 1979 | 22.6 | 10.2 | 19.3 | 22.8 | 31.0 | |
| %Al 1989 | 45.3 | 29.2 | 35.6 | 29.6 | 54.8 | |
| %Ca 1979 | 47.6 | 64.8 | 60.4 | 51.9 | 48.7 | |
| %Ca 1989 | 27.7 | 44.3 | 31.7 | 29.5 | 27.0 | |
| Bray P 1979 | 22.5 | 28.2 | 30.6 | 27.7 | 31.6 | |
| Bray P 1989 | 7.1 | 5.4 | 12.2 | 12.5 | 9.9 | |
| Phosphorus sorption (mg/kg) | 316 | 218 | 166 | 271 | 506 | |
| Organic carbon (%) | 3.26 | 3.35 | 2.30 | 2.36 | 4.32 | |
| Easily reducible MnO2 (mg/kg) | – | 58 | 23 | 40 | 40 |
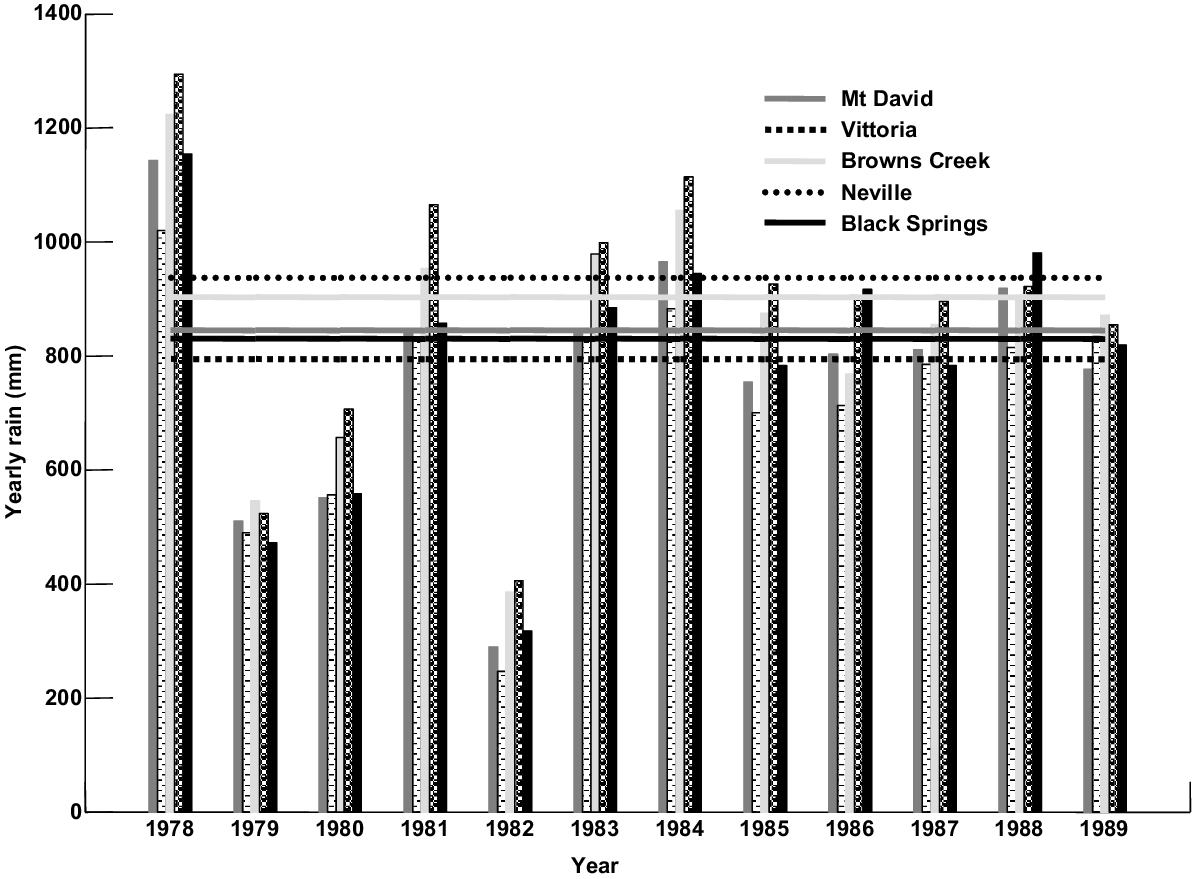
Total annual rainfall, and average annual rainfall received at each site over the experimental period. Values were derived from datadrill (Jeffrey et al. 2001) using records dating from 1930.
Phase I (1978–1986)
Sites were ploughed (15 cm depth) in December 1978 and lime (NV = 97; 95% <150 μm) at five rates (0, 0.63, 1.25, 2.5, and 5.0 t/ha) was incorporated by rotary-hoe to a depth of 12.5–15.0 cm. Superfine lime (95% <150 μm) was locally sourced from a plant at Bathurst, NSW. Two experiments were sown at each site in April 1979 with seed of species with moderate tolerance (Experiment 1) and high sensitivity to acid soils (Experiment 2), respectively. Species sown and their seed weights (kg/ha) in Experiment 1 were: red clover (Trifolium pratense) cv. Redquin (3.4); white clover (Trifolium repens) cv. Haifa (1.1); subterranean clover (Trifolium subterraneum) cv. Woogenellup (4.5); perennial ryegrass (Lolium perenne) cv. Victorian (5.0); and cocksfoot (Dactylis glomerata) cv. Currie (1.1). The acid-sensitive species sown in Experiment 2 included lucerne (Medicago sativa) cv. WL318 (6.7 kg/ha) and phalaris (Phalaris aquatica) cv. Sirosa (4.5 kg/ha). Each experiment was a randomised block design and replicated twice. Plot size was 5 × 3 m.
All plots received a basal dressing of copper (Cu), manganese (Mn) and zinc (Zn) as sulfates plus borax (all four at 8 kg/ha each), flowers of sulfur (S; 33 kg/ha) and magnesium (Mg) sulfate (125 kg/ha) prior to seeding with a tyne-seeder in April 1979. Molybdenum (Mo) single superphosphate (8.8% P, 11% S, 19% Ca, 0.025% Mo) was also applied at 250 kg/ha with the seed. In spring each year potassium (K) chloride (250 kg/ha) was broadcast on all plots, and single superphosphate (SSP, 8.8% P, 11% S, 19% Ca) was applied annually at 0, 125, and 250 kg/ha. All legume seed was appropriately inoculated and lime pelleted. The experiments were disrupted by the drought of 1980–1982, causing plots to be reseeded and trace elements reapplied.
Soil samples (0–7.5 cm depth) were collected in November in the years 1979–1986 from every plot immediately before reapplication of the SSP treatments. Each sample consisted of a composite of 35 cores, diameter 2.25 cm. The samples were dried at 40°C and passed through a 2-mm sieve prior to analysis. Exchangeable cations (0.0125 M BaCl2 leach) (Vimpany et al. 1985), pH (0.01 M CaCl2; pHCa) (Rayment and Lyons 2011; Method 4B1), P-sorption (Bache and Williams 1971; Rayment and Lyons 2011; Method 9I1) and organic carbon (Leco total C) (Rayment and Lyons 2011; Method 6B2b). Specific detail of the procedures are described by Vimpany et al. (1985). Effective cation exchange capacity (ECEC) was calculated as the sum of cations measured (Ca2+, Mg2+, K+, Na+, Al3+), and Ca (% Ca) and Al (%Al) saturation were calculated as proportions of the ECEC. Phosphorus (Bray-1) was also measured on all plots in all years (Bray and Kurtz 1945; Rayment and Lyons 2011; Method 9E).
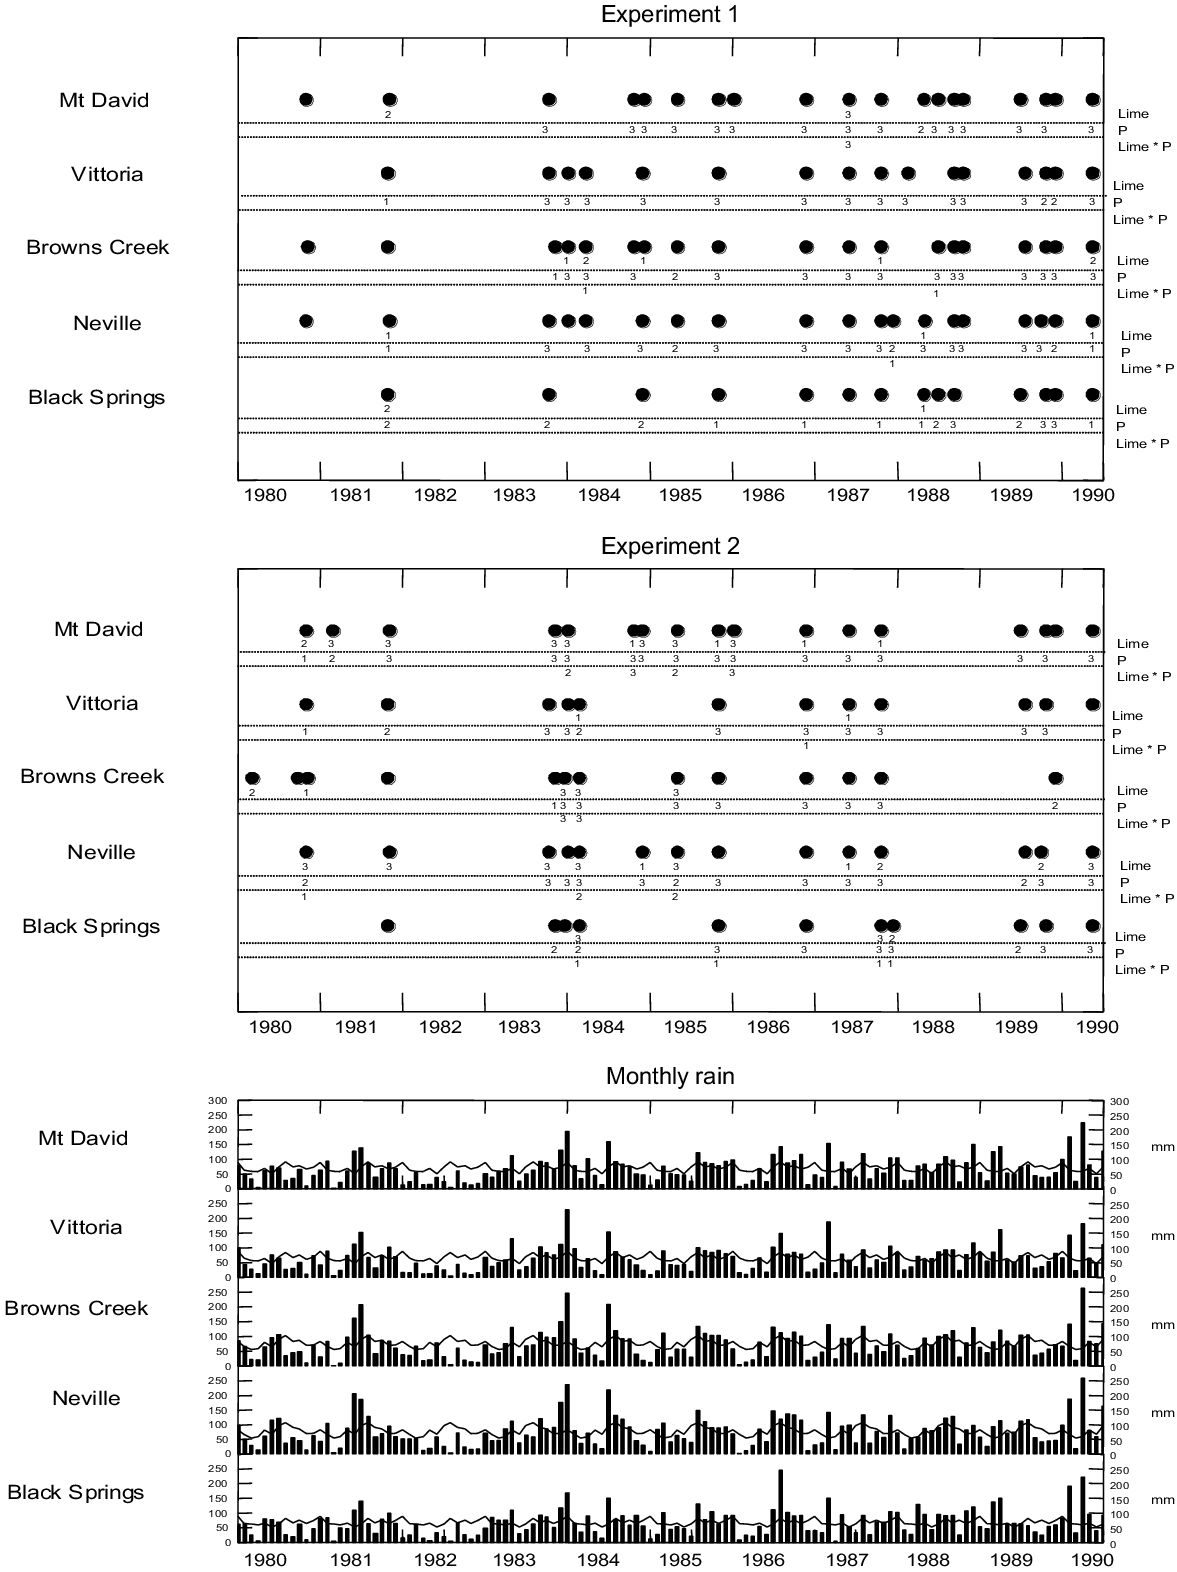
Pasture harvests were conducted whenever treatment effects were visually apparent and are presented as at the sampling time, irrespective of the intervening period since the previous sampling (see Fig. 3 for actual sampling times at each site). Plant material from the central part of the plot (1 × 2 m) was cut to 5 cm height with a cutter bar mower and weighed in the field on portable scales. A sub-sample (~500 g) was collected from each to calculate plot dry matter yield (DM). The remaining pasture was cut and all the material removed from the plots after harvesting, as plots were not grazed.
Phase II (1987–1990)
Phase II commenced in 1987 and utilised the sites originally sown in 1979 (Phase I). Immediately after soil cores were taken in spring each year, SSP was applied at the same three rates. Experiment 1 (E1) continued unaltered but Experiment 2 (E2) was extensively modified by re-seeding the pasture. To ensure similar botanical composition across treatments during Phase II, the perennial species T. subterraneum cv. Woogenellup (susceptible to clover scorch) and Vulpia spp. were removed by herbicide (glyphosate, 360 g/L) in spring 1987 and autumn 1988. All plots were reseeded with T. subterraneum cv. Karridale (10 kg/ha) resulting in a legume dominant pasture that was more sensitive to pH in comparison to the grass dominant pasture in E1. Later, germinating seedlings of Vulpia spp. were controlled by an application of carbetamex herbicide (carbetamide, 700 g/kg). After each harvest, there was a heavy grazing of both experiments (50–200 sheep/ha) for periods of 4–7 day, depending on seasonal conditions.
Ten soil cores/plot were extracted in spring at 0–7.5 cm in 1988 for estimating Bray-1 P and pH, and 0–10 cm in 1987, 1988, and 1989, for estimating pH, ECEC, and Mn (mg/L) and Al (mg/L) in 0.01 M CaCl2. Soil was air-dried and sieved prior to processing. Phosphorus sorption, pHCa and organic carbon were determined as previously described. Exchangeable cations and ECEC were measured using the procedure of Gillman and Sumpter (1986) (Rayment and Lyons 2011; Method 15E1), and % saturation was calculated as for Phase I. Bray-1 P (mg/kg) was measured on the 0–7.5 cm samples in 1988 and on the 0–10 cm samples in 1989.
Pasture production was estimated by a rising plate (Earle and McGowan 1979) when visual differences between treatments were observed. Ten positions of the plate were taken per plot at each sampling time. For each experiment, yield estimates were based on regressions generated from ten calibration cuts at each sampling time. In E2 (dominated by T. subterraneum), vegetation was cut to 2.5–3.0 cm height, whereas in E1 (dominated by D. glomerata), height of cutting was 2.5–5.0 cm. Pasture composition was assessed in spring 1987 and 1990. In spring 1987, a mean plot composition was derived from two independent observers whereas for spring 1990, pasture composition was derived using dry-weight-ranks (Mannetje and Haydock 1963) determined from 10 quadrats per plot.
Statistical analysis
Because of the change in soil sampling depths between Phases I and II, different methods of analysis were used for the data. Analysis of soil pHCa detected no significant difference between the two sampling depths (0–7.5 cm, 0–10 cm) for soil collected in 1988. Regression analysis was then used to determine time trends in pHCa from 1979 to 1989, where 1979 was assigned time = 0. There were no co-incident measurements at the two sampling depths for the other measured soil parameters, and these parameters were analysed by individual ANOVA for each sampling period, with the change in levels of significance between lime and SSP rates recorded. Long-term DM responses were analysed by spline regression analysis, while individual DM harvests and composition data were analysed by ANOVA (GenStat 2000). Trends and differences presented are at the 5% level of significance unless otherwise indicated. Botanical composition was analysed by ANOVA.
Results
Meteorological data
Long-term (1930–1989) average annual rainfall for each site (Fig. 2) was greatest at Neville (938 mm) and lowest at Vittoria (796 mm) with Browns Creek (903 mm), Mt David (845 mm) and Black Springs (831 mm) between these extremes. The higher long-term average rainfall at Neville and Browns Creek compared with the other sites was due to historically higher rainfall in the May–October period (data not shown). Total annual rainfall for each site during the experimental period was variable with well above average rainfall in 1978 and 1990; above average in 1981, 1983 and 1984 (except Mt David in 1981 and 1983); below average over the period 1985–1989 (except Mt David in 1988; Vittoria in 1988–1989; and Black Springs in 1986, 1988); and well below average in 1979, 1980 and 1982 (Fig. 3), a period of widespread drought across much of eastern Australia (e.g. Archer and Rochester 1982).
Monthly rainfall across sites followed the same trends over the course of the experiment (Fig. 3). Generally, rainfall was well below average in 1980, preceding a wet winter in 1981 followed by little rainfall until the start of 1983. Monthly rainfall in 1983 was close to average, concluding with above average rainfall in November and December. The years 1984 and 1986 were characterised by low summer/autumn rains, while in 1984 and 1985, there were above average winter rains. Spring rains were above average in 1985 and 1986. From 1987, monthly rainfall was generally close to the average, with only the occasional month where rainfall was below average. Monthly temperature maxima and minima for each site followed similar trends with Browns Creek being generally warmer and Black Springs cooler (data not shown).
Site differences in soil characteristics
Soils at Mt David, Vittoria, and Browns Creek were similar under the following classifications: Northcote (1979) Gn 2.34, Stace et al. (1968) yellow earth and Isbell (1996) yellow kandosol (Table 1), with Neville (Gn 2.14, red earth, red kandosol) and Black Springs (Uf 6.12, kraznozem, red dermosol) being distinctly different. Soil texture (0–15 cm) was similar for all sites (silty clay) except Black Springs (light clay). Initial pHCa values were similar across all sites and ranged from 4.15 (Browns Creek) to 4.38 (Vittoria). Initial ECEC values were highest at Vittoria (5.16) and Black Springs (4.51), and lowest at Browns Creek (2.34), while %Al was lowest at Vittoria (10.2%) and highest at Black Springs (31%). The ECEC was dominated by Ca at all sites. with %Ca from 47.6% (Mt David) to 64.8% (Vittoria). P sorption and organic C values were greatest at Black Springs (506 mg/kg, 4.32% C) and lowest at Browns Creek (166 mg/kg, 2.30% C).
Effect of lime on key soil parameters
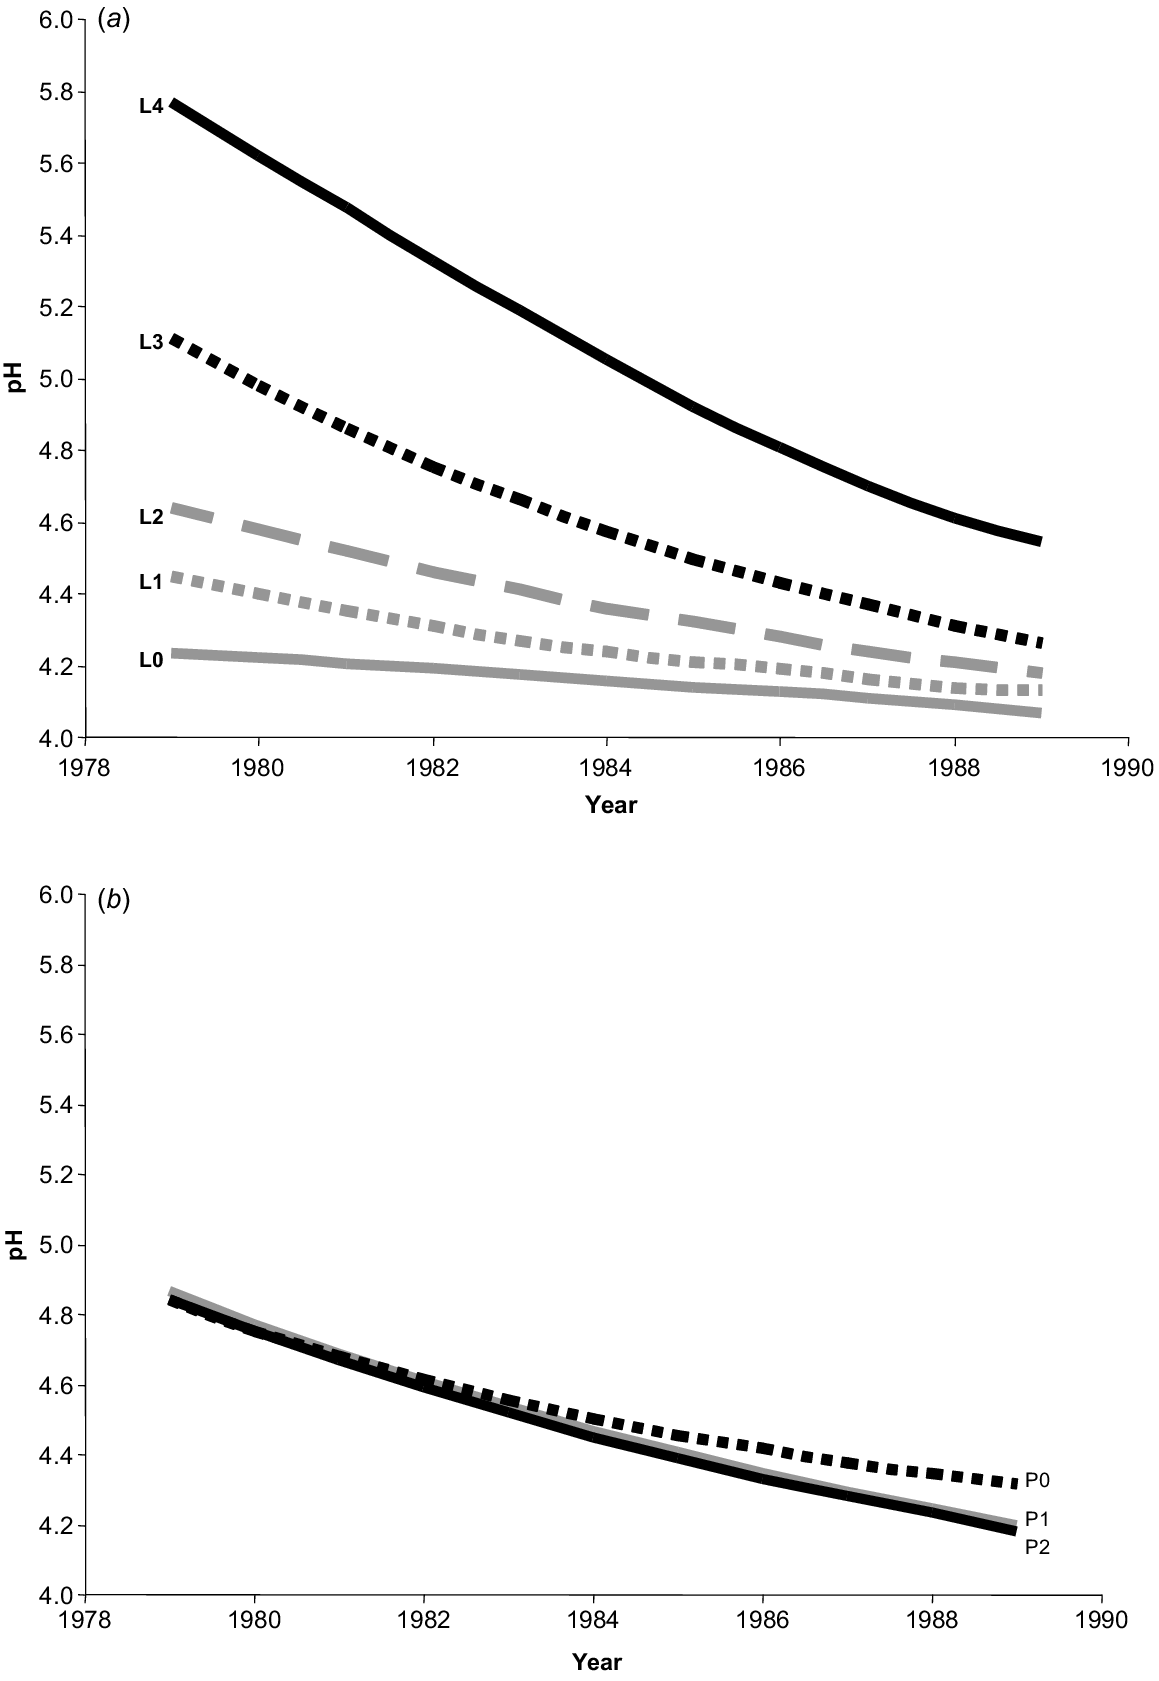
In 1979, 1 year after lime application, soil pHCa was increased (Fig. 4a) by an across site average of 0.3 units/t of lime applied (pHCa = 4.29 + 0.30 × lime (t/ha); R2 = 0.88), but this response had declined to 0.1 pHCa units by 1989 (pHCa = 4.04 + 0.10 × lime (t/ha); R2 = 0.55; P < 0.001). Responses in E1 and E2 at each site were similar over time.
Long term effects of (a) lime and (b) superphosphate on soil pH over the experimental period (1979–1989). Data are averaged over all experiments and sites. Lime (L) rates: 0 = nil; 1 = 0.63 t/ha; 2 = 1.25 t/ha; 3 = 2.5 t/ha; 4 = 5.0 t/ha. Superphosphate (P) rates: 0 = nil; 1 = 125 kg/ha; 2 = 250 kg/ha.
Averaged across the five sites, soil pHCa on the control treatments declined with time (pHCa = 4.26–0.017 × year; R2 = 0.14; P < 0.001). The rate of decline was greater (P < 0.05) in E2 (pHCa = 4.33–0.025 × year; R2 = 0.25) than in E1 (pHCa = 4.21–0.012 × year; R2 = 0.08). The decline over time at Mt David was (pHCa = 4.22–0.016 × year; R2 = 0.17; P < 0.05); at Vittoria was (pHCa = 4.44–0.028 × year; R2 = 0.39; P < 0.001); and at Black Springs was (pHCa = 4.32–0.024 × year; R2 = 0.57; P < 0.001). Vittoria was the only site where there was a significant (P < 0.01) response difference between experiments (E1 pHCa = 4.33–0.017 × year; R2 = 0.24 vs E2 pHCa = 4.59–0.044 × year; R2 = 0.66)
Soil pHCa declined across all sites with time (pHCa = 4.88–0.066 × year; R2 = 0.21; P < 0.001). The rate of decline was greater (P < 0.01) in E2 (pHCa = 4.91–0.073 × year; R2 = 0.25) than in E1 (pHCa = 4.86–0.060 × year; R2 = 0.17). While Mt David, Neville, and Black Springs responded similarly, Vittoria showed the greatest decline (pHCa = 5.21–0.090 × year; R2 = 0.24; P < 0.001), followed by Browns Creek (pHCa = 4.90–0.074 × year; R2 = 0.21). At Vittoria, linear regression with time (P < 0.01) showed that the pHCa response to lime did not start to decline until 1984, whereas the decline began earlier at other sites (Table 2).
| Year | Mt David | Vittoria | Browns Creek | Neville | Black Springs | ||||||
|---|---|---|---|---|---|---|---|---|---|---|---|
| Slope | t pr. | Slope | t pr. | Slope | t pr. | Slope | t pr. | Slope | t pr. | ||
| 1980 | 0.238 | 0.276 | 0.359 | 0.254 | 0.365 | 0.126 | 0.290 | 0.412 | 0.236 | 0.004 | |
| 1981 | 0.191 | <0.001 | 0.345 | 0.549 | 0.279 | 0.002 | 0.232 | <0.001 | 0.201 | <0.001 | |
| 1982 | 0.186 | <0.001 | 0.307 | 0.146 | 0.282 | 0.003 | 0.197 | <0.001 | 0.190 | <0.001 | |
| 1983 | 0.176 | <0.001 | 0.320 | 0.461 | 0.272 | <0.001 | 0.200 | <0.001 | 0.174 | <0.001 | |
| 1984 | 0.135 | <0.001 | 0.233 | <0.001 | 0.199 | <0.001 | 0.143 | <0.001 | 0.146 | <0.001 | |
| 1985 | 0.112 | <0.001 | 0.224 | <0.001 | 0.152 | <0.001 | 0.127 | <0.001 | 0.126 | <0.001 | |
| 1986 | 0.102 | <0.001 | 0.200 | <0.001 | 0.138 | <0.001 | 0.104 | <0.001 | 0.127 | <0.001 | |
| 1987 | 0.099 | <0.001 | 0.123 | <0.001 | 0.125 | <0.001 | 0.116 | <0.001 | 0.129 | <0.001 | |
| 1988 | 0.104 | <0.001 | 0.135 | <0.001 | 0.120 | <0.001 | 0.093 | <0.001 | 0.106 | <0.001 | |
| 1989 | 0.088 | <0.001 | 0.130 | <0.001 | 0.102 | <0.001 | 0.077 | <0.001 | 0.103 | <0.001 | |
Across all sites, the effect of lime rate on ECEC was significant (P < 0.001) in all years, with the three highest lime rates generally resulting in larger ECEC values (>4.3 cmol/kg soil) compared with nil lime (3.73 cmol/kg soil) in E1 (Table 3). Where significant responses were recorded, ECEC values on lime applied at 5 t/ha always exceeded the value measured where only 2.5 t/ha was applied. The effect of lime on ECEC diminished over time with fewer instances of significant differences between limed and unlimed treatments in the final years of experimentation, 1987–1989 (Table 3).
| Site | Experiment | ECEC | Ca | Mg | K | Al | P | |
|---|---|---|---|---|---|---|---|---|
| Mt David | 1 | Mostly 2,3,4 > 0 Always 4 > 3 Fewer rates >0 in 1987–1989 | Mostly 2,3,4 > 0 | Mostly 4 > 0 | Range of responses in 5 years where K declined – Phase I | 2,3,4 < 0 | n.s. | |
| 2 | Mostly 3,4 > 0 Always 4 > 3 | Mostly 1,2,3,4 > 0 | Mostly 1,2,3,4 > 0 | Range of responses in 5 years where K declined – Phase I | 2,3,4 < 0 in 1985–1987, 1989 3,4 < 0 in 1984, 1988 | Mostly 2,3,4 < 0 | ||
| Vittoria | 1 | Mostly 2,3,4 > 0 Always 4 > 3 Fewer rates >0 in 1987–1989 | Mostly 1,2,3,4 > 0 | Mostly 4 > 0 | n.s. | Mostly 1,2,3,4 < 0 | No clear trends | |
| 2 | Mostly 2,3,4 > 0 Fewer rates >0 in 1988–1989 Always 4 > 3 | Range of responses 1,2,3,4 > 0 earlier 3,4 > 0 later | Mostly 3,4 > 0 | n.s. | Mostly 1,2,3,4 < 0 3,4 < 0 in 1987–1989 | No clear trends | ||
| Browns Creek | 1 | Mostly 2,3,4 > 0 Always 4 > 3 Fewer rates >0 in 1987–1989 | Mostly 2,3,4 > 0 Fewer rates >0 in 1987–1989 | Mostly 4 > 0 | n.s. | Mostly 2,3,4 < 0 | No clear trends | |
| 2 | Mostly 2,3,4 > 0 Fewer rates >0 in 1988–1989 Always 4 > 3 | Mostly 2,3,4 > 0 Fewer rates >0 in 1987–1989 | Mostly 3,4 > 0 | Single response where K increased – Phase I | Mostly 1,2,3,4 < 0 in Phase I | Mostly 3,4 < 0 | ||
| Neville | 1 | Mostly 2,3,4 > 0 Always 4 > 3 Fewer rates >0 in 1987–1989 | Mostly 1,2,3,4 > 0 | Mostly 1,2,3,4 > 0 | Range of responses in 3 years where K declined – Phase I | 1,2,3,4 < 0 | n.s. | |
| 2 | Mostly 2,3,4 > 0 Fewer rates >0 in 1988–1989 Always 4 > 3 | Mostly 1,2,3,4 > 0 | Mostly 2,3,4 > 0 | Range of responses in 3 years where K declined – mostly Phase I | Mostly 3,4 < 0 in Phase II | 3,4 < 0 in 1984 4 < 0 in 1985 | ||
| Black Springs | 1 | Mostly 2,3,4 > 0 Always 4 > 3 Fewer rates >0 in 1987–1989 | Mostly 1,2,3,4 > 0 Fewer rates >0 in 1987–1989 | Mostly 3,4 > 0 | Two responses where K increased – Phase I | Mostly 1,2,3,4 < 0 | 3,4 < 0 | |
| 2 | Mostly 3,4 > 0 Always 4 > 3 | Range of responses | Mostly 2,3,4 > 0 | n.s. | Mostly 1,2,3,4 < 0 | n.s. |
Rates of lime application: 0 = nil; 1 = 0.63 t/ha; 2 = 1.25 t/ha; 3 = 2.5 t/ha; 4 = 5.0 t/ha.
n.s., not significant (P > 0.05).
In most years, the exchangeable Ca levels on unlimed soil were generally less than where 1.25 t/ha or more lime was applied at Mt David and Browns Creek, and 0.63 t/ha or more applied at the other sites in E1 (Table 3). In E2, the responses were more varied, especially at Vittoria and Black Springs, though Ca levels where lime was applied (irrespective of rate) generally exceeded nil lime levels at Mt David and Neville. Towards the end of both E1 and E2, only the higher lime application rates at each site maintained higher Ca values than the nil lime treatments.
The limestone sourced from Bathurst averaged 1.5–2.0% Mg and the effect of lime rate on exchangeable Mg was significant in most years. The highest lime rate generally resulted in greater exchangeable Mg values than the nil lime treatment. Larger responses were evident at Neville in E1 and Mt David in E2 where exchangeable Mg levels at all lime application rates significantly exceeded levels on the nil lime rate (Table 3). Vittoria and Black Springs were the least responsive sites. Responses in E2 were greater than in E1.
Exchangeable K was largely unaffected by lime rate, but where responses were significant, exchangeable K generally declined (Table 3). This response was particularly evident at Mt David and Neville, whereas at Vittoria there was no evidence of any response in exchangeable K attributable to lime. Most of the K responses to lime application occurred during the early phase of the experiment.
Lime application decreased exchangeable Al (P < 0.001) in all years at all sites (Table 3) to a range of 1.15–0.21 cmol/kg soil. The decline was greatest at Vittoria and Black Springs where exchangeable Al was generally lower at all rates of lime compared to the nil lime treatment. However, even at the least responsive site (Mt David), exchangeable Al values at the two highest lime rates were always significantly lower than the control. The response did not change over time.
For all sites, application of 1.25 t lime/ha halved Al saturation, and the 2.5 t/ha rate decreased Al saturation to less than one-fifth of its initial values. Lime at the highest rate (5 t/ha) decreased Al saturation effectively to zero at 2 years after application (Fig. 5a).
Effect of lime rate on the decrease on (a) Al saturation (see Fig. 4a for legend) and (b) the relationship between %Al saturation and pHCa in E1 for the five experimental sites 2 years after application of lime (1980).
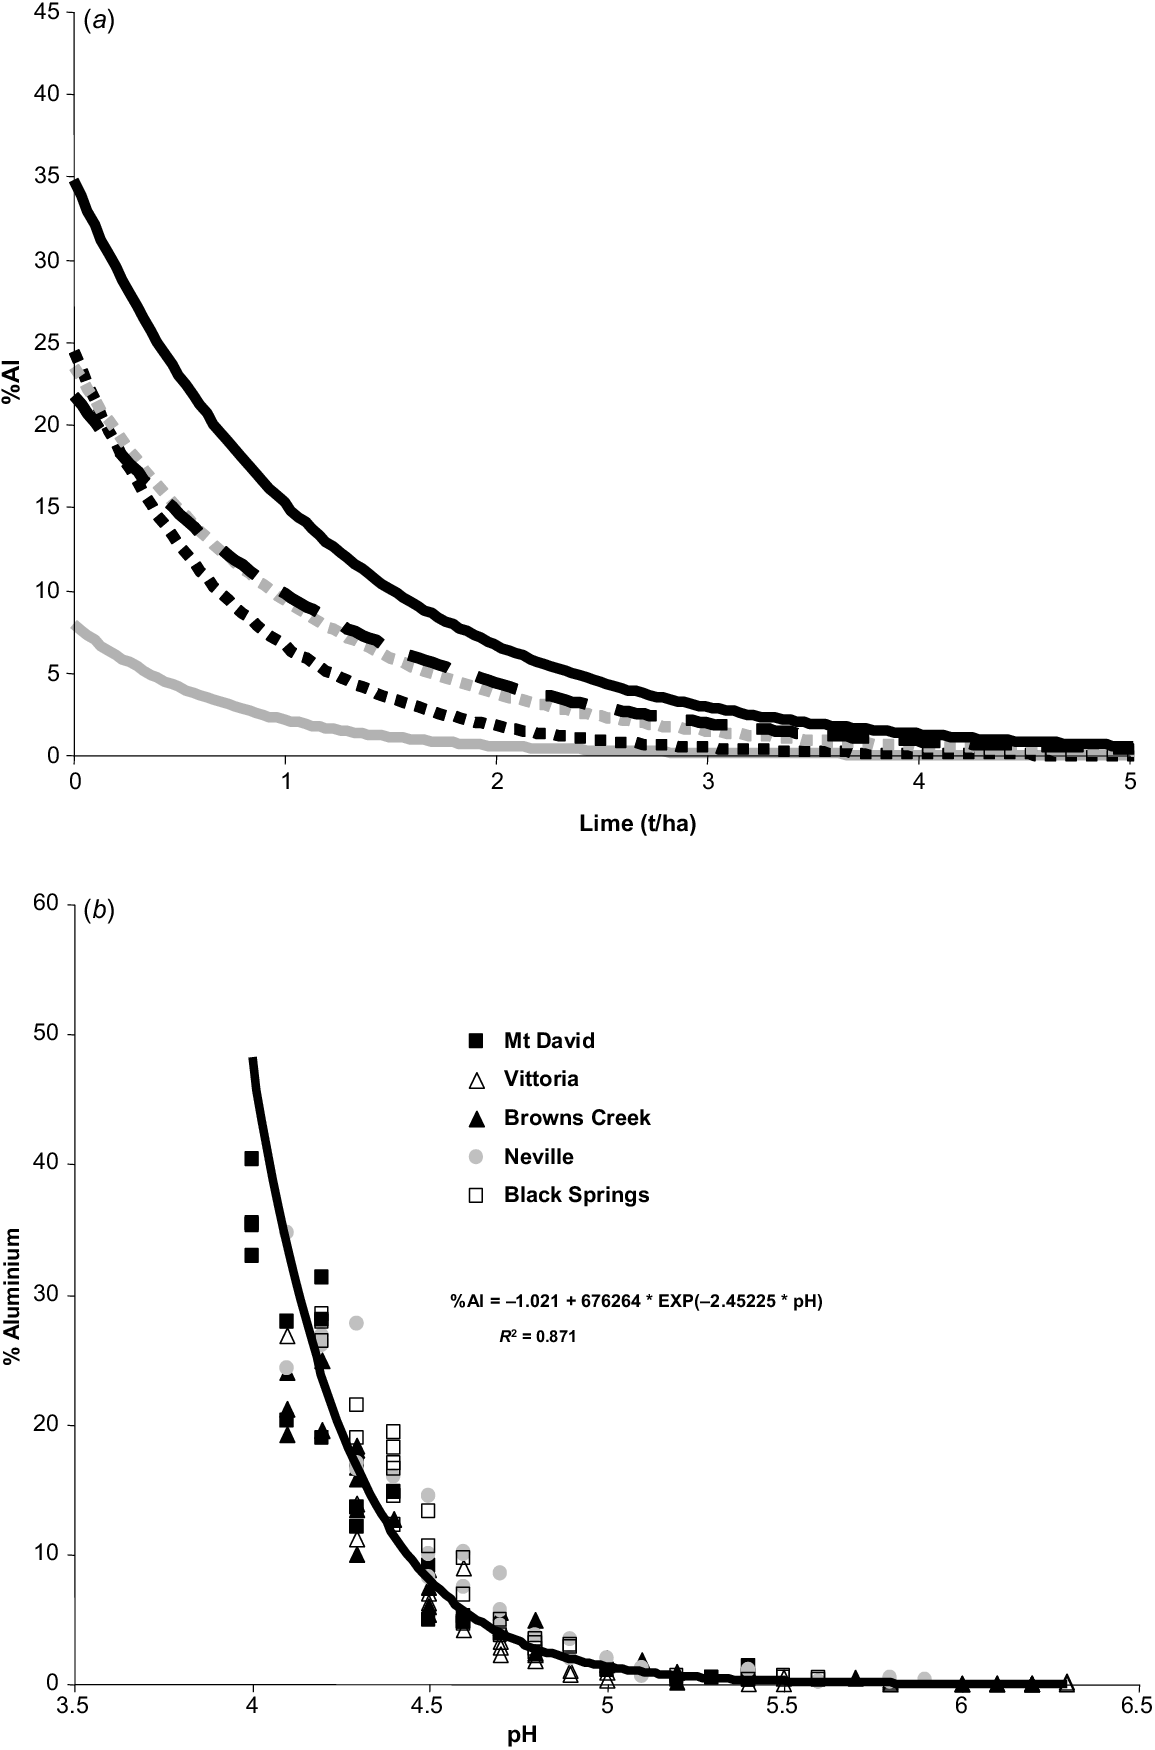
For the duration of the experiment, significant (P < 0.001) differences in Al saturation occurred between the lime rates, except in 1979 and 1980 where there was no significant difference between 2.5 and 5.0 t/ha lime, and in 1989 between 0.63 and 1.25 t/ha lime. In both E1 and E2, the early results showed no differences in Al saturation between 2.5 and 5.0 t/ha lime. There was no significant difference between nil and 0.63 t/ha lime in E1 in 1987. In E2, there were no significant differences in 1984 and 1987 (0.63 and 1.25 t/ha), 1988 (nil and 0.63 t/ha), and 1989 (nil, 0.63, and 1.25 t/ha). Black Springs was the most responsive site over time, with differences (P < 0.001) in %Al occurring in all years except for between the two highest rates in 1979. There were no differences between nil and 0.63 t/ha rates in E1 at Mt David in any year. For the other sites, this comparison was only significant until 1984.
In E1, there was a strong inverse relationship between pHCa and Al saturation (Fig. 5b). Sites responded differently (P < 0.001) and formed two groups; (1) Browns Creek, Neville and Black Springs, which all responded similarly; and (2) Mt David and Vittoria, which followed a different trend. Ten percent Al saturation occurred at a lower pHCa level for the Vittoria site (pHCa 4.3) compared to the Neville and Black Springs sites (pHCa 4.5).
There were no clear overall effects of lime application on Bray-1 P levels (Table 3). However, where the responses were significant, Bray-1 P declined as lime rate increased. The response was more evident in E2, particularly at Mt David (decreased from 39.3 mg P/kg to 24.6 mg P/kg) and Browns Creek (decreased from 21.2 mg P/kg to 16.1 mg P/kg).
Effect of superphosphate
Over all sites and both experiments, annual applications of SSP were associated with small but significant (P < 0.01) reductions in soil pHCa (4.497, 4.455, and 4.439 for nil, 125, and 250 kg superphosphate/ha, respectively; lsd0.05 = 0.038). However, there was no significant effect of SSP on soil pHCa until 1986 (P < 0.05), with differences also observed in 1988 and 1989 (P < 0.001). A reduction in pHCa was observed in 1987 but only in E2 (P < 0.05). Application of SSP significantly increased the rate of decline of pHCa over time (P < 0.05) at all sites compared to the nil SSP control (Fig. 4b), with both SSP rates behaving similarly.
Where responses were significant, exchangeable Al was increased by SSP application, particularly between rates P0 and P1 (0.65–0.72 cmol Al/kg soil) and P2 (0.75 cmol Al/kg soil). Most responses only became apparent from 1985, with two-thirds of significant responses (P < 0.05) occurring between 1987 and 1989. At the most responsive sites (Mt David and Neville), differences were detected sooner. Black Springs was the least responsive site, and there was little difference in the number of significant responses between E1 and E2.
Annual application of SSP significantly (P < 0.01) increased soil %Al values (17.01, 18.72, and 18.84% Al for P0, P1, and P2, respectively; lsd0.05 = 1.23). Significant increases in %Al due to SSP application were observed in 1986 (P < 0.05), 1988 (P < 0.01) and 1989 (P < 0.05). There were no significant differences between the two SSP application rates.
The effect of SSP on ECEC was mostly non-significant, but where significant responses occurred, these were mainly at Vittoria in E2 (five instances) and Black Springs in E1 (six instances). Response of ECEC was negative at Vittoria (P0 5.77 vs P2 5.49 cmol/kg) and positive in all other instances where most of the responses were between P0 and P2. Most of the responses occurred during the latter part of the experiment.
Where responses were significant, exchangeable Ca was generally increased by SSP application, but mainly at the highest SSP rate (P0 3.03 vs P2 3.26 cmol/kg of Ca). The response in E1 (3.12–3.42 cmol/kg of Ca) was greater than in E2 (2.82–2.99 cmol/kg of Ca) where the Mt David and Browns Creek sites exhibited a nil response. The most responsive site was Black Springs. Close to half the significant responses occurred during 1987–1989.
Where responses were significant, exchangeable Mg was decreased by SSP application (P0 0.56 vs P1 0.49 cmol Mg/kg; SP2 0.46 cmol Mg/kg). The effect was observed sooner (1981) at the Neville and Mt David sites, compared with 1984 and 1985 for Browns Creek and Black Springs, respectively. There was little difference between E1 and E2.
SSP application was associated with decreased exchangeable K as early as 1980 and this effect was maintained for the duration of the experiment, although effects at Browns Creek and Black Springs did not appear until later in the experiment. Most of the response was between P0 and P1 (0.51–0.38 cmol K/kg); although, where this difference was highly significant, there were further significant declines between P1 and P2 (0.33 cmol K/kg). Responses in E1 and E2 were similar.
For all sites and both experiments there were no significant differences in the 1979 Bray P values between SSP treatments. Subsequent sequential increases in Bray P in response to SSP application rates were evident in E2 at all sites from 1981 (12.5, 22.7, and 40.3 mg P/kg). In E1, most significant responses were sequential (13.5, 20.6, and 35.3 mg P/kg) except at Mt David where from 1984 there were no significant differences in Bray P between P0 and P1. Most responses were highly significant (P < 0.001).
Plant responses to lime and superphosphate application
Significant increases in annual DM production by lime were recorded at Mt David and Neville (P < 0.001), and at Black Springs in E1 (P < 0.05) and in E2 (P < 0.01) (Table 4). When experiments were combined, a site effect for these three sites was significant. Further, when combined over sites, significant lime effects were apparent: E1 (P < 0.05); E2 (P < 0.001); and E1 + E2 (P < 0.001). The positive lime responses recorded in E2 were primarily due to the 5.0 t/ha rate at the intermediate level of SSP (L4 at P1) at Mt David and Neville (P < 0.05), while at Black Springs the response was a little more complex (P < 0.01). The only significant L × SSP interaction in E1 occurred at Black Springs where lime (L1, L4) tended to depress DM production at P1. The increase in annual DM resulting from application of SSP was practically universal across all sites and experiments (P < 0.001).
| Site | Experiment | Lime (L) | L × time | Phosphorus (P) | P × time | L × P | L × P × time | |
|---|---|---|---|---|---|---|---|---|
| All Sites | 1 and 2 | *** | −*L4 | *** | +** P1, +*** P2 | n.s. | n.s. | |
| 1 | * | n.s. | *** | n.s. | n.s. | n.s. | ||
| 2 | *** | n.s. | *** | +* P1, +*** P2 | +*L4.P1 | n.s. | ||
| Mt David | 1 and 2 | *** | −*L4 | *** | +** P1, +*** P2 | +*L1-4.P1 | n.s. | |
| 1 | ns | ns | *** | +*** P2 | n.s. | n.s. | ||
| 2 | *** | −*L4 | *** | +** P2 | +*L4.P1 | n.s. | ||
| Vittoria | 1 and 2 | n.s. | n.s. | *** | n.s. | n.s. | n.s. | |
| 1 | n.s. | n.s. | *** | n.s. | n.s. | n.s. | ||
| 2 | n.s. | n.s. | *** | +* P2 | n.s. | n.s. | ||
| Browns Creek | 1 and 2 | n.s. | n.s. | *** | +* P2 | n.s. | n.s. | |
| 1 | n.s. | n.s. | *** | n.s. | n.s. | n.s. | ||
| 2 | n.s. | n.s. | *** | +** P1, +*** P2 | n.s. | n.s. | ||
| Neville | 1 and 2 | *** | −*L4 | *** | n.s. | n.s. | n.s. | |
| 1 | n.s. | n.s. | *** | n.s. | n.s. | n.s. | ||
| 2 | *** | −*** L3, L4 | *** | n.s. | +*L4.P1 | n.s. | ||
| Black Springs | 1 and 2 | ** | n.s. | n.s. | n.s. | n.s. | n.s. | |
| 1 | * | n.s. | *** | n.s. | −*L1,4.P1 | +*L2.P2 | ||
| 2 | ** | n.s. | *** | +* P1, +** P2 | +**L3.P2,L4.P1,2 | n.s. |
For each site and experiment (E1, E2), splines were fitted to annual herbage mass, then lime and phosphorus respectively added to the spline.
*P < 0.05; **P < 0.01; ***P < 0.001;
n.s., not significant (P > 0.05).
Lime remained effective in promoting DM growth except at Mt David and Neville in E2 where effectiveness of the higher application rates declined over time relative to the zero rate (P < 0.05; P < 0.001, respectively). Where there was a site effect (E1 + E2), the decline in annual DM response over time also only occurred at the highest lime rate at Mt David and Neville (P < 0.05). Over all sites and experiments, annual DM response declined over time (P < 0.05), but only at the highest lime rate (Table 4).
Over all sites and experiments, annual DM increases due to SSP were significant (P1, P < 0.01; P2, P < 0.001; Table 4). There were no significant SSP × time interactions in E1, except at Mt David at the highest rate of SSP (P < 0.001; Table 4). In E2, significant increases in DM response over time occurred at both rates of SSP at Browns Creek (P1, P < 0 .01 and P2, P < 0.001) and Black Springs (P1, P < 0.05; P2, P < 0.01), and at the highest rate at Mt David (P < 0.01) and Vittoria (P < 0.05). Where there was a site effect, the DM response increased over time at both SSP rates compared to zero SSP at Mt David (P1, P < 0.01; P2, P < 0.001), and at the heaviest SSP rate at Browns Creek (P < 0.05).
A total of 87 harvests was taken on the cocksfoot pastures (E1) and 68 on the subterranean clover pastures (E2) from the five sites. Significant DM responses to lime were more evident in E2 than in E1 (Fig. 3). Mt David and Neville were the most lime responsive sites, while Vittoria was the least. In E1, the proportion of responses was similar in the early and late phases of the experiment. However, there was a proportionally greater number of positive responses during the early phase of the experiment in E2 (Fig. 3). Harvests were taken when differences in growth were visible. Consequently, harvests tend to overlap with periods of favourable rainfall, especially during spring. The absence of harvests in 1982–1983 for both experiments was due to a protracted drought, and in E2 in 1988, when the pasture was modified and reseeded to subterranean clover. Superphosphate application generally increased DM for all harvests (Fig. 3), except at the start of the experiment. Analysis using untransformed data indicated that significant lime × SSP interactions occurred in four instances in E1 and in 14 instances in E2. However, data were skewed, and a log transformation of the data reduced the number of significant interactions from 18 to 10. Vittoria was again the least responsive site.
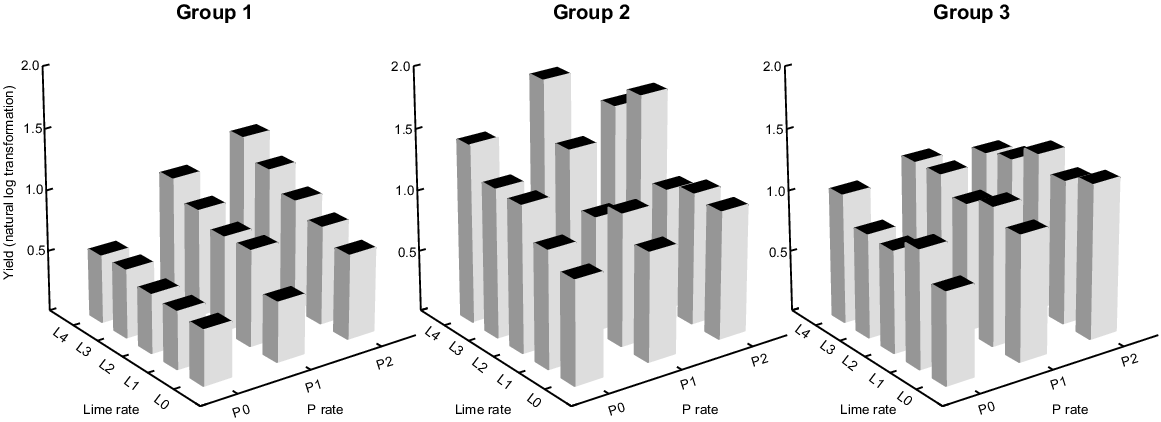
Grouping of significant responses on the basis of non-significant harvest × lime × SSP interactions resulted in the formation of three groups with similar responses to lime and SSP (Fig. 6). In Group 1, there was a positive DM response to lime at the higher levels of SSP, and a positive DM response to SSP at each lime rate. Most of the SSP response occurred between P0 and P1. Most of these responses occurred at Mt David (n = 4) but also at Neville and Black Springs, and most responses were in E2. Group 2 was represented by E2 at Browns Creek and Neville, lime rate increased DM at the lowest rate of SSP, but at the higher rates of SSP, this effect was only evident at the two highest lime rates. Group 3 was represented by E1 at Browns Creek and Neville, and showed a limited lime effect where lime tended to decrease the DM response particularly at the higher rates of SSP.
Patterns of DM response to lime and superphosphate (P) application where lime × superphosphate interactions were significant (n = 10). Similar responses (non-significant sample × L × P interactions) resulted in formation of three groups representing six, two, and two samplings for Groups 1, 2 and 3 respectively. Group 1 comprised harvests from Mt David, Black Springs, and Browns Creek. Group 2 comprised harvests from E2 from Browns Creek and Neville. Group 3 comprised harvests from E1 from Browns Creek and Neville. Responses described are mean responses for each group.
Trends in botanical composition (1987–1990)
The significance of the effect of lime and SSP rate on the proportion of the various pasture components, together with the percentages at L0 and P0 levels and the mean values for each experiment and site are in Tables 5 and 6. Also included is mean DM. Comparisons showing significant trends are only discussed further if mean DM exceeded 0.1 t/ha. Species composition across sites was variable as indicated by the significant (P < 0.001) site × species interaction.
| Site | Component | 1987 | 1990 | |||||||||||||
|---|---|---|---|---|---|---|---|---|---|---|---|---|---|---|---|---|
| Mean | L | P | L × P | Mean | L | P | L × P | |||||||||
| kg/ha | % | Significance | Nil L % | Significance | Nil P % | Significance | kg/ha | % | sig | Nil L % | Significance | Nil P % | Significance | |||
| Mt David | Dactylis glomerata | 1297 | 32.2 | n.s. | 28.3 | n.s. | 34.7 | n.s. | 1712 | 51.5 | n.s. | 49.6 | n.s. | 45.4 | n.s. | |
| Lolium perenne | 328 | 7.4 | n.s. | 6.6 | + * | 3.9 | n.s. | 125 | 4.3 | n.s. | 1.5 | n.s. | nsd | n.s. | ||
| Microlaena stipoides | 0 | 0 | n.s. | 0 | n.s. | 0 | n.s. | 1 | 0.0 | n.s. | 0 | n.s. | nsd | n.s. | ||
| Vulpia spp. | 238 | 8.9 | ^ * | 5.8 | − *** | 23.6 | * | 53 | 2.4 | n.s. | 1.33 | − ** | 5.0 | n.s. | ||
| Trifolium repens | 392 | 8.4 | n.s. | 8 | + ** | 1.2 | n.s. | 11 | 0.6 | n.s. | 0 | − * | 1.9 | n.s. | ||
| Trifolium subterraneum | 1459 | 33.7 | n.s. | 37.3 | + ** | 24.8 | n.s. | 847 | 24.3 | n.s. | 27.4 | + *** | 10.2 | n.s. | ||
| Hypochaeris radicata | 53 | 2.6 | n.s. | 4.5 | − *** | 7.7 | n.s. | 140 | 8.0 | n.s. | 10.4 | − *** | 23.0 | n.s. | ||
| Rumex acetosella | 193 | 4.3 | − ** | 7.2 | + ** | 2.2 | n.s. | 259 | 8.6 | n.s. | 9.7 | n.s. | 8.2 | n.s. | ||
| Vittoria | D. glomerata | 2029 | 53.5 | n.s. | 51.5 | − *** | 70.7 | n.s. | 2239 | 67.2 | n.s. | 55.2 | + *** | 51.9 | n.s. | |
| L. perenne | 0 | 0 | n.s. | 0 | n.s. | 0 | n.s. | 16 | 0.4 | n.s. | 1.0 | n.s. | 0.1 | n.s. | ||
| M. stipoides | 0 | 0 | n.s. | 0 | n.s. | 0 | n.s. | 131 | 6.6 | − *** | 13.0 | − *** | 19.6 | *** | ||
| Vulpia spp. | 130 | 5.1 | n.s. | 5.4 | − ** | 10.9 | n.s. | 9 | 0.5 | n.s. | 1.2 | − * | 1.4 | n.s. | ||
| T. repens | 0 | 0 | n.s. | 0 | n.s. | 0 | n.s. | 0 | 0 | n.s. | 0 | n.s. | 0 | n.s. | ||
| T. subterraneum | 2012 | 37.8 | n.s. | 37.7 | + *** | 7.8 | n.s. | 590 | 18.1 | n.s. | 24.1 | ^ ** | 8.9 | n.s. | ||
| H. radicata | 43 | 3.1 | n.s. | 4.4 | − *** | 9.3 | n.s. | 114 | 5.5 | n.s. | 5.5 | − *** | 15.5 | n.s. | ||
| R. acetosella | 4 | 0.1 | n.s. | 0.4 | n.s. | 0 | n.s. | 2 | 0.1 | n.s. | 0 | n.s. | 0 | n.s. | ||
| Browns Creek | D. glomerata | 2169 | 53.0 | n.s. | 48.8 | + ** | 43.4 | n.s. | 334 | 53.7 | n.s. | 47.2 | n.s. | 43.4 | n.s. | |
| L. perenne | 295 | 7.4 | n.s. | 11.3 | n.s. | 8.4 | n.s. | 77 | 14.0 | n.s. | 24.7 | n.s. | 18.9 | n.s. | ||
| M. stipoides | 0 | 0 | n.s. | 0 | n.s. | 0 | n.s. | 0 | 0 | n.s. | 0 | n.s. | 0 | n.s. | ||
| Vulpia spp. | 25 | 0.7 | n.s. | 0.4 | − * | 1.9 | n.s. | 1 | 0.2 | n.s. | 0.4 | n.s. | 0.3 | n.s. | ||
| T. repens | 0 | 0 | n.s. | 0 | n.s. | 0 | n.s. | 1 | 0.2 | n.s. | 0 | n.s. | 0.6 | n.s. | ||
| T. subterraneum | 1406 | 35.5 | n.s. | 34.8 | − *** | 42.9 | * | 41 | 5.9 | + * | 4.6 | n.s. | 4.2 | ** | ||
| H. radicata | 5 | 0.2 | n.s. | 0.1 | n.s. | 0.4 | n.s. | 61 | 12.5 | + * | 8.9 | − * | 20.9 | n.s. | ||
| R. acetosella | 38 | 1.0 | n.s. | 1.9 | n.s. | 0.4 | n.s. | 47 | 7.8 | n.s. | 7.8 | n.s. | 3.6 | n.s. | ||
| Neville | D. glomerata | 2397 | 54.9 | n.s. | 47.7 | n.s. | 54.3 | * | 1291 | 81.8 | n.s. | 74.1 | + ** | 70.0 | n.s. | |
| L. perenne | 48 | 1.6 | n.s. | 3.6 | − * | 3.2 | n.s. | 106 | 7.7 | n.s. | 15.5 | − * | 13.9 | n.s. | ||
| M. stipoides | 0 | 0 | n.s. | 0 | n.s. | 0 | n.s. | 0 | 0 | n.s. | 0 | n.s. | 0 | n.s. | ||
| Vulpia spp. | 86 | 3.4 | n.s. | 8.8 | − ** | 9.5 | n.s. | 12 | 0.7 | n.s. | 1.1 | n.s. | 0.7 | n.s. | ||
| T. repens | 6 | 0.1 | n.s. | 0.2 | n.s. | 0.2 | n.s. | 0 | 0 | n.s. | 0 | n.s. | 0 | n.s. | ||
| T. subterraneum | 1539 | 33.5 | n.s. | 30.7 | + *** | 18.8 | n.s. | 93 | 5.9 | n.s. | 5.2 | n.s. | 5.4 | n.s. | ||
| H. radicata | 128 | 4.8 | n.s. | 6.9 | − *** | 13.2 | n.s. | 50 | 3.8 | n.s. | 4.2 | − *** | 9.8 | n.s. | ||
| R. acetosella | 70 | 1.5 | n.s. | 1.7 | n.s. | 0.7 | n.s. | 1 | 0.0 | n.s. | 0 | n.s. | 0.1 | n.s. | ||
| Black Springs | D. glomerata | 2100 | 74.3 | n.s. | 71.8 | n.s. | 77.8 | n.s. | 952 | 47.2 | + * | 38.0 | n.s. | 46.9 | n.s. | |
| L. perenne | 96 | 3.5 | n.s. | 3.7 | n.s. | 3.9 | n.s. | 171 | 8.9 | − * | 16.2 | − * | 12.6 | n.s. | ||
| M. stipoides | 0 | 0 | n.s. | 0 | n.s, | 0 | n.s. | 0 | 0 | n.s. | 0 | n.s. | 0 | n.s. | ||
| Vulpia spp. | 3 | 0.1 | n.s. | 0.2 | n.s. | 0.3 | n.s. | 1 | 0.1 | n.s. | 0 | n.s. | 0.2 | n.s. | ||
| T. repens | 0 | 0 | n.s. | 0 | n.s. | 0 | n.s. | 35 | 1.8 | n.s. | 3.3 | + * | 0.4 | n.s. | ||
| T. subterraneum | 463 | 16.2 | n.s. | 16.7 | + ** | 11.8 | n.s. | 426 | 21.8 | n.s. | 14.3 | − * | 27.9 | n.s. | ||
| H. radicata | 37 | 1.8 | n.s. | 2.5 | − ** | 4.3 | n.s. | 18 | 1 | n.s. | 0.2 | − *** | 2.8 | * | ||
| R. acetosella | 111 | 3.9 | n.s. | 5.0 | + ** | 1.3 | n.s. | 369 | 17.8 | − * | 26.8 | + *** | 7 | n.s. | ||
***P < 0.001; **P < 0.01; *P < 0.05; n.s., not significant (P < 0.05).
Direction of response: –, decrease with increasing rates; +, increase with increasing rate; ^, middle rates are greater.
% refers to composition of aboveground biomass for individual species.
| Site | Component | 1987 | 1990 | |||||||||||||
|---|---|---|---|---|---|---|---|---|---|---|---|---|---|---|---|---|
| Mean | L | P | L × P | Mean | L | P | L × P | |||||||||
| kg/ha | % | Significance | Nil L % | Significance | Nil P % | Significance | kg/ha | % | Significance | Nil L % | Significance | Nil P % | Significance | |||
| Mt David | Phalaris aquatica | 28 | 0.7 | n.s. | 0.8 | n.s. | 0.6 | n.s. | 0 | 0.0 | n.s. | 0.0 | n.s. | 0.0 | n.s. | |
| Lolium perenne | 191 | 4.1 | + * | 2.8 | + *** | 0.9 | n.s. | 6 | 0.2 | n.s. | 0.4 | n.s. | 0.1 | n.s. | ||
| Vulpia spp. | 423 | 12.0 | − * | 18.4 | − *** | 19.5 | n.s. | 137 | 3.6 | n.s. | 4.9 | n.s. | 3.5 | n.s. | ||
| Medicago sativa | 195 | 4.1 | + *** | 1.3 | + *** | 1.2 | * | 2 | 0.1 | n.s. | 0.0 | n.s. | 0.2 | n.s. | ||
| Trifolium repens | 183 | 4.0 | n.s. | 4.5 | n.s. | 0.4 | * | 800 | 20.3 | n.s. | 14.5 | n.s. | 12.4 | n.s. | ||
| Trifolium subterraneum | 2936 | 73.4 | n.s. | 70.8 | n.s. | 75.2 | n.s. | 2337 | 58.4 | n.s. | 56.7 | n.s. | 58.4 | n.s. | ||
| Rumex acetosella | 21 | 0.5 | n.s. | 0.7 | n.s. | 0.5 | n.s. | 557 | 13.4 | − * | 21.7 | n.s. | 15.6 | * | ||
| Hypochaeris radicata | 7 | 0.3 | n.s. | 0.2 | − ** | 0.8 | n.s. | 90 | 3.1 | n.s. | 0.8 | − ** | 8.4 | n.s. | ||
| Vittoria | P. aquatica | 43 | 1.0 | n.s. | 1.0 | n.s. | 0.0 | n.s. | 3 | 0.1 | n.s. | 0.0 | n.s. | 0.4 | n.s. | |
| L. perenne | 127 | 2.6 | n.s. | 6.2 | + * | 0.0 | n.s. | 5 | 0.3 | n.s. | 0.0 | n.s. | 0.5 | n.s. | ||
| Vulpia spp. | 456 | 17.8 | n.s. | 14.3 | − *** | 37.2 | n.s. | 26 | 1.5 | n.s. | 1.4 | − *** | 4.4 | n.s. | ||
| M. sativa | 111 | 2.7 | + *** | 1.1 | + * | 1.1 | ** | 0 | 0.0 | n.s. | 0.0 | n.s. | 0.0 | n.s. | ||
| T. repens | 0 | 0.0 | n.s. | 0.0 | n.s. | 0.0 | n.s. | 0 | 0.0 | n.s. | 0.0 | n.s. | 0.0 | n.s. | ||
| T. subterraneum | 2742 | 69.4 | n.s. | 70.9 | + *** | 44.7 | n.s. | 2990 | 90.4 | n.s. | 87.1 | + *** | 72.2 | n.s. | ||
| R. acetosella | 0 | 0.0 | n.s. | 0.0 | n.s. | 0.0 | n.s. | 0 | 0.0 | n.s. | 0.0 | n.s. | 0.0 | n.s. | ||
| H. radicata | 97 | 5.8 | n.s. | 5.4 | − *** | 17.1 | n.s. | 98 | 6.0 | − ** | 9.3 | − *** | 18.1 | ** | ||
| Browns Creek | P. aquatica | 66 | 1.4 | n.s. | 2.0 | n.s. | 1.4 | n.s. | ||||||||
| L. perenne | 2 | 0.0 | n.s. | 0.0 | n.s. | 0.0 | n.s. | |||||||||
| Vulpia spp. | 1198 | 27.7 | n.s. | 34.3 | − *** | 43.4 | n.s. | |||||||||
| M. sativa | 72 | 1.6 | + ** | 0.2 | n.s. | 1.3 | n.s. | |||||||||
| T. repens | 0 | 0.0 | n.s. | 0.0 | n.s. | 0.0 | n.s. | |||||||||
| T. subterraneum | 3093 | 64.1 | n.s. | 59.1 | + ** | 50.8 | n.s. | |||||||||
| R. acetosella | 85 | 1.7 | n.s. | 2.0 | + ** | 0.4 | n.s. | |||||||||
| H. radicata | 46 | 1.1 | n.s. | 1.6 | − ** | 2.5 | n.s. | |||||||||
| Neville | P. aquatica | 183 | 6.7 | n.s. | 6.4 | − *** | 11.8 | * | ||||||||
| L. perenne | 1 | 0.0 | n.s. | 0.0 | n.s. | 0.0 | n.s. | |||||||||
| Vulpia spp. | 320 | 12.2 | n.s. | 20.8 | − * | 20.6 | n.s. | |||||||||
| M. sativa | 283 | 8.1 | + *** | 0.5 | + *** | 3.5 | n.s. | |||||||||
| T. repens | 10 | 0.3 | n.s. | 0.0 | n.s. | 0.7 | n.s. | |||||||||
| T. subterraneum | 2083 | 69.3 | n.s. | 69.2 | + * | 60.7 | n.s. | |||||||||
| R. acetosella | 31 | 1.2 | − * | 1.4 | + * | 0.4 | n.s. | |||||||||
| H. radicata | 21 | 0.9 | n.s. | 0.3 | n.s. | 1.7 | n.s. | |||||||||
| Black Springs | P. aquatica | 78 | 3.2 | n.s. | 2.2 | n.s. | 4.0 | n.s. | 8 | 0.2 | ^ * | 0.0 | + ** | 0.0 | * | |
| L. perenne | 4 | 0.2 | ^ * | 0.0 | n.s. | 0.1 | ** | 10 | 0.3 | n.s. | 0.0 | n.s. | 0.0 | n.s. | ||
| Vulpia spp. | 240 | 10.6 | n.s. | 15.5 | − *** | 18.0 | n.s. | 36 | 1.1 | n.s. | 1.1 | n.s. | 0.6 | n.s. | ||
| M. sativa | 24 | 0.8 | + *** | 0.0 | n.s. | 0.7 | n.s. | 0 | 0.0 | n.s. | 0.0 | n.s. | 0.0 | n.s. | ||
| T. repens | 0 | 0.0 | n.s. | 0.0 | n.s. | 0.0 | n.s. | 150 | 4.4 | + ** | 0.6 | + * | 1.8 | n.s. | ||
| T. subterraneum | 2066 | 83.5 | n.s. | 80.0 | + *** | 75.2 | n.s. | 2435 | 78.6 | + * | 72.5 | + * | 73.9 | * | ||
| R. acetosella | 21 | 0.8 | n.s. | 1.0 | + ** | 0.3 | n.s. | 281 | 9.5 | − * | 13.9 | n.s. | 11.2 | n.s. | ||
| H. radicata | 17 | 0.8 | n.s. | 1.3 | − ** | 1.8 | n.s. | 120 | 5.2 | − *** | 11.5 | − *** | 12.5 | * | ||
Direction of response: –, decrease with increasing rates; +, increase with increasing rates; ^, middle rates are greater.
% refers to composition of aboveground biomass for individual species.
*** P < 0.001; ** P < 0.01; * P < 0.05; n.s., not significant (P > 0.05).
There was no difference in pasture composition attributable to lime at four of the five sites (Table 5). At Mt David, the proportion of Vulpia spp. increased at the intermediate rates of lime (P < 0.05), while Rumex acetosella (mean DM 0.2 t/ha) was decreased by increasing lime rate (P < 0.01).
The proportion of T. subterraneum was generally increased (P < 0.01, P < 0.001) by increasing rates of superphosphate, except at Browns Creek where it decreased (mean site DM range 0.5–2.0 t/ha). The proportions of Lolium perenne and T. repens (respective mean DM and level of significance 0.3, 0.4 t/ha; P < 0.05, P < 0.01) were significantly increased by increasing rates of SSP at Mt David but the effects were negligible at the other sites (Table 5). The proportion of R. acetosella was also increased (P < 0.01) by increasing levels of SSP at Mt David (mean DM 0.2 t/ha) and Black Springs (mean DM 0.1 t/ha).
The proportions of Vulpia spp. and Hypochaeris radicata were significantly decreased by SSP application at most sites, but only at Mt David and Vittoria (Vulpia spp.) and Neville (H. radicata) were mean DM levels > 0.1 t/ha. The proportion of D. glomerata at Vittoria was decreased (P < 0.001) by increasing SSP levels, while at Browns Creek, it was increased (P < 0.01). Mean DM of D. glomerata was 2.0–2.2 t/ha.
There were three significant interactions: (1) Vulpia spp. at Mt David; (2) T. subterraneum at Browns Creek; and (3) D. glomerata at Neville (P < 0.05). Mean DM (t/ha) were 0.2, 1.4, and 2.4, respectively. On the nil P plots, Vulpia spp. at Mt David increased with initial rates of lime but then declined under high lime rates. T. subterraneum at Browns Creek decreased with increasing lime rates, whilst D. glomerata at Neville increased with increasing lime rates.
D. glomerata remained the major component of the sward throughout Phase II at all sites and was increased (P < 0.05) by lime rate at Black Springs (mean DM 1.0 t/ha). Increasing lime rates decreased the proportions of Microlaena stipoides (P < 0.001) at Vittoria, as well as L. perenne and R. acetosella (P < 0.05) at Black Springs (mean DM 0.2, 0.4 t/ha for the Black Springs site, respectively). Mean DM of the other significant components were <0.1 t/ha.
At Mt. David and Vittoria, the proportion of T. subterraneum was significantly increased by the application of SSP, particularly at the middle rate, but declined (P < 0.05) with increasing rates of SSP at Black Springs (though DM did not decline at Black Springs). Superphosphate application increased D. glomerata at all sites but only significantly at Vittoria (P < 0.001) and Neville (P < 0.01). At Black Springs, R. acetosella increased (P < 0.001) as the rate of SSP increased, while H. radicata was significantly decreased by increasing rates of SSP at all sites, but mean DM only exceeded 0.1 t/ha at Mt David and Vittoria (P < 0.001). M. stipoides at Vittoria was also decreased (P < 0.001) by increasing SSP rate as was L. perenne at Neville and Black Springs (P < 0.05). Mean DM at these two sites was 0.1 and 0.2 t/ha, respectively.
There were three species with significant interactions, but for T. subterraneum (Browns Creek) and H. radicata (Black Springs), mean DM was <0.1 t/ha. The proportion of M. stipoides at Vittoria was decreased by lime at the nil SSP rate (mean DM 0.1 t/ha). No M. stipoides was present at the higher rates of SSP.
The proportion of M. sativa was significantly increased by increasing lime rate at all sites (P < 0.001), but mean DM only exceeded 0.1 t/ha at Mt David, Vittoria and Neville. At Mt David, L. perenne was also increased (P < 0.05) by lime rate (mean DM 0.2 t/ha), whereas Vulpia spp. was decreased (P < 0.05; mean DM 0.4 t/ha).
The proportions of M. sativa, T. subterraneum, and L. perenne were increased by SSP rate; i.e. M. sativa at Mt David, Neville (P < 0.001), and Vittoria (P < 0.05); T. subterraneum at Vittoria, Black Springs (P < 0.001), Browns Creek (P < 0.01), and Neville (P < 0.05); and L. perenne at Mt David (P < 0.001) and Vittoria (P < 0.05). Mean DM ranges (t/ha) for the three species were: 0.1–0.3; 2.1–3.1; 0.1–0.2, respectively. In contrast, Vulpia spp. was significantly decreased by increasing SSP rate at all sites; i.e. Mt David, Vittoria, Browns Creek, and Black Springs (P < 0.001); and Neville (P < 0.05). Mean DM ranged from 0.2 t/ha at Black Springs to 1.2 t/ha at Browns Creek. P. aquatica was also decreased (P < 0.001) by increasing SSP rate at Neville (mean DM 0.3 t/ha).
There were five significant interactions, but for L. perenne biomass was less than 0.1 t/ha. M. sativa increased at Mt David (P < 0.05), and Vittoria (P < 0.01) with increasing SSP and lime. T. repens at Mt David (P < 0.05) on the 125 kg P/ha was increased by only the low rates of lime. P. aquatica increased at Neville (P < 0.01) with increasing lime rates on the nil SSP plots.
T. repens (mean DM 0.2 t/ha) and T. subterraneum increased as lime rate increased at Black Springs (P < 0.05). There was a decline in the proportion of R. acetosella at Mt David (mean DM 0.3 t/ha) and Black Springs, and a decline in H. radicata at Vittoria (P < 0.01) and Black Springs (P < 0.001) as lime rate increased.
The proportion of T. subterraneum was increased by increasing rates of SSP at Vittoria (P < 0.001) and Black Springs (P < 0.05) as was T. repens at Black Springs (P < 0.05). Mean DM of T. subterraneum at Vittoria was 3.0 t/ha. Increasing rates of SSP decreased H. radicata at Mt David (P < 0.01), Vittoria and Black Springs (P < 0.001), though mean DM at all sites was <0.1 t/ha. Mean DM of Vulpia spp. at Vittoria was negligible.
As in 1987, T. subterraneum was the dominant pasture component, and at Black Springs, the proportion of T. subterraneum increased at the higher lime rates (P < 0.05) but only where SSP was not applied (mean DM 2.4 t/ha). The higher rate of SSP only increased the proportion of T. subterraneum at the nil and 0.63 t/ha rates of lime. The interaction for H. radicata was significant at Vittoria (P < 0.01) and Black Springs (P < 0.05), where H. radicata (mean DM 0.1 t/ha) was decreased by SSP application but mainly at the higher rates of lime. The L × SSP interaction for R. acetosella was significant (P < 0.05) at Mt. David, although the trends were less clear (mean DM 0.6 t/ha). The proportion of R. acetosella generally declined as the lime rate increased, but only at the nil and low SSP rates. Mean DM of P. aquatica was negligible at Black Springs.
Relationship between relative plant yield and %Al and %Ca in soil
Soil acidity parameters exhibited a strong exponential relationship between Al (as exchangeable and % of ECEC) and pHCa (Fig. 5b). The increasing %Al values at decreasing lime rates for each site is presented in Table 7.
| Year | Experiment | Rate of lime application | Site | |||||
|---|---|---|---|---|---|---|---|---|
| Mt David | Vittoria | Browns Creek | Neville | Black Springs | ||||
| 1987 | E1 | L0 | 38.0 | 23.9 | 36.3 | 20.4 | 34.1 | |
| L1 | 39.4 | 18.0 | 33.1 | 16.0 | 27.0 | |||
| L2 | 22.4 | 12.1 | 26.2 | 11.5 | 20.7 | |||
| L3 | 19.8 | 8.7 | 19.7 | 8.1 | 14.5 | |||
| L4 | 8.8 | 1.6 | 6.2 | 3.0 | 3.7 | |||
| l.s.d. | 8.7 | 6.2 | 10.2 | 7.2 | 6.8 | |||
| E2 | L0 | 32.9 | 13.6 | 27.3 | 25.3 | 32.2 | ||
| L1 | 28.1 | 10.8 | 25.0 | 18.7 | 27.2 | |||
| L2 | 23.8 | 9.5 | 22.7 | 16.2 | 23.4 | |||
| L3 | 16.4 | 4.7 | 17.1 | 14.0 | 14.3 | |||
| L4 | 8.5 | 2.1 | 4.0 | 6.9 | 5.0 | |||
| l.s.d. | 11.8 | 3.6 | 12.3A | 9.1A | 5.9 | |||
| 1989 | E1 | L0 | 52.2 | 38.5 | 43.4 | 34.7 | 53.8 | |
| L1 | 53.5 | 28.6 | 40.5 | 22.4 | 46.8 | |||
| L2 | 41.2 | 23.2 | 34.6 | 22.8 | 39.8 | |||
| L3 | 35.5 | 15.6 | 27.1 | 16.4 | 31.1 | |||
| L4 | 15.8 | 4.0 | 10.6 | 9.2 | 11.5 | |||
| l.s.d. | 8.3 | 5.9 | 6.6 | 6.4 | 5.6 | |||
| E2 | L0 | 54.2 | 35.0 | 31.9 | 37.0 | 60.0 | ||
| L1 | 45.3 | 31.5 | 32.2 | 31.2 | 55.5 | |||
| L2 | 45.3 | 29.9 | 27.5 | 40.4 | 50.7 | |||
| L3 | 33.8 | 18.8 | 22.3 | 26.6 | 38.3 | |||
| L4 | 19.8 | 7.3 | 10.9 | 16.5 | 20.4 | |||
| l.s.d. | 7.2 | 8.0 | 8.4 | 7.5 | 4.9 | |||
Values are averaged across all SSP treatments.
Rates of lime application: 0 = nil; 1 = 0.63 t/ha; 2 = 1.25 t/ha; 3 = 2.5 t/ha; 4 = 5.0 t/ha.
lsd values are at P < 0.001, except AP < 0.01.
Overall, relative annual pasture yield (derived from maximum annual yield for each site for each experiment for each year) was not affected by increasing %Al (Table 8) but was increased by %Ca (P < 0.001; Table 8). The relative annual yield response to increasing %Ca was greater (P < 0.01) in E1 compared with E2 and increased more rapidly in E1 as %Ca increased. Responses were significantly (P < 0.001) affected by site. Relative yield at Vittoria was increased with increasing %Al (P < 0.01), while at Black Springs relative yield declined with increasing %Al (P < 0.05; Table 9). Relative yield at Browns Creek and Vittoria (P < 0.001) were less responsive than the other sites to %Ca (P < 0.001; P < 0.05), respectively. These relationships were affected by year (P < 0.001), with 1981 the most responsive year for both %Al and %Ca, with relative yield decreasing and increasing significantly, respectively. The latter years of the experiment tended to be less responsive to increasing %Al. While relative yield increased (P < 0.001) with SSP application (P0 < P1 < P2), it declined at a greater rate as %Al increased on the P1 and P2 treatments (P < 0.05) compared to P0. However, for increasing %Ca, there were no significant effects between the SSP treatments on relative yield, with relative yield increasing (P < 0.001) at a similar rate for all SSP application rates.
| Relative yield by… | Increasing %Al | Increasing %Ca | |
|---|---|---|---|
| All data | n.s. | ↑↑↑ | |
| E1 vs E2 | n.s. | E2 <<< E1 E1 ↑↑↑; E2 ↑↑ | |
| Site | Vittoria ↑↑ Mt David, Browns Creek, Neville n.s. Black Springs ↓ | Mt David, Neville, Black Springs ↑↑↑ Vittoria ↑ Browns Creek n.s. | |
| Year | 81 ↓↓↓ 83, 84, 85, 88 ↓ 86, 87, 89 n.s. | 83, 87, 88, 89 ↑ 84, 85 ↑↑ 81, 86 ↑↑↑ | |
| P application | P0 <<< P125 <<< P250 P0 n.s.; P125, P250 ↓ | P0 <<< P125 <<< P250 ↑↑↑ |
Direction of response: ↑, increasing; ↓ – decreasing; n.s., no response.
Level of significance: ↑, ↓, <, or > (P < 0.05); ↑↑, ↓↓, <<, or >> (P < 0.01); ↑↑↑, ↓↓↓, <<<, or >>> (P < 0.001).
| Site | % | E1 and E2 | Experiment E2 | Experiment E2 | E1 vs E2 | |||||||
|---|---|---|---|---|---|---|---|---|---|---|---|---|
| All | By year | By P application | All | By year | By P application | |||||||
| Rates | Response | Rates | Response | |||||||||
| Mt David | Al | n.s. | ↑ | 81, 83 ↓↓ Rest n.s. | P0 <<< P125 <<< P250 | n.s. | n.s. | 81 ↓↓↓ 83–85 ↓ 86–89 n.s. | P0 <<< P125 = P250 | n.s. | E2 > E1 E1↑; E2↓ | |
| Ca | ↑↑↑ | ↑ | 81, 83–86 ↑↑↑ 87–89 n.s. | P0 <<< P125 <<< P250 | n.s. | ↑↑↑ | 81, 84, 85 ↑↑↑ 83, 86 ↑↑ 87, 89 n.s. | P0 <<< P125 = P250 | ↑↑↑ | E2 < E1 E1↑; E2↑↑ | ||
| Vittoria | Al | ↑↑↑ | ↑↑ | n.s. | P0 <<< P125 = P250 | ↑ | n.s. | n.s. | P0 <<< P125 <<< P250 | n.s. | E1 = E2 ↑↑ | |
| Ca | ↑ | n.s. | n.s. | P0 <<< P250 P0 << P125 P125 = P250 | n.s. | ↑↑ | n.s. | P0 <<< P125 <<< P250 | P0↑ P125/P250 n.s. | E2 < E1 E1 n.s.; E2↑ | ||
| Browns Creek | Al | n.s. | n.s. | 81, 83–87 ↓↓ 88, 89 n.s. | P0 <<< P125 = P250 | n.s. | n.s. | 84 ↓ Rest n.s. | P0 <<< P125 = P250 | n.s. | E2 < E1 n.s. | |
| Ca | ↑ | n.s. | 81, 83–87↑↑ 88, 89 n.s. | P0 <<< P250 P0 << P125 P125 = P250 | n.s. | n.s. | 84 ↑↑↑ Rest n.s. | P0 < P125 = P250 | n.s. | E1 = E2 n.s. | ||
| Neville | Al | n.s. | ↑↑ | 81↓ Rest n.s. 81 = 85 | P0 <<< P125 = P250 | n.s. | ↓ | 81 = 85↓↓↓ Rest n.s. | P0 <<< P125 < P250 | ↓ | E1 = E2 E1↑; E2↓↓↓ | |
| Ca | ↑↑↑ | ↑↑ | 83 n.s. Rest ↑↑ | P0 <<< P125 = P250 | n.s. | ↑↑↑ | 83, 84 ↑ Rest ↑↑↑ | P0 << P250 P0 < P125 P125 = P250 | ↑↑↑ | E2 << E1↑↑ | ||
| Black Springs | Al | ↓↓ | ↓↓ | 83–85 n.s. Rest ↓↓ | P0 <<< P125 = P250 | P0 = P125 ↓↓ P250 n.s. | n.s. | 84 ↓↓↓ Rest n.s. | P0 <<< P125 = P250 | n.s. | E2 < E1↓ | |
| Ca | ↑↑↑ | ↑↑↑ | 83 n.s. Rest ↑↑↑ | P0 < P125 <<< P250 | P0 = P125 ↑↑ P250 n.s. | ↑↑↑ | 84 ↑↑↑ Rest ↑ | P0 = P125 = P250 | n.s. | E1 = E2↑↑↑ | ||
Direction of response: ↑, increasing; ↓ – decreasing; n.s., no response.
Level of significance: ↑, ↓, <, or > (P < 0.05); ↑↑, ↓↓, <<, or >>(P < 0.01); ↑↑↑, ↓↓↓, <<<, or >>> (P < 0.001).
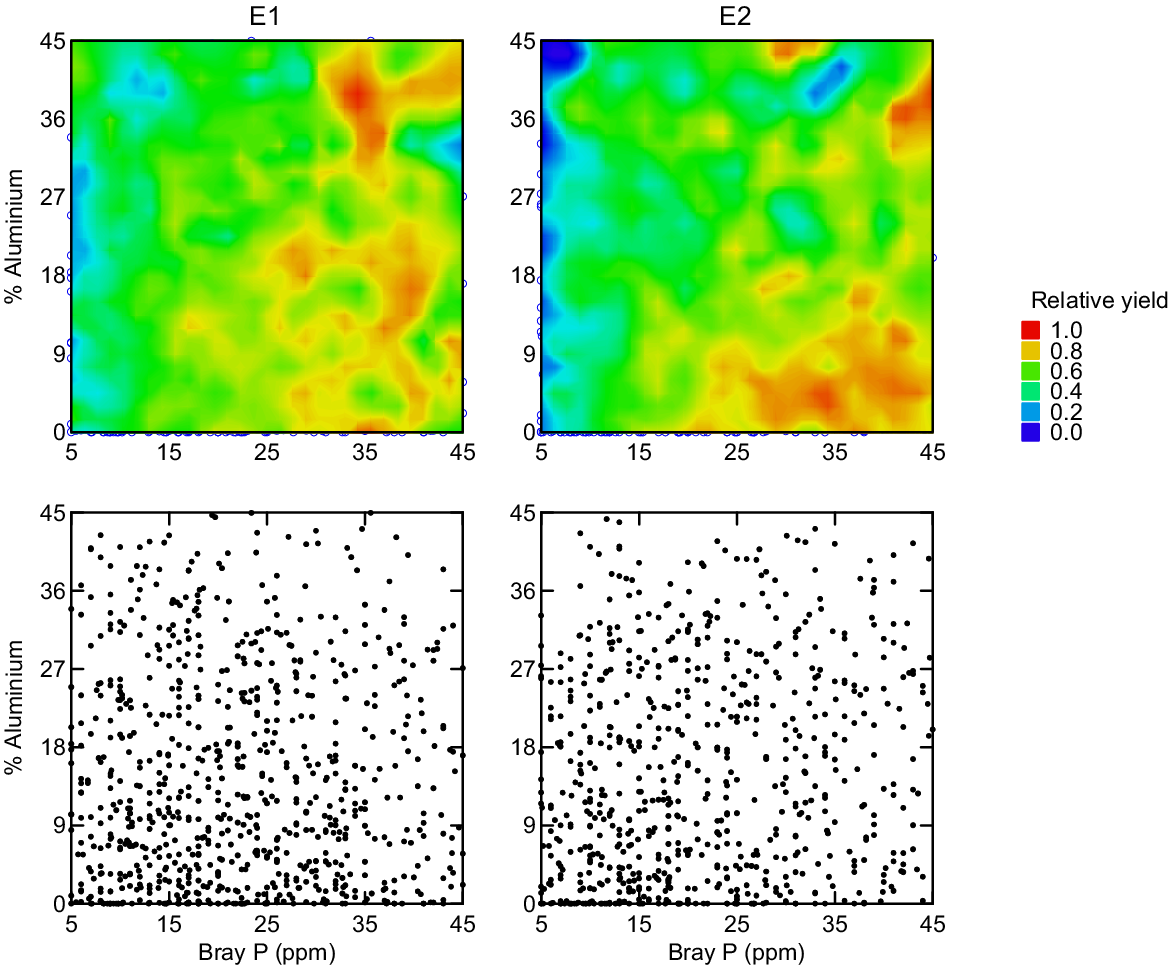
Across all sites with data restricted to 5–45 Bray P mg/kg, and 0–45%Al, relative yields generally increased with increasing Bray-1 P concentrations on both E1 and E2 (Fig. 7). Compared with E1, the relative reduction in yield at very low soil P concentrations was greater in E2, depicted by more blue along the Y-axis (Fig. 7). In addition, the yield advantage at lower %Al was greater in E2 than in E1, depicted by a greater proportion of the lower right quadrant, which is coloured red in Fig. 7.
Discussion
Lime
This study provides rare insight on the legacy benefit of lime on soil pH on different soils. Averaged across all sites, an increase of 0.1 pH units per t/ha lime applied was still evident in 1989, 12 years post-application. The longevity of response reported here exceeds expectations established by previous, shorter-run pasture studies (e.g. Holford and Crocker 1994). Soil acidified in all treatments, including in the nil lime plots, but the rate of pH change was greater as lime rate increased. This is in line with expectations (Scott et al. 1999) and is likely explained by a combination of increased product removal (Slattery et al. 1991; Li et al. 2019), increased rates of nitrification (Paul and Clark 1996; Kaveney et al. 2020) and increased vertical movement of lime (Conyers and Scott 1989; Conyers et al. 2003) with higher pH values at the soil surface.
In the unlimed soil, pH generally declined by 0.01–0.03 pH units per year over the 12-year study period. This is less than the decline of 0.04 pH units per year reported over 18 years in a study in southern NSW (Helyar et al. 1997), probably explained by a higher initial pHCa (~5.2) compared to the five sites in the present study (pHCa 4.1–4.4). In contrast, Li et al. (2019) reported a marginal pH increase (~0.006 pH units/year) in surface soil in the unlimed plots in a separate experiment also conducted over 18 years in southern NSW, perhaps reflecting the lower initial pHCa (~4.0) at that site. However, Li et al. (2019) reported a decline of 0.005 pH units per year in the 10–20 cm layer in the unlimed treatments. Soil pH was not monitored at layers below 10 cm depth in the present study, highlighting the possibility that the true rate of acidification in the profile is underestimated (Condon et al. 2021).
The experiments reported here pre-dated modern recommendations targeting surface soil pHCa > 5.5 to ameliorate subsurface acidity (Conyers and Scott 1989; Li et al. 2019; Condon et al. 2021). For each site, the highest lime rate (5.0 t/ha) proved adequate to raise pHCa to 5.5–6.0 although for the Browns Creek site, which had a lower initial pHCa (4.15), a higher rate (5.5–6.0 t/ha) was probably required to account for the spatial and temporal variability in soil pH that is known to exist in these soils (Conyers and Davey 1990; Conyers et al. 1997; Hayes et al. 2022). Such high rates of lime may have seemed extreme when these experiments were established but are now known to be required to adequately manage soil acidity in these environments.
The increase in exchangeable cations in the surface soil at all sites following lime application was expected and largely attributed to the large addition of Ca, plus a small addition of Mg, in the lime applied. The increase in exchangeable Mg lasted throughout the 12-year period at all sites. However, at the Vittoria, Browns Creek and Black Springs sites (interestingly, the sites least responsive to lime), there was a suggestion that the increase in exchangeable Ca was diminishing by the end of the experimental period. At face value this seems surprising because a lower concentration of Mg (1.5–2.0%) existed in the lime source used compared with Ca (~40%) and at all sites, Ca comprised 48–65% of ECEC following lime application. The decline in Ca over the experimental period may be explained by plant uptake and removal, and by leaching below the soil test layer. In a recent study of the effect of long-term liming on the mineral profile of pastures, Li et al. (2024) demonstrated an increase in Ca concentrations with lime, but no increase in Mg concentrations, noting however that the source of lime was different to that used in this study. Increased Ca concentrations in plant tissues may explain the gradual depletion of exchangeable Ca over time in the limed compared to nil lime treatments.
Calculating lime rates to achieve a target pH can be problematic for farmers as it requires integration of a range of soil attributes, such as organic matter content, texture and the nature of the clay minerology (Hochman et al. 1989; Condon et al. 2021). Equations have been established to calculate the pH change for given lime rates where the pH buffering capacity (pHBC) is known (Hayes et al. 2023) but pHBC is not commonly provided on standard soil tests. Across the five sites in the present study, where lime was incorporated and well mixed with the soil using a rotary hoe, soil pH 12 months following application was increased by 0.3 units per t/ha lime applied. This may prove a useful rule of thumb on similar soil types where the pHBC of the soil is not known and sophisticated decision support tools are not available. This rule of thumb is expected to be most relevant on soils with a starting pHCa ranging between 4.1 and 4.4, and with ECEC in the range 2.3–5.2. It is noted that in commercial situations initial increases in pH are expected to be lower than was achieved in this study, where high quality lime was well mixed with the soil.
Superphosphate
The application of SSP led to a small but significant decline in soil pH with differences in pH between the nil and plus SSP treatments increasing as the experiment progressed. This result is likely attributable to indirect effects of greater pasture biomass and removal, rather than to direct effects of the fertiliser itself as there was no difference in pH between the different rates of SSP. Direct effects of P-fertiliser on soil pH are known to be localised and proportional to phosphate retention (Saunders 1958). The small decrease in pH due to SSP resulted in a small increase in both exchangeable and %Al, indicative of the strong negative correlation between pH and Al.
The increase in exchangeable Ca due to SSP is likely explained by the Ca concentration of the fertiliser (~20%), as differences were only observed later in the experiment after several years of fertiliser top-dressing, and mainly with the higher fertiliser rate. By contrast, SSP application was associated with a decline in both exchangeable K and Mg in the surface soil, the decline being greater at the higher SSP rate. This result is likely explained by greater pasture uptake and removal of both Mg and K in herbage. Although it differs with plant species, K concentration of herbage can be around double that of Ca, and ~10-fold greater than the Mg concentration in pasture herbage (Hayes et al. 2008; Li et al. 2024). Strong DM responses to SSP over the duration of the experiment would explain a gradual depletion of both nutrients in the soil. The explanation for the decline in both Mg and K due to SSP where no such response was observed with liming reflects the substantially greater pasture DM response observed across all sites over the experimental period with SSP compared with lime. Some redistribution of these macro-nutrients in deeper soil layers also cannot be ruled out, especially some forms of K, which have previously been shown to be redistributed in soil by plants (Hayes et al. 2020). By 1989, the nil SSP treatment was depleted of P with Bray P declining to values that were just ⅕ – ½ of starting values and at all sites, generally below levels assumed to be optimal (10–12 mg/kg) for pasture production (Moody and Bolland 1999).
Bray P was used in this study as it was believed at the time the experiments commenced that Bray-1 was the more reliable index of P availability on acidic, mineral soils due to the sensitivity of Colwell P to variations in oxalate-extractable Fe (Vimpany et al. 1997). Various buffering indices have been developed to improve the interpretation of Colwell P, in addition to oxalate-extractable Fe, but the early workers at these sites considered that the use of Bray-1 was a simpler solution. When the Australian database was compiled for pasture responses to P, K and S (Gourley et al. 2019) there were 10 soil P tests in use in Australia. Of the 3638 experimental site-years available, 2244 (62%) used Colwell P and 209 (6%) used Bray-1. Therefore, Colwell P was adopted through weight of data whilst Bray 1 calibrations were restricted to particular regions and land uses such as those reported here. The question of which test is ‘better’ remains open.
Pasture response
Most pasture responses to lime in this study were observed in E2 where T. subterraneum dominated the swards. In E1 where D. glomerata dominated swards at all sites, significant lime effects were confined to species that were only minor components. It has been established that in short-term ecosystems such as pastures, total production is overwhelmingly driven by the dominant species (Grime 1998; Sasaki and Lauenroth 2011; Hayes et al. 2024). Therefore, altering the production of minor species with lime may have little effect on overall production in the short-term.
This study highlights the complexity of response to soil treatments of mixed pasture swards. First, when two soil treatments are being assessed, Liebig’s law of the minimum dictates that the relative response to either superphosphate or lime will be driven firstly by the relative limitation posed to pasture production by low pH or deficiency in P or S. In this network of sites, there was a greater number of species that responded positively to superphosphate than to lime, suggesting that at all sites the deficiency of P and/or S was a greater constraint to pasture production than was soil acidity.
Second, not only are pasture species responding directly to the soil treatment, but there is also an indirect effect of competition from neighbouring species that may themselves be responding even more strongly to the soil treatment. This competitive relationship is driven in part by the relative tolerance of the individual species to either a deficiency in P or S, or to the toxicities that exist in these low pH soils. A case in point is the negative response to superphosphate observed almost universally in Vulpia spp. It is unlikely that superphosphate inhibits the growth of Vulpia spp. when grown alone. Rather, the negative response observed is a competition effect where Vulpia growth was depressed by the many other species in the present study that grew more strongly in response to superphosphate (Dowling et al. 1997). The most consistent response to lime was the positive response of M. sativa, which is renowned for its sensitivity to acidic soil conditions (Hayes et al. 2011, 2012). P. aquatica, although also renowned for its sensitivity to aluminium toxicity (Culvenor et al. 1986) rarely responded positively to lime in the present experiment but often responded positively to superphosphate. This may be explained by a combination of factors such as: (1) soil fertility being a bigger constraint to phalaris growth than acidity; (2) phalaris was adequately able to tolerate the levels of Al toxicity (~15–30%) at this range of sites (Hayes et al. 2015); and (3) phalaris was only a minor component (1–7%) of most swards.
It is also noted that myriad other factors impact the competitive relationship beyond superphosphate and lime, to which individual species will respond differently, such as grazing management and drought stress. One also cannot overlook the overriding effects of nitrogen on pasture growth (Cocks 1980; Paul et al. 2003), which in the present experiments would have been indirectly affected by any factor that would impact legume growth, such as soil treatment, drought or grazing. Taken together, whilst this study demonstrated good relationships between soil treatment and pasture response, it would not be expected that superphosphate and lime would account for the full pasture response observed due to these other factors contributing to the competitive relationship in a mixed pasture sward.
For the farmer weighing up the merits of investing in either superphosphate or lime, this study highlights a common conundrum. On the one hand, superphosphate provided a greater immediate pasture response and so is easier to justify using standard financial analyses (Ellington 1984; Khairo et al. 2010). On the other hand, it is increasingly acknowledged that productive leguminous pastures used for agriculture inevitably acidify soils (Williams 1980; Condon et al. 2021) and that acidity will only become harder to address as time elapses and the acidity appears deeper in the soil profile (Li et al. 2019). As our study demonstrates, lime was unquestionably effective at ameliorating soil acidity, with the effects of one application still evident in a range of soil properties 12 years later. Logically, for productive and sustainable pasture systems in these Central Tableland environments, both lime and superphosphate will be required. If farmer decisions of whether lime is or is not applied continue to be driven by partial budgeting analyses that seek positive responses in the short-term, then the case for improved pastures becomes stronger (Li et al. 2006b; Hayes et al. 2016). In the present study, a greater pasture response was observed in E2 compared with E1, reflecting the more responsive ‘improved’ pastures in the E2 experiments.
Conclusion
This study presents perhaps the most detailed and long-running evaluation yet of responses to lime and superphosphate in permanent pasture environments across multiple sites. A single application of lime was demonstrated to have many enduring beneficial effects on soil chemistry, still evident 12 years following application and generally proportional to the quantum of lime initially applied. Ongoing applications of SSP led to cumulative changes in some soil properties and resulted in an almost universal increase in pasture productivity. Increases in pasture yield attributable to both SSP and lime were generally greater where more responsive pasture species were used, especially legumes, providing evidence that pasture renovation may be necessary to realise the full benefit of lime and SSP application. Nevertheless, responses to lime in exchangeable cations, available P and pasture yield were often not consistent across the five sites in this study, highlighting the challenge land managers might anticipate in assessing the potential benefits of lime in their environment over a short timeframe. It is clear that the historical view of lime and SSP being alternative investments is counterproductive and that both are required to minimise constraints to pasture growth on acidic soils. This study affirmed previous observations of SSP resulting in accelerated soil acidification.
Data availability
The data that support this study may be shared upon reasonable request to the corresponding author.
Conflicts of interest
The authors declare no conflicts of interest. Dr Jim Bradley, deceased pre-2024.
Declaration of funding
The study was supported by funds from the Wool Research and Development Corporation.
Acknowledgements
We thank A. Docking, D. Pritchard, P. Newell, P. Thomas, Z. Bohm, and G. Westreim for their help in collecting the data and maintaining the experimental sites. We also thank D. Pickering and L. Castleman for data collation and entry, and Dr B. Cullis, P. Nicholls, and Dr A. Cowling for advice on statistical procedures.
References
Archer KA, Rochester IJ (1982) Numbers and germination characteristics of white clover seed recovered from soils on the northern tablelands of New South Wales after drought. Journal of the Australian Institute of Agricultural Science 48(2), 99-101.
| Google Scholar |
Bache BW, Williams EG (1971) A phosphate sorption index for soils. Journal of Soil Science 22(3), 289-301.
| Crossref | Google Scholar |
Barrow NJ, Hartemink AE (2023) The effects of pH on nutrient availability depend on both soils and plants. Plant and Soil 487(1), 21-37.
| Crossref | Google Scholar |
Bray RH, Kurtz LT (1945) Determination of total, organic, and available forms of phosphorus in soils. Soil Science 59(1), 39-46.
| Crossref | Google Scholar |
Chan KY, Heenan DP (1998) Effect of lime (CaCO3) application on soil structural stability of a red earth. Australian Journal of Soil Research 36(1), 73-86.
| Crossref | Google Scholar |
Cocks PS (1980) Limitations imposed by nitrogen deficiency on the productivity of subterranean clover-based annual pasture in southern Australia. Australian Journal of Agricultural Research 31(1), 95-107.
| Crossref | Google Scholar |
Condon J, Burns H, Li G (2021) The extent, significance and amelioration of subsurface acidity in southern New South Wales, Australia. Soil Research 59(1), 1-11.
| Crossref | Google Scholar |
Conyers MK, Scott BJ (1989) The influence of surface incorporated lime on subsurface soil acidity. Australian Journal of Experimental Agriculture 29(2), 201-207.
| Crossref | Google Scholar |
Conyers MK, Davey BG (1990) The variability of pH in acid soils of the southern highlands of New South Wales. Soil Science 150(4), 695-704.
| Crossref | Google Scholar |
Conyers MK, Uren NC, Helyar KR, Poile GJ, Cullis BR (1997) Temporal variation in soil acidity. Australian Journal of Soil Research 35(5), 1115-1130.
| Crossref | Google Scholar |
Conyers MK, Mullen CL, Scott BJ, Poile GJ, Braysher BD (2003) Long-term benefits of limestone applications to soil properties and to cereal crop yields in southern and central New South Wales. Australian Journal of Experimental Agriculture 43(1), 71-78.
| Crossref | Google Scholar |
Culvenor RA, Oram RN, Fazekas de St Groth C (1986) Variation in tolerance in Phalaris aquatica L. and a related species to aluminium in nutrient solution and soil. Australian Journal of Agricultural Research 37(4), 383-395.
| Crossref | Google Scholar |
Donald CM (1965) The progress of Australian agriculture and the role of pastures in environmental change. The Australian Journal of Science 27(7), 187-198.
| Google Scholar |
Donald CM, Williams CH (1954) Fertility and productivity of a podzolic soil as influenced by subterranean clover (Trifolium subterraneum L.) and superphosphate. Australian Journal of Agricultural Research 5(4), 664-687.
| Crossref | Google Scholar |
Dowling PM, Leys AR, Plater B (1997) Effect of herbicide and application of superphosphate and subterranean clover seed on regeneration of vulpia in pastures. Australian Journal of Experimental Agriculture 37(4), 431-438.
| Crossref | Google Scholar |
Earle DF, McGowan AA (1979) Evaluation and calibration of an automated rising plate meter for estimating dry matter yield of pasture. Australian Journal of Experimental Agriculture and Animal Husbandry 19(98), 337-343.
| Crossref | Google Scholar |
Gillman GP, Sumpter EA (1986) Modification to the compulsive exchange method for measuring exchange characteristics of soils. Soil Research 24(1), 61-66.
| Crossref | Google Scholar |
Gourley CJP, Weaver DM, Simpson RJ, Aarons SR, Hannah MM, Peverill KI (2019) The development and application of functions describing pasture yield responses to phosphorus, potassium and sulfur in Australia using meta-data analysis and derived soil-test calibration relationships. Crop & Pasture Science 70(12), 1065-1079.
| Crossref | Google Scholar |
Grime JP (1998) Benefits of plant diversity to ecosystems: immediate, filter and founder effects. Journal of Ecology 86(6), 902-910.
| Crossref | Google Scholar |
Hayes RC, Dear BS, Orchard BA, Peoples MB, Eberbach PL (2008) Response of subterranean clover, balansa clover, and gland clover to lime when grown in mixtures on an acid soil. Australian Journal of Agricultural Research 59(9), 824-835.
| Crossref | Google Scholar |
Hayes RC, Scott BJ, Dear BS, Li GD, Auricht GC (2011) Seedling validation of acid soil tolerance of lucerne populations selected in solution culture high in aluminium. Crop & Pasture Science 62(9), 803-811.
| Crossref | Google Scholar |
Hayes RC, Conyers MK, Li GD, Poile GJ, Price A, McVittie BJ, Gardner MJ, Sandral GA, McCormick JI (2012) Spatial and temporal variation in soil Mn2+ concentrations and the impact of manganese toxicity on lucerne and subterranean clover seedlings. Crop & Pasture Science 63(9), 875-885.
| Crossref | Google Scholar |
Hayes RC, Li GD, Conyers MK, Virgona JM, Dear BS (2016) Lime increases productivity and the capacity of lucerne (Medicago sativa L.) and phalaris (Phalaris aquatica L.) to utilise stored soil water on an acidic soil in south-eastern Australia. Plant and Soil 400(1), 29-43.
| Crossref | Google Scholar |
Hayes RC, Li GD, Rawnsley RP, Pembleton KG, Corkrey R, Peoples MB (2020) The legacy of pasture drill rows on soil chemical characteristics and subsequent wheat production. Plant and Soil 455(1), 319-337.
| Crossref | Google Scholar |
Hayes RC, Rohan M, Li GD, Orgill SE, Poile GJ, Oates AA, Conyers MK (2022) The nature of spatial variability of four soil chemical properties and the implications for soil sampling. Journal of Soils and Sediments 22(12), 3006-3017.
| Crossref | Google Scholar |
Hayes RC, Li GD, Smith RW, Peoples MB, Rawnsley RP, Newell MT, Pembleton KG (2024) Prospects for improving productivity and composition of mixed swards in semi-arid environments by separating species in drill rows – a review. Agriculture, Ecosystems & Environment 373, 109131.
| Crossref | Google Scholar |
Helyar KR (1976) Nitrogen cycling and soil acidification. Journal of the Australian Institute of Agricultural Science 42(4), 217-221.
| Google Scholar |
Helyar KR, Cullis BR, Furniss K, Kohn GD, Taylor AC (1997) Changes in the acidity and fertility of a red earth soil under wheat–annual pasture rotations. Australian Journal of Agricultural Research 48(5), 561-586.
| Crossref | Google Scholar |
Holford ICR, Crocker GJ (1994) Long-term effects of lime on pasture yields and response to phosphate fertilizers on eight acidic soils. Australian Journal of Agricultural Research 45(5), 1051-1062.
| Crossref | Google Scholar |
Holland JE, Behrendt K (2021) The economics of liming in arable crop rotations: analysis of the 35-year Rothamsted and Woburn liming experiments. Soil Use and Management 37(2), 342-352.
| Crossref | Google Scholar |
Holland JE, Bennett AE, Newton AC, White PJ, McKenzie BM, George TS, Pakeman RJ, Bailey JS, Fornara DA, Hayes RC (2018) Liming impacts on soils, crops and biodiversity in the UK: a review. Science of the Total Environment 610–611, 316-332.
| Crossref | Google Scholar | PubMed |
Jeffrey SJ, Carter JO, Moodie KB, Beswick AR (2001) Using spatial interpolation to construct a comprehensive archive of Australian climate data. Environmental Modelling & Software 16(4), 309-330.
| Crossref | Google Scholar |
Kaveney B, Condon J, Doran G, Galea F, Rigg J (2020) The distribution of soil nitrifiers and efficacy of 3,4-dimethylpyrazole phosphate changes with soil depth and calcium carbonate application. Soil Biology and Biochemistry 150, 108009.
| Crossref | Google Scholar |
Khairo SA, Norton M, Garden D, Graham P, Langford C, Armstrong P, Brassil T (2010) The profitability of wool production after surface application of lime and superphosphate on acid soils. Australian Farm Business Management Journal 7(1), 1-10.
| Google Scholar |
Lee S, Sorensen JW, Walker RL, Emerson JB, Nicol GW, Hazard C (2022) Soil pH influences the structure of virus communities at local and global scales. Soil Biology and Biochemistry 166, 108569.
| Crossref | Google Scholar |
Li GD, Helyar KR, Evans CM, Wilson MC, Castleman LJC, Fisher RP, Cullis BR, Conyers MK (2003) Effects of lime on the botanical composition of pasture over nine years in a field experiment on the south-western slopes of New South Wales. Australian Journal of Experimental Agriculture 43(1), 61-69.
| Crossref | Google Scholar |
Li GD, Helyar KR, Conyers MK, Castleman LJC, Fisher RP, Poile GJ, Lisle CJ, Cullis BR, Cregan PD (2006a) Pasture and sheep responses to lime application in a grazing experiment in a high-rainfall area, south-eastern Australia. II. Liveweight gain and wool production. Australian Journal of Agricultural Research 57(10), 1057-1066.
| Crossref | Google Scholar |
Li GD, Helyar KR, Welham SJ, Conyers MK, Castleman LJC, Fisher RP, Evans CM, Cullis BR, Cregan PD (2006b) Pasture and sheep responses to lime application in a grazing experiment in a high-rainfall area, south-eastern Australia. I. Pasture production. Australian Journal of Agricultural Research 57(10), 1045-1055.
| Crossref | Google Scholar |
Li GD, Singh RP, Brennan JP, Helyar KR (2010) A financial analysis of lime application in a long-term agronomic experiment on the south-western slopes of New South Wales. Crop & Pasture Science 61(1), 12-23.
| Crossref | Google Scholar |
Li GD, Conyers MK, Heylar KR, Lisle CJ, Poile GJ, Cullis BR (2019) Long-term surface application of lime ameliorates subsurface soil acidity in the mixed farming zone of south-eastern Australia. Geoderma 338, 236-246.
| Crossref | Google Scholar |
Li GD, Conyers MK, Refshauge G, Ataollahi F, Hayes RC (2024) Long-term liming changes pasture mineral profile. Scientific Reports 14(1), 3539.
| Crossref | Google Scholar | PubMed |
Lieschke M (2022) Laggan grazing demonstration results: 2015–2021. South East Local Land Services. Available at https://www.lls.nsw.gov.au/regions/south-east/key-projects/laggan-grazing-demonstration
Mannetje L, Haydock KP (1963) The dry-weight-rank method for the botanical analysis of pasture. Grass and Forage Science 18(4), 268-275.
| Crossref | Google Scholar |
McLachlan KD (1955) Phosphorus, sulpfur, and molybdenum deficiencies in soils from eastern Australia in relation to nutrient supply and some characteristics of soil and climate. Australian Journal of Agricultural Research 6(5), 673-684.
| Crossref | Google Scholar |
Norton MR, Garden DL, Orchard BA, Armstrong P, Brassil T (2020) Effects of lime, phosphorus and stocking rate on an extensively managed permanent pasture: botanical composition and groundcover. Crop & Pasture Science 71(7), 700-713.
| Crossref | Google Scholar |
Norton MR, Garden DL, Rohan M, Orchard BA, Armstrong P, Brassil T (2023) Lime, phosphorus and stocking rate of an extensively managed permanent pasture affect feed-on-offer, sheep growth rate, carrying capacity and wool production. Animal Production Science 63(9), 878-894.
| Crossref | Google Scholar |
Paul KI, Scott Black A, Conyers MK (2003) Development of acidic subsurface layers of soil under various management systems. Advances in Agronomy 78, 187-214.
| Crossref | Google Scholar |
Peoples MB, Brockwell J, Hunt JR, Swan AD, Watson L, Hayes RC, Li GD, Hackney B, Nuttall JG, Davies SL, Fillery IRP (2012) Factors affecting the potential contributions of N2 fixation by legumes in Australian pasture systems. Crop & Pasture Science 63(9), 759-786.
| Crossref | Google Scholar |
Roper MM (2005) Managing soils to enhance the potential for bioremediation of water repellency. Australian Journal of Soil Research 43(7), 803-810.
| Crossref | Google Scholar |
Sasaki T, Lauenroth WK (2011) Dominant species, rather than diversity, regulates temporal stability of plant communities. Oecologia 166(3), 761-768.
| Crossref | Google Scholar | PubMed |
Saunders WMH (1958) The effect of different phosphate fertilisers on soil pH and the consequent effect on phosphate retention. New Zealand Journal of Agricultural Research 1(5), 675-682.
| Crossref | Google Scholar |
Scott BJ, Conyers MK, Poile GJ, Cullis BR (1999) Reacidification and reliming effects on soil properties and wheat yield. Australian Journal of Experimental Agriculture 39(7), 849-856.
| Crossref | Google Scholar |
Scott BJ, Ridley AM, Conyers MK (2000) Management of soil acidity in long-term pastures of south-eastern Australia: a review. Australian Journal of Experimental Agriculture 40(8), 1173-1198.
| Crossref | Google Scholar |
Simpson RJ, Haling RE, Graham P (2021) Delivering improved phosphorus acquisition by root systems in pasture and arable crops. In ‘Understanding and improving crop root function’. (Ed. PJ Gregory) pp. 589–648. (Burleigh Dodds Science Publishing: Cambridge, UK) Available at https://shop.bdspublishing.com/store/bds/detail/product/3-190-9781801460071
Slattery WJ, Ridley AM, Windsor SM (1991) Ash alkalinity of animal and plant products. Australian Journal of Experimental Agriculture 31(3), 321-324.
| Crossref | Google Scholar |
Vimpany IA, Nicholls PJ, Milham PJ, Bradley J (1997) Reactive Fe controls the relative amount of PO4 extracted from acidic soils by NaHCO3 and by acidic fluoride I. Soils without recent P additions. Soil Research 35(2), 355-364.
| Crossref | Google Scholar |
Williams CH (1980) Soil acidification under clover pasture. Australian Journal of Experimental Agriculture and Animal Husbandry 20(106), 561-567.
| Crossref | Google Scholar |