

East Coast Gas Market, Queensland’s coal seam gas development, and the National Electricity Market – don’t take gas for granted
David Close A * , Rick Wilkinson B and Andrew Garnett AA
B

Professor David Close is the Director of the University of Queensland (UQ) Gas & Energy Transition Research Centre where he leads a multi-disciplinary team undertaking independent research to address the complexities and challenges of the energy transition in Australia and the Asia–Pacific. David has over 20 years’ industry experience and holds a PhD in Marine Geophysics from the University of Oxford and a BSc (Hons) from the University of Tasmania. |

Rick Wilkinson is Chief Executive Officer of EnergyQuest, an Australian-based energy advisory firm, which specialises in independent energy market analysis and strategy. He has more than 35 years of experience in the energy industry. Rick was appointed a Gas Fields Commissioner by the Queensland Government, a position he held for 7 years. He is an Adjunct Professor at the University of Queensland. Rick has a first class BSc (Hons), majoring in nuclear physics from Melbourne University. |

Emeritus Professor Andrew Garnett was the Centre Director at the UQ Centre for Coal Seam Gas and Centre for Natural Gas from 2012 to 2023, overseeing multi-disciplinary research from the start of the Queensland coal seam gas developments to the successful establishment of a major export industry. He is the current Chair of the Australian Gas Industry Trust. He has over 25 years’ experience in international upstream conventional and unconventional oil and gas projects. |
Abstract
Queensland’s early coal seam gas (CSG) development was primarily focused on supplying domestic demand as conventional field production from the Bowen and Surat basins declined. However, with increasing appraisal, it became apparent that the demand outlook and the long-run <A$4 domestic gas price would be limiting factors for development. Substantial reserves growth through the 2000s triggered multiple rounds of consolidation leading to four large joint ventures of Australian and international companies. The CSG fields reached peak production of ~4 petajoules (PJ) per day from 2017, following investment of ~A$60 billion in wells and facilities in the upstream and pipelines to liquefaction capacity on Curtis Island (Gladstone). Today, there are over 14,000 CSG wells in the Bowen and Surat basins, and over 12,500 PJ of gas has been delivered to Curtis Island as liquefied natural gas feedstock, as well as over 2200 PJ of gas delivered to the domestic market. Phenomenal growth occurred from 1 January 2015 to mid-2024, despite the contemporaneous, widely held belief that the CSG plays could never be commercialised. CSG from Queensland will play an increasingly important role in the National Electricity Market as gas supply in the southern states continues to decline and gas-powered-generation demand peaks increase in volume due to coal-plant retirements and increased electrification. To maintain CSG production (i.e. offset natural decline) requires investment of ~A$3.5–4 billion per annum; any government intervention that inadvertently threatens this investment could ultimately increase the risk of gas shortfalls in the medium- to long-term, with accelerated field decline.
Keywords: coal seam gas development, east coast gas market, energy policy, gas policy, gas-powered generation, gas supply shortfall, National Electricity Market, Queensland coal seam gas.
Introduction and East Coast Gas Market overview
We define the East Coast Gas Market (ECGM) as the various individual, but physically connected, gas markets supplied by the network of producing fields and transmission pipelines, with associated facilities, in all the states and territories of Australia, except Western Australia (Fig. 1). This definition is very similar to the Australian Energy Market Operator’s (AEMO's) definition of the East Coast Gas System. We consider the ECGM to have commenced in 2008 when the Queensland to South Australia/New South Wales (QSN) pipeline was completed – as an extension of the South West Queensland Pipeline (SWQP) – and provided a sales gas connection between Ballera, in Queensland, to Moomba, in South Australia (SA).
Map of key pipelines, infrastructure and gas supply hubs in the ECGM (modified from AEMO Gas Bulletin Board data).
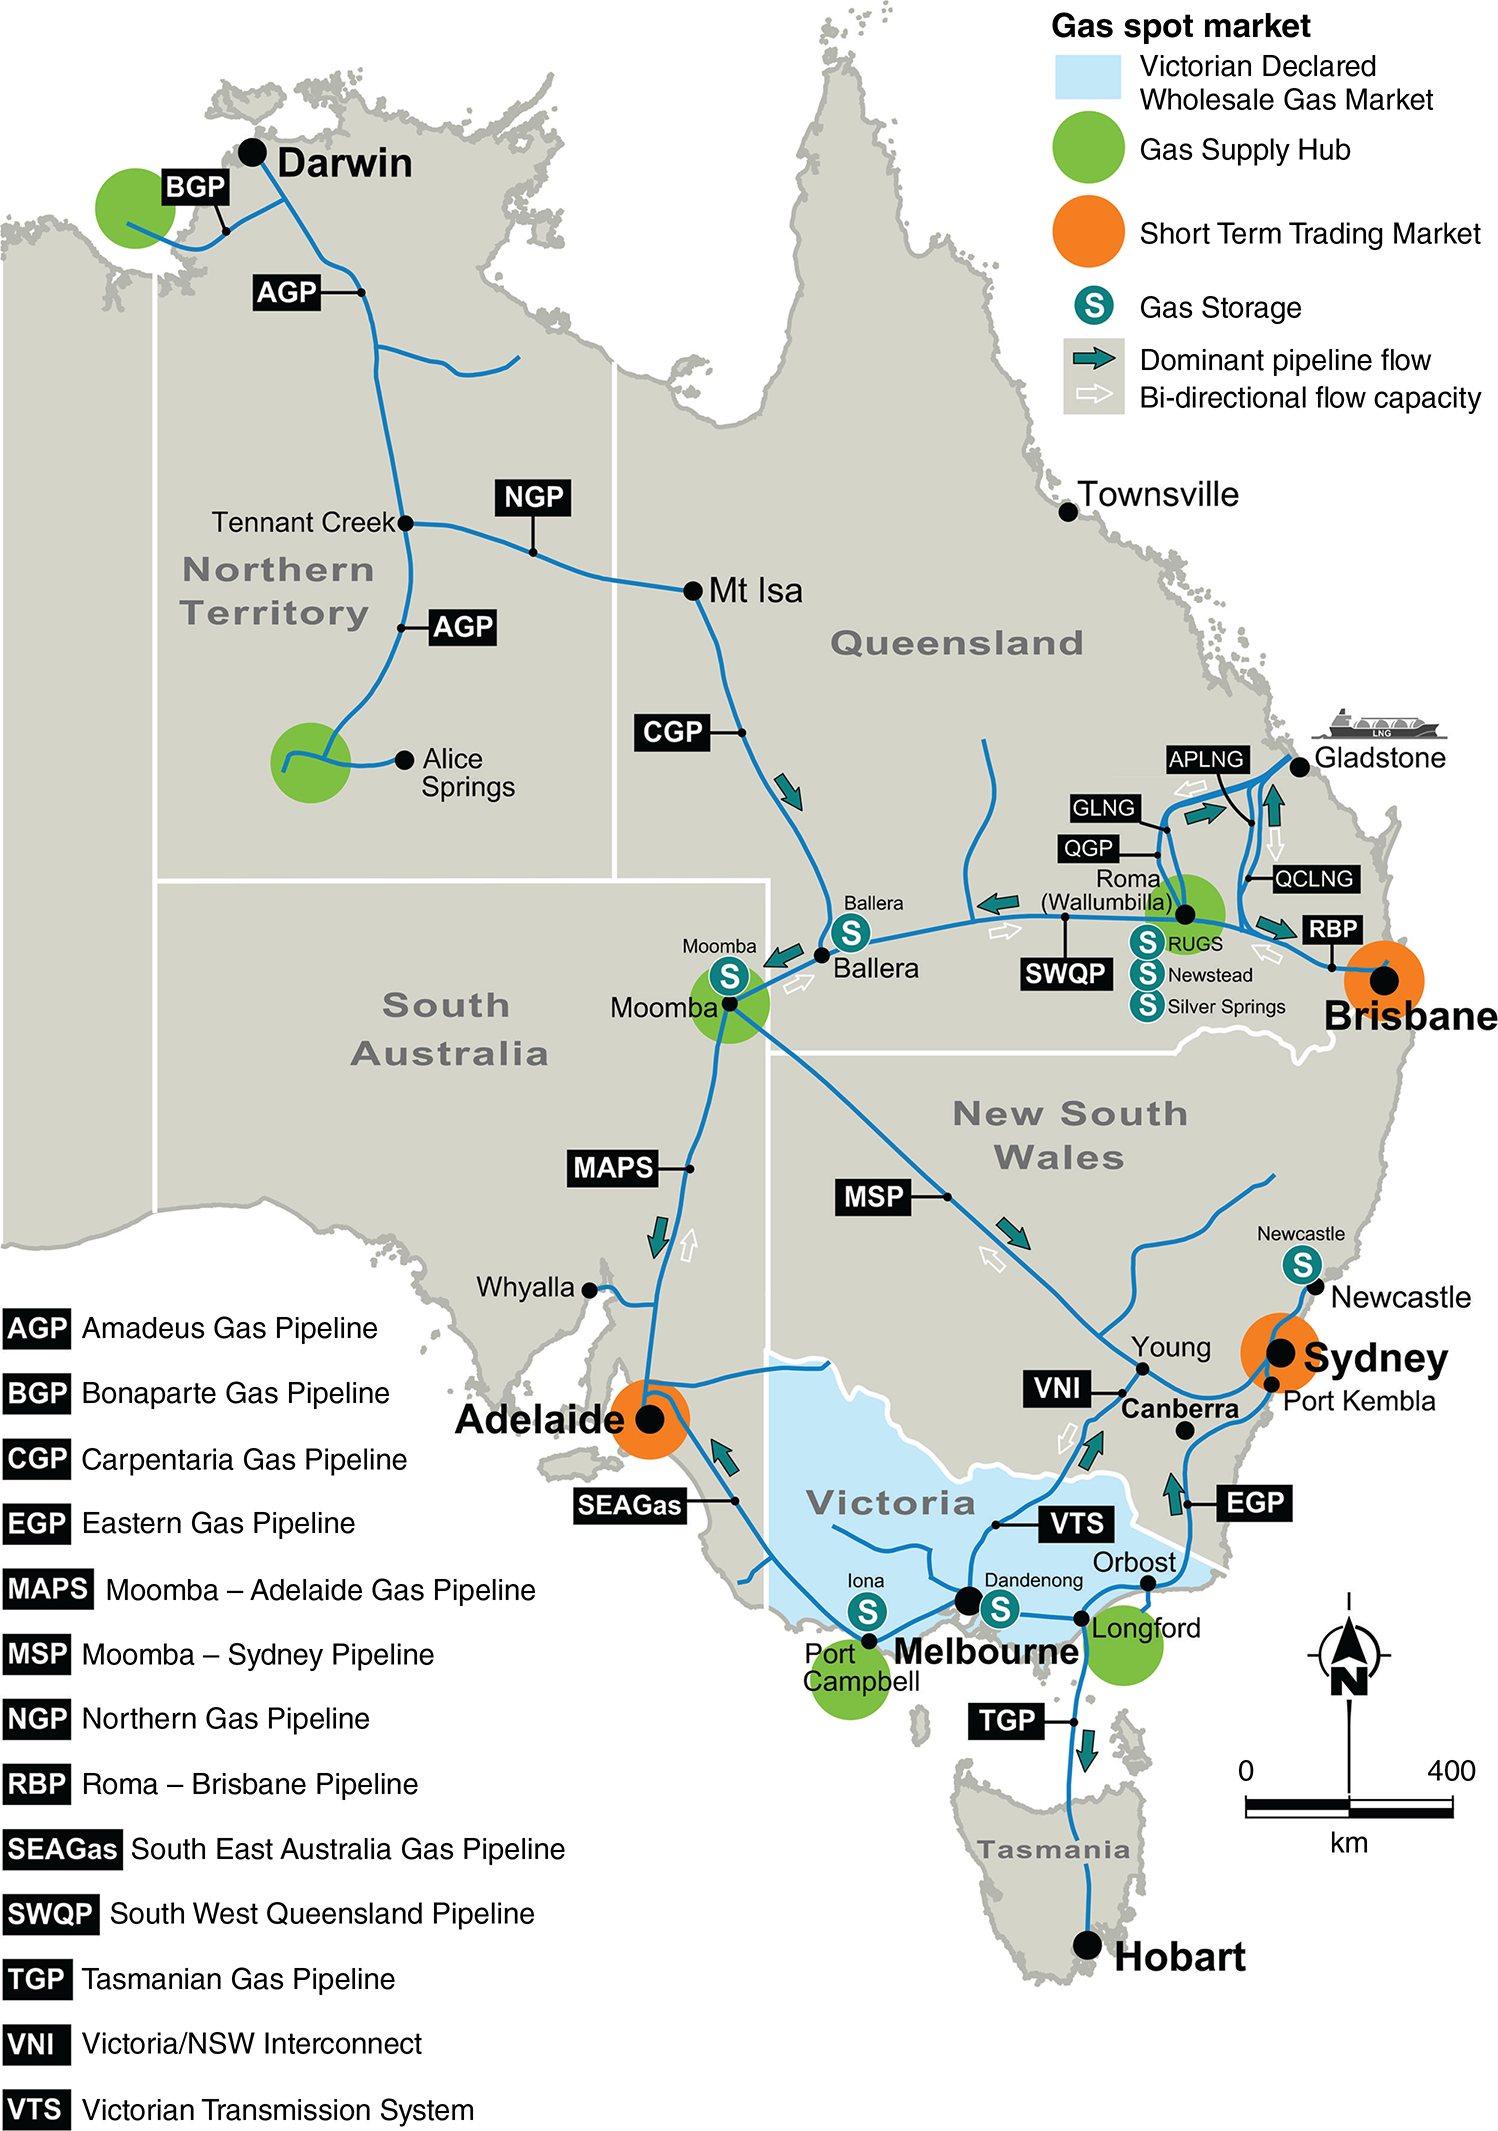
The QSN connected Queensland to not just SA, but through the existing pipeline networks to New South Wales (NSW), Victoria, and Tasmania (Fig. 1, Table 1). The addition of the Northern Territory (NT) to the ECGM followed in 2019, when the Northern Gas Pipeline (NGP) commenced commercial gas transport operations between Tennant Creek (NT) and Mount Isa (Queensland). The ECGM became exposed to international liquefied natural gas (LNG) pricing from the early to mid-2010s, as over 20 mtpa (>1100 PJ) was contracted at prices linked to international oil markets from the multiple coal seam gas (CSG) and LNG projects in Queensland.
| Pipeline (PL) name | Abbreviation | Connects | Capacity (TJ/d) | Commenced | ||
|---|---|---|---|---|---|---|
| ‘South’ of Moomba | Tasmanian Gas PL | TGP | Longford to Tasmania | 129 | 2001 | |
| Longford-Melbourne PL | LMP | Longford to Melbourne | 590 | 1969 | ||
| Eastern Gas PL | EGP | Longford to Sydney | 339 | 2000 | ||
| South West PL | SWP | Port Campbell to Melbourne | 328 | 2004 | ||
| SEA Gas | PCA | Port Campbell to Adelaide | 231 | 2004 | ||
| Victorian-Northern Interconnect | VNI | Victorian Transmission System to Culcairn | 220 | 2004 | ||
| Moomba-Adelaide PL System | MAPS | Moomba to Adelaide | 241 | 1969 | ||
| Moomba-Sydney PL | MSP | Moomba to Sydney | 489 (east) | 1976 | ||
| 120 (west) | ||||||
| ‘North’ of Moomba | South West Queensland Gas PL | SWQP | Moomba to Wallumbilla | 340 (east haul) | 1996 (2008 QSN extension) | |
| 512 (west haul) | ||||||
| Carpentaria Gas PL | CGP | Ballera to Mount Isa | 119 | 1998 | ||
| Northern Gas PL | NGP | Mount Isa to Tennant Creek | 90 | 2019 | ||
| Roma-Brisbane PL | RBP | Roma to Brisbane | 167 | 1969 | ||
| Queensland Gas PL | QGP | Wallumbilla to Curtis Island | 145 | 1989 | ||
| Wallumbilla-Gladstone PL | WGP | Wallumbilla to Gladstone | 1598 | 2014 | ||
| APLNG PL | APLNG PL | Wallumbilla to Gladstone | 1700 | 2014 | ||
| GLNG PL | GLNG PL | Wallumbilla to Gladstone | 1430 | 2014 |
Note that Longford and Port Campbell are the onshore processing hubs for offshore field production from the Gippsland and Otway basins respectively.
Prior to 2008, there were effectively two markets in eastern Australia: (1) a ‘southern states’ (SA, NSW, Australian Capital Territory (ACT), Victoria, Tasmania) market and (2) a Queensland market. The southern states market benefited from world-class, conventional fields in the Gippsland Basin and Cooper Basin (SA/Queensland), conventional fields from the Otway and Bass basins and minor unconventional (CSG) production from the Sydney Basin (NSW). Queensland, in contrast, was primarily supplied from relatively small conventional gas fields from the Bowen and Surat basins. The reserves and production history of these basins are shown in Fig. 2.
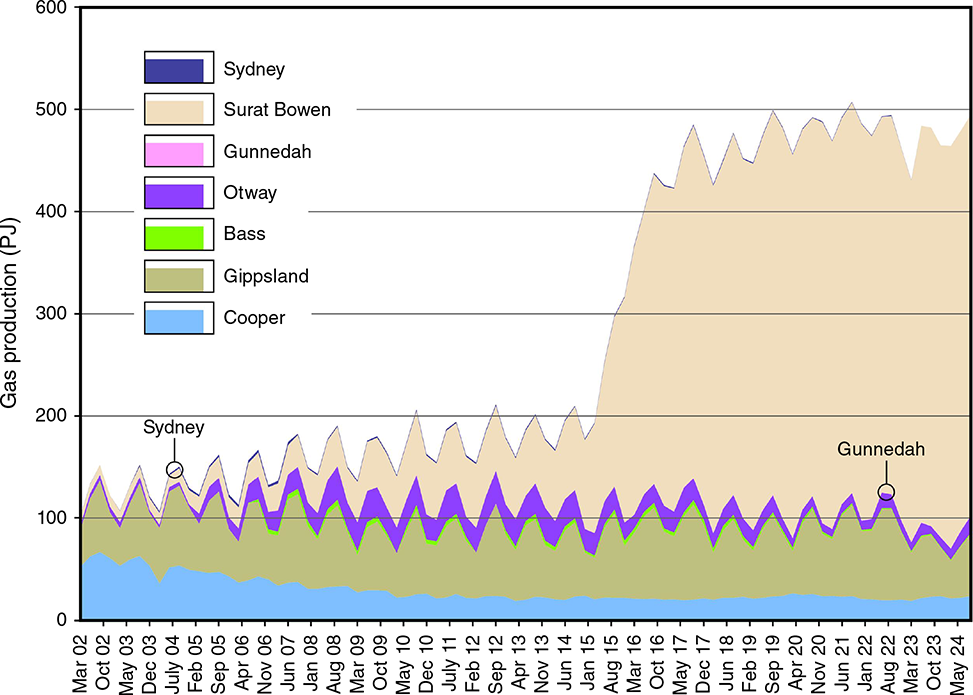
Fig. 2 illustrates the dramatic decline in production in the southern states, in the world class Gippsland and Cooper basins in particular, relative to Queensland before and after the ramp-up of the CSG industry in the late 2000s. In the 20 years since 2004, Gippsland Basin proved and probable (2P) reserves have declined even more markedly, from over 4500 to 1339 PJ. The early 2000s decline in Cooper Basin production and more recent decline acceleration in Gippsland Basin production are dwarfed by the increase in Queensland production (and reserves) but are nonetheless very significant in the context of the southern states. Cooper Basin production has remained relatively steady since the early 2010s; however, the large, conventional discoveries that supported peak Cooper Basin output in the late 1990s have declined, and production is now supported by smaller fields; the Basin, as a whole, requires on the order of 100 wells per year across exploration, appraisal and development to maintain production and reserves. The almost invisible contribution of NSW does not reflect geological limitations, as is the case for onshore Tasmania, but rather a series of government reviews and moratoria1 and regulatory interventions2 that have ultimately resulted in no material developments progressing in parallel to the Queensland CSG ramp-up. The future reliance on Queensland production is stark.
The most critical production hubs in the ECGM are Longford and Orbost (Gippsland Basin) and Port Campbell (Otway Basin) in the south, Moomba (Cooper Basin) in the centre, and Wallumbilla (Bowen/Surat basins) in the north. Production from the Cooper Basin has become relatively less critical in the ECGM since the 2000s; however, the Moomba hub, as the only connection point between Queensland and the southern states, is also a critical transport hub. The amount of gas that can be transported between Queensland and the southern states is limited to the capacity of the SWQP of ~500 terajoules per day (TJ/d).
In addition to having relatively poor interconnection between the southern states and Queensland, there is also limited useable gas storage in the ECGM. The Iona Gas Storage Facility, west of Melbourne in the onshore Otway Basin (Fig. 1), is the most important storage facility and has a useable volume of ~15–20 PJ (from a total capacity of ~25 PJ) that can discharge at ~500 TJ/d. Iona plays an important role in meeting peak demand in the southern states and Victoria in particular.
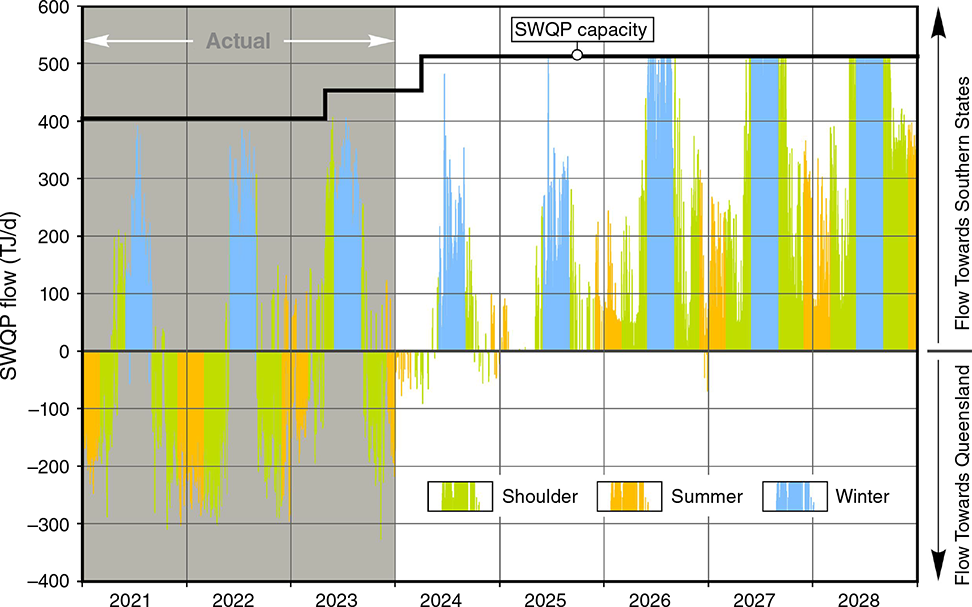
For decades, while the Gippsland Basin was at plateau or close to peak production, the southern states were largely self-sufficient for gas supply throughout the year and exported excess gas to Queensland. However, with the declining production from the Gippsland Basin, the southern states have increased gas imports from Queensland via the SWQP, and exports to Queensland are forecast to cease entirely in the coming years (Fig. 3).
The increasing reliance on pipeline transported gas from Queensland and the likelihood of gas shortfalls from as early as 2025–2026 in the southern states have been clearly articulated (ACCC 2024; AEMO 2024).
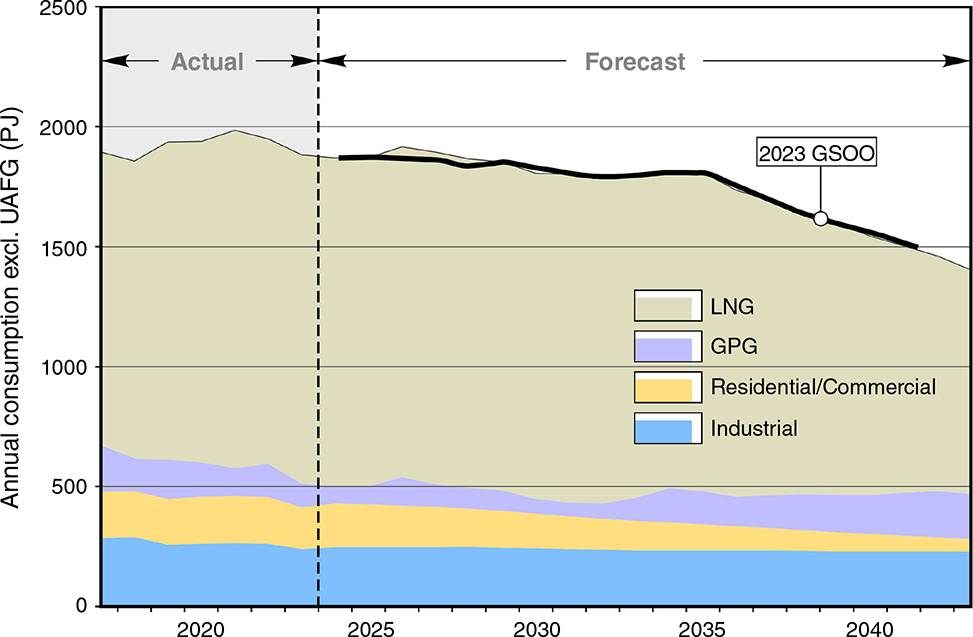
Prior to the commencement of LNG exports (i.e. from 2010 to 2015), ECGM demand was relatively stable at approximately 500–700 petajoules per annum (PJ/a) across three major sectors: (1) industrial, (2) residential and commercial, and (3) power-generation (Fig. 4). Since 2015, total produced volumes in the ECGM are closer to 2000 PJ/a, with the growth serving LNG exports out of Queensland – LNG feedstock is now approximately 60–65% of east coast demand. Gas demand for gas-powered generation (GPG) has declined, from ~200 PJ/a in 2015 to 84 PJ/a in 2023, but was up again in 2024 to >100 PJ/a and is forecast by AEMO to increase further from around 2035 as coal plants are retired (Fig. 4). Gas demand is relatively smooth on an annualised basis; however, the GPG demand is likely to be very peaky and used primarily during periods of extended high demand and/or low variable renewable energy (VRE) generation.
Actual and forecast total annual gas consumption from AEMO 2024 (Step Change scenario). UAFG, unaccouted for gas.
Queensland CSG development
Towler et al. (2016) provided an overview of the history of natural gas production and the development of the CSG industry in Queensland. Conventional exploration in the Bowen and Surat basins peaked in 1964, following the discovery of the Moonie oil field in 1961, and conventional production was in decline from around 1995 when it peaked at a relatively modest 30 billion cubic feet per annum (BCF/a).
The true potential of Bowen and Surat basins’ CSG was not immediately revealed to incumbent explorers and producers by the approximately 30 CSG exploration wells drilled in the 1970–1980s. However, the North American example – where CSG production grew through the 1990s to a peak of almost 2000 BCF/a on the back of substantial tax credits and technology advances – created momentum for existing producers and new, international entrants.
Queensland’s early CSG exploration and production was primarily focused on supplying domestic demand and was incentivised by the Queensland Gas Scheme, introduced in 2000, which required retailers to source 15% of their electricity from GPG by 2011. The first CSG development underwritten by a long-term gas sales agreement, for the Bowen Basin peat field, was entered into around 2000 between Oil Company of Australia, which would become part of Origin, and Brisbane utility AllGas, which would become part of APA, for approximately 10–15 TJ/d. (Riley, pers. comm.). With increasing appraisal, however, it became apparent that the domestic demand outlook and the long-run <A$4 gas price would be limiting factors for CSG development.
The play potential along with early production and reserves growth triggered consolidation through acquisitions by established and growing Australian operators, ultimately leading to four large acreage and resource positions held by (1) Origin, (2) Santos, (3) Queensland Gas Company (QGC), and (4) Arrow (Fig. 5). These larger joint ventures (JVs) were able to better deploy capital to explore and appraise the resource potential more thoroughly, and they also began early development tied to domestic gas supply contracts.
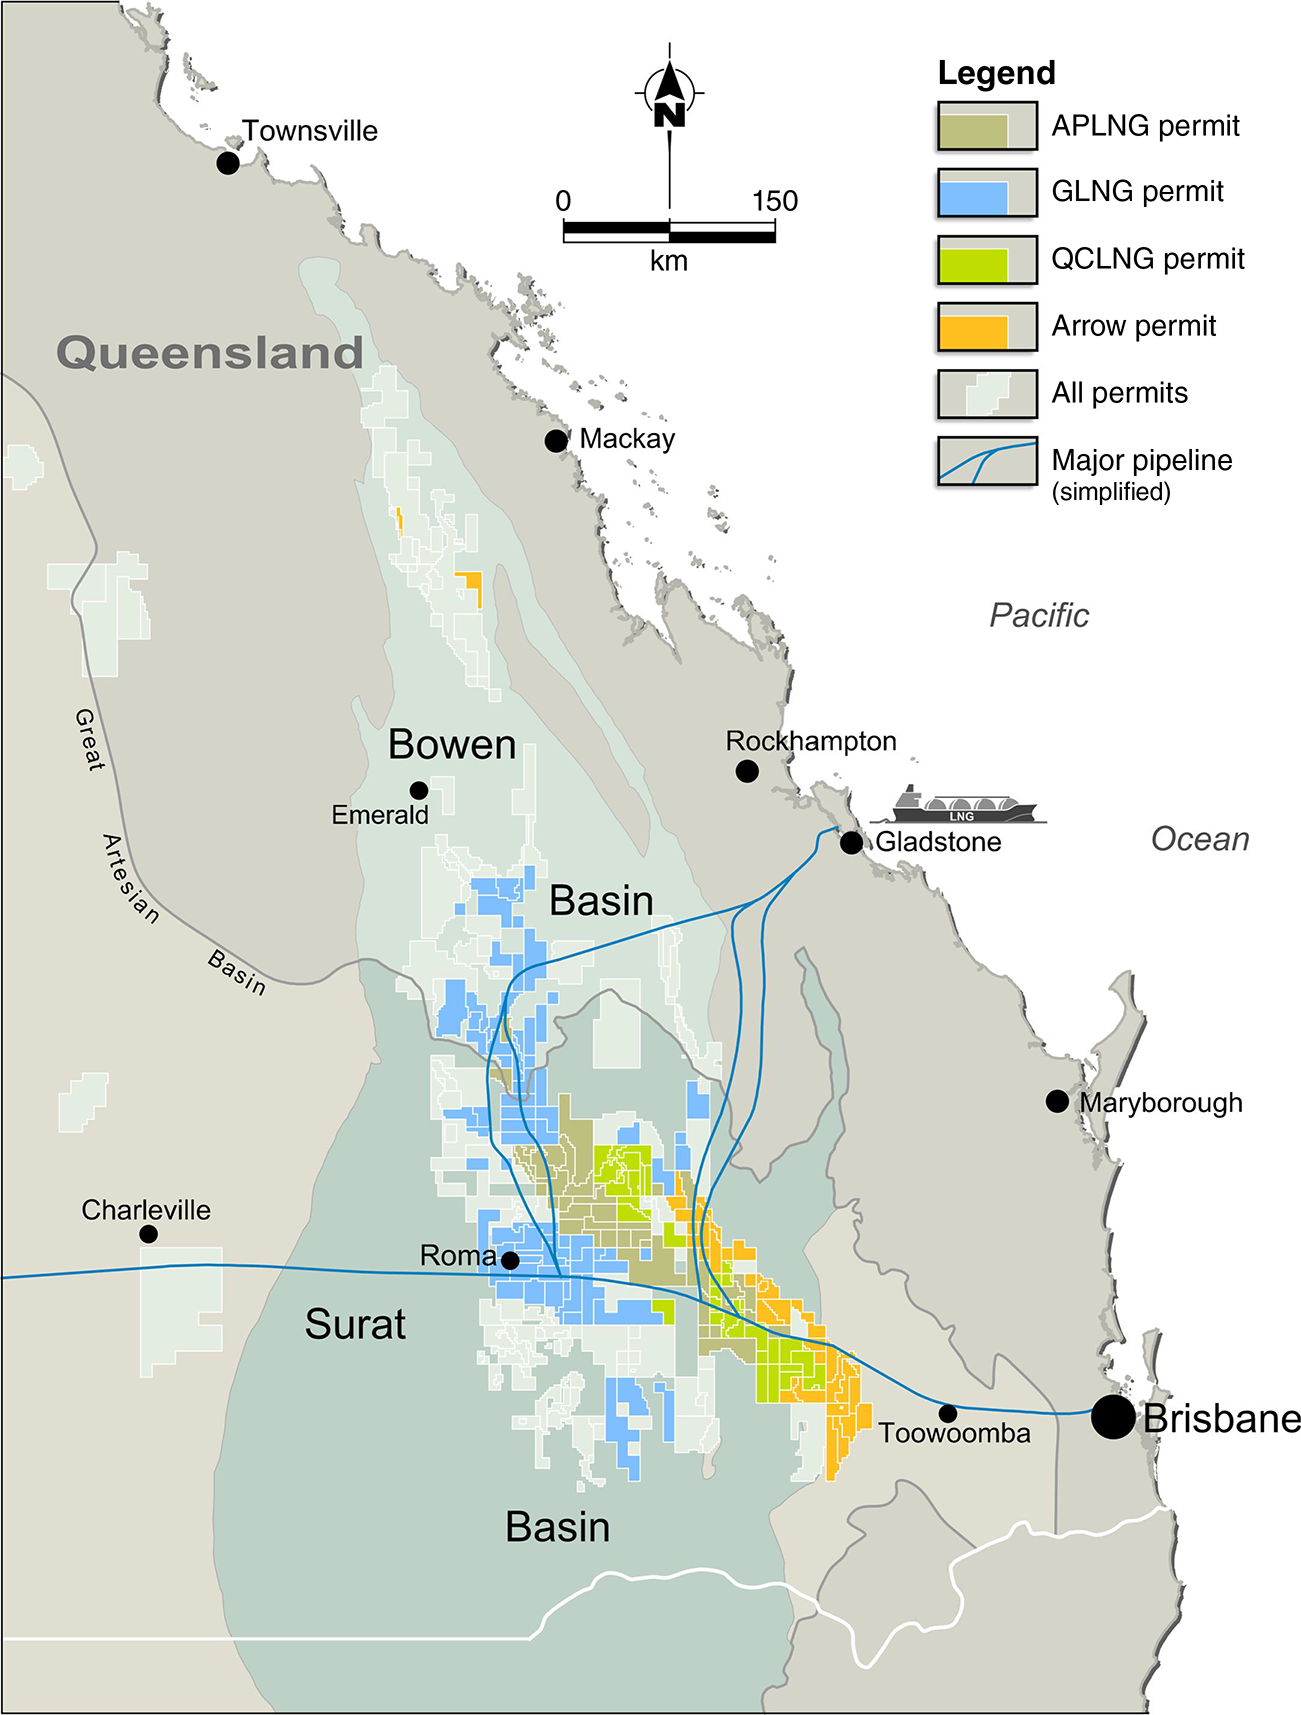
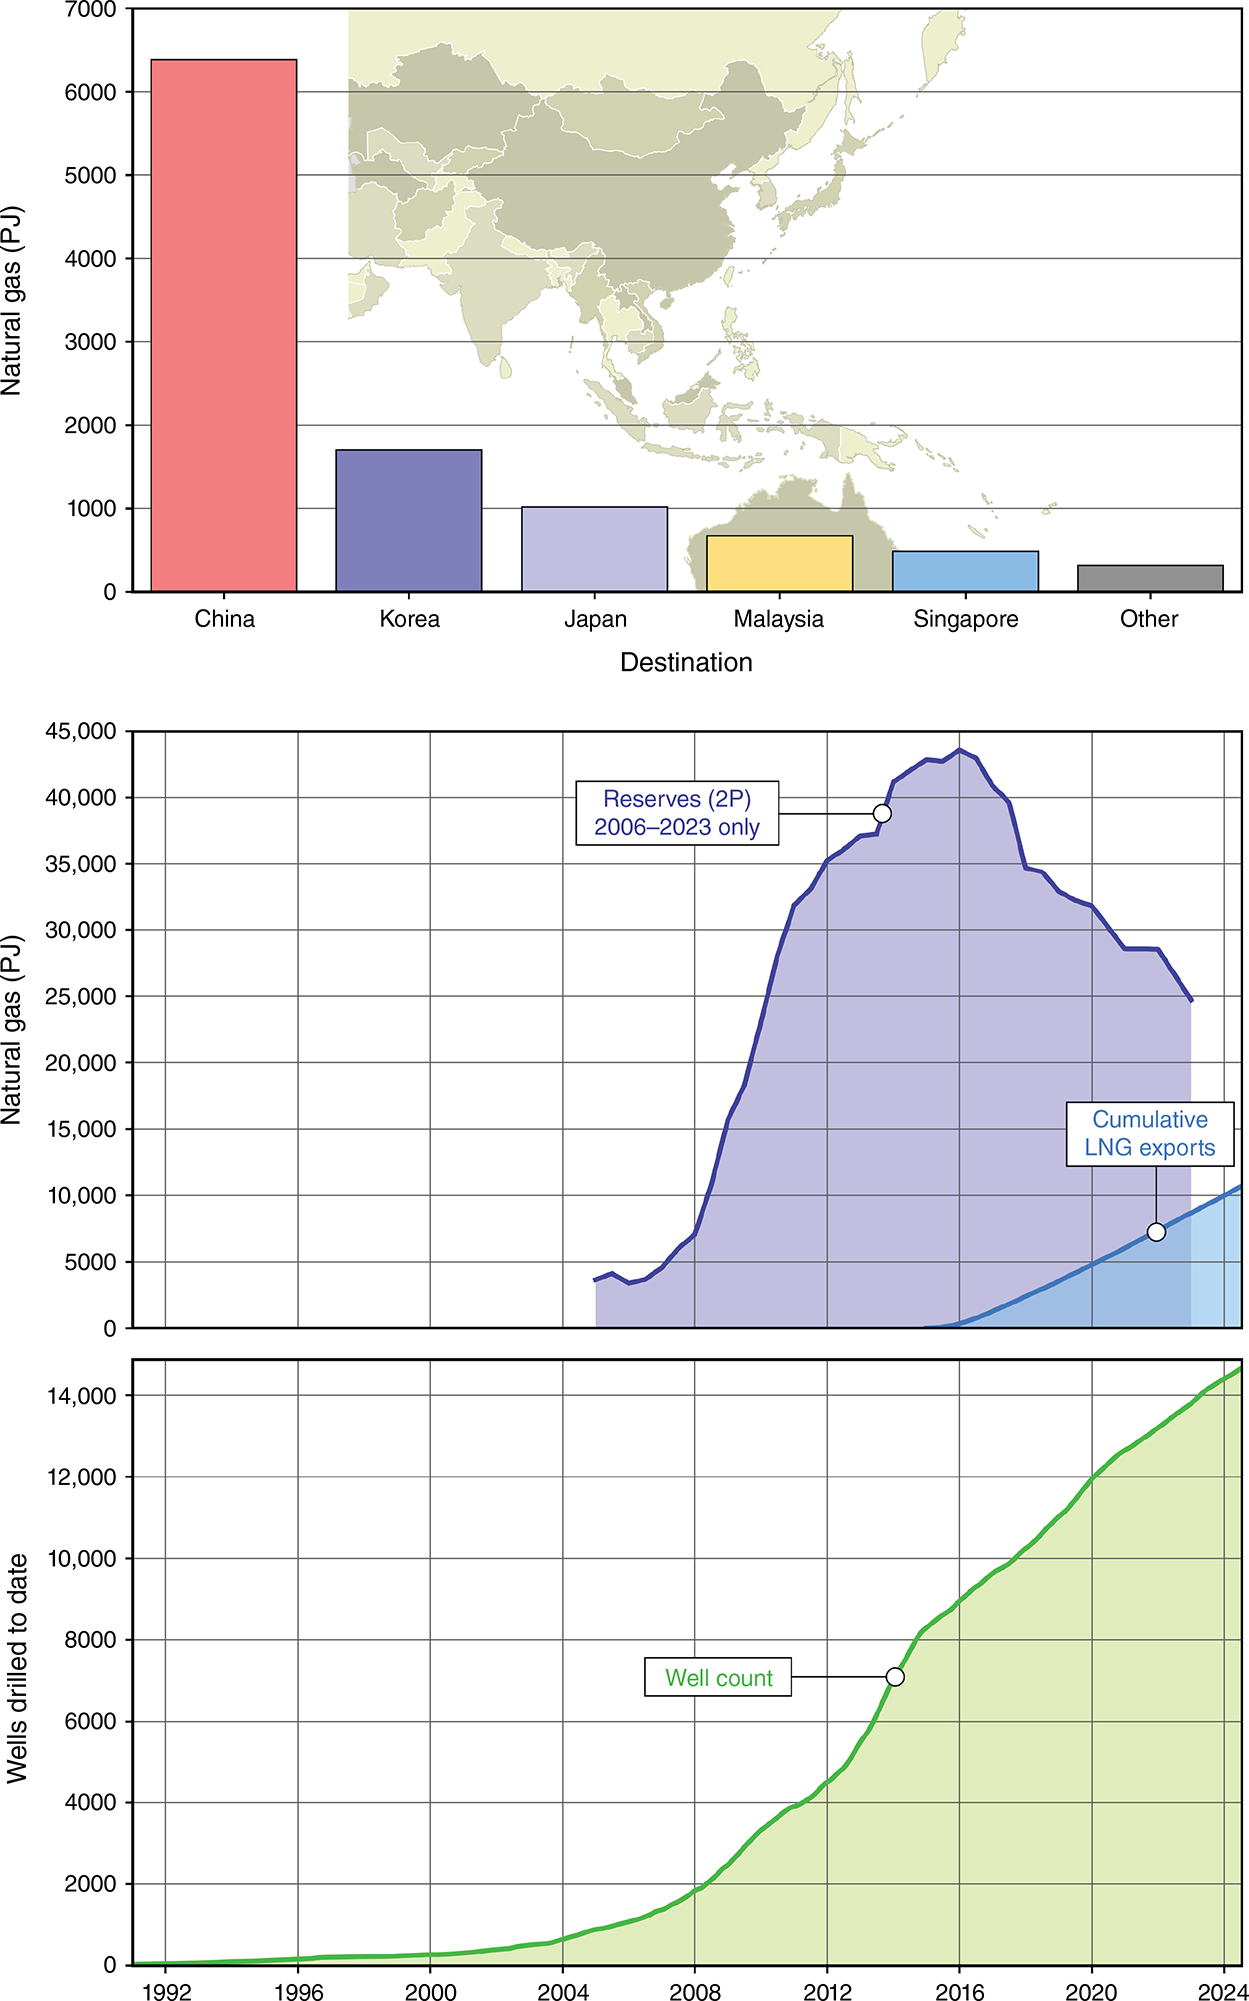
Early exploration and development were focused on the Bowen Basin; however, by 2006, material production from the Walloons had commenced at Berwyndale, and by 2008, reserves in the Surat Basin exceeded the Bowen Basin. The broader acceptance that the Surat Basin CSG resource rivalled or exceeded the Bowen Basin with multi-tens of thousands of PJ potential meant that the scale of the Queensland CSG industry was now clarifying and attracting international attention. 2P reserves in 2008 were ~8000 PJ, but these would increase to a peak in 2016 of over 40,000 PJ (Fig. 6).
LNG cargo destination from Queensland CSG to LNG projects (top). Queensland CSG 2P reserves growth and cumulative LNG exports (middle) and well count (bottom).
The year 2008 saw major international companies seek first-mover advantage and farm-in or acquire to gain access to the globally significant unconventional resource that Queensland CSG had become. BG moved first and took a major stake in QGC and unsuccessfully attempting friendly and then hostile takeovers of Origin, before ultimately acquiring QGC outright but not before QGC acquired Sunshine Gas in a friendly bid. Petronas took a material position in Santos’ acreage and reset valuations upwards to ~A$1.50–1.75/GJ of proved, probable, and possible 3P reserves (Origin 2009). Shell acquired a 30% interest in Arrow’s Australian tenements (prior to the 2010 transaction that saw Shell and PetroChina fully acquire Arrow Energy). Conoco also re-entered Queensland CSG, having previously entered and exited the play, this time through a JV with Origin.
Santos was the first proponent to lodge an Initial Advice Statement (IAS) to the Queensland Government agencies in July 2007; QGC and BG followed in 2008 and Origin and Conoco in 2009 (Downey et al. 2019). In the following 3–4 years, each of the proponents formed projects and brought in further partners (Table 2), and by 2011, three projects had reached a Final Investment Decision (FID; Gladstone LNG, Queensland Curtis LNG, and Australia Pacific LNG). Towler et al. (2016) and Downey et al. (2019) provide thorough summaries of the key aspects of project development from FID until first exports, 2015 and 2018 respectively. The following summary and charts provide contemporary development and production data to 2024.
| Founding proponent and ultimate project | Proponents at IAS (2007–2009) | FID date and partners at FID | First LNG export | Comments | |
|---|---|---|---|---|---|
| Santos and Gladstone LNG (GLNG) | Santos (100%) | FID in 2010 | Train 1: September 2015 | ||
| Santos (30%) | Train 2: May 2016 | ||||
| Petronas (27.5%) | |||||
| Korea Gas Corp (15%) | |||||
| Total (27.5%) | |||||
| Origin Energy and Australia Pacific LNG (APLNG) | Origin Energy (50%) | FID in 2011 | Train 1: January 2016 | Conoco purchased 10% project equity from Origin in 2022 | |
| ConocoPhillips (50%) | Origin Energy (37.5%) | Train 2: October 2016 | |||
| ConocoPhillips (37.5%) | |||||
| Sinopec (25%) | |||||
| QGC and Qld Curtis Island LNG (QCLNG) | QGC (100%) | FID in 2010 | Train 1: December 2014 | BG was subsequently taken over by Shell in 2016 | |
| BGA | BG (93.75%) | Train 2: July 2015 | |||
| CNOOC (5%) | |||||
| Tokyo Gas (1.25%) | |||||
| Arrow and Surat Gas Project | NA | NA | NA | Shell and PetroChina took over Arrow in 2010 and agreed a long-term gas supply agreement with QCLNG in 2017 |
From the first LNG cargo, shipped by Queensland Curtis LNG (QCLNG), in 2015 to late 2024, the combined CSG to LNG projects produced 12,754 PJ of which 10,538 PJ was LNG feedstock, with the vast majority of the LNG cargoes exported to China (Fig. 6). The remaining 2216 PJ flowed to the domestic market and equates to a domestic supply of ~15% of total production and ~30–35% of supply to the ECGM. The 15% domestic supply is higher than the actual delivered domestic production as a ratio of exported volumes in Western Australia of ~10%, despite there being a Western Australian domestic gas reservation policy target of 15%.
There have been over 14,000 CSG wells drilled in total, about half in the lead-up to first-gas exports in 2015–2016, and half since as unconventional gas projects require constant replenishment of the well-stock due to natural decline (Fig. 6). The annual, ongoing investment to maintain, at least to date, production at current levels is on the order of A$3.5–4 billion, split ~80–20% between capital expenditure for wells and infrastructure and ongoing operational expenditure on people, consumables, etc., based on the 2022–2023 financial year estimate of ~A$3.9 billion by Lawrence Consulting (2024).
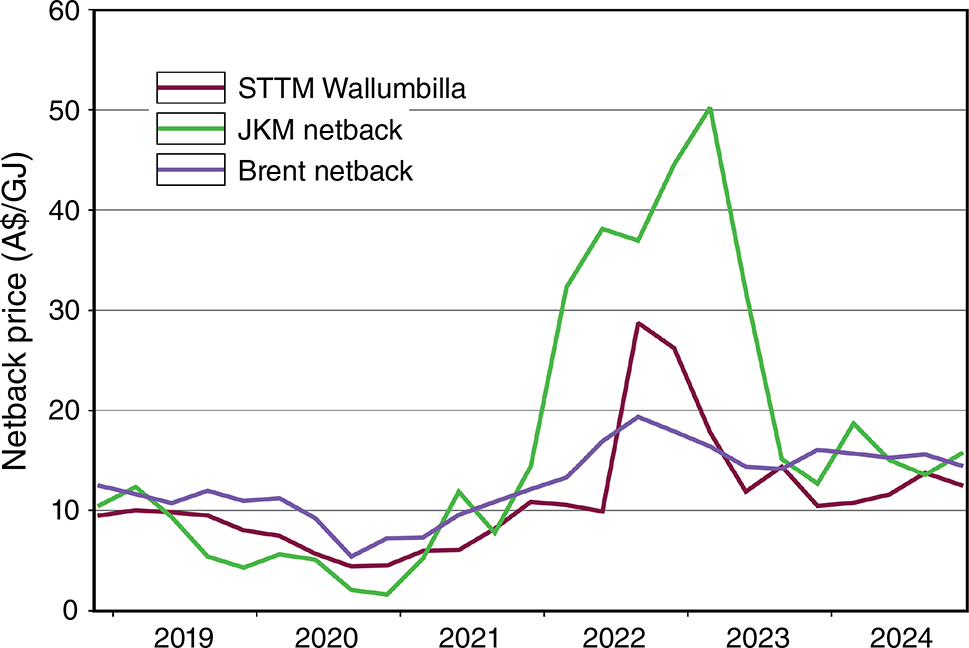
Gas spot prices across the various sales points within the ECGM have increased from <A$5 pre-2015 to track LNG netback prices of approximately A$10 from 2017 to 2021, and they have since been more volatile, fluctuating from A$10 to A$20 as domestic and global markets responded to various domestic and international inflationary pressures (Fig. 7). The increase in prices has led to ongoing government interventions and repeated calls from gas users, politicians, and other stakeholders for a gas reservation policy.
Chart of Wallumbilla short-term trading market (STTM), Japan–Korea Market (JKM) netback, and Brent oil net back prices from (source: AEMO and ACCC).
There are approximately 21,000 PJ 2P reserves remaining across Australian Pacific LNG (APLNG), Gladstone LNG (GLNG), and QCLNG collectively, of which approximately 80% is anticipated to be required to maintain contracted volumes out to the mid-2030s when many of the foundation LNG sales contracts expire (ACCC 2024). How the Commonwealth treat future export approvals, which are now required since the Australian Domestic Gas Mechanism came into effect in 2017, remains to be seen; it is our view that there is an underappreciated risk that future investment may be insufficient to maintain the capacity to meet peak domestic production requirements if there is heavy-handed market intervention by the Commonwealth through the approval process.
Gas-powered generation in the National Electricity Market
The National Electricity Market (NEM), from inception until relatively recently, relied almost entirely on coal-powered-generation (CPG) to meet baseload demand and GPG and hydro to meet peak demand, which has oscillated consistently at ~30–35 gigawatts (GW) since 2005. However, CPG capacity and generation has reduced in the NEM as solar and wind generation capacity have been rapidly installed to decarbonise the grid in line with state, national, and international targets (Fig. 8). Aggregate GPG has also consistently declined as a percentage of total generation since peaking at ~10–15% in 2014 (Fig. 8).
NEM historical generation from 2009 to 2024 showing the substantial decline in contributions from coal and gas and increases in wind, utility solar, and rooftop solar (source: EnergyQuest). PV, photovoltaic or ‘solar’.

GPG utilisation is highest in SA where, until as recently as 2019, it provided approximately 50% of total generation; however, GPG contribution has effectively halved in the 5 years since as VRE generation has increased. GPG remains critical for energy security in SA, however, which was the subject of 401 of AEMO’s total of 402 security directions in FY23 (AEMC 2023). These directions are primarily intended to ensure system security or that sufficient supply is available during periods of market tightness, both areas where GPG plays a significant role in SA.
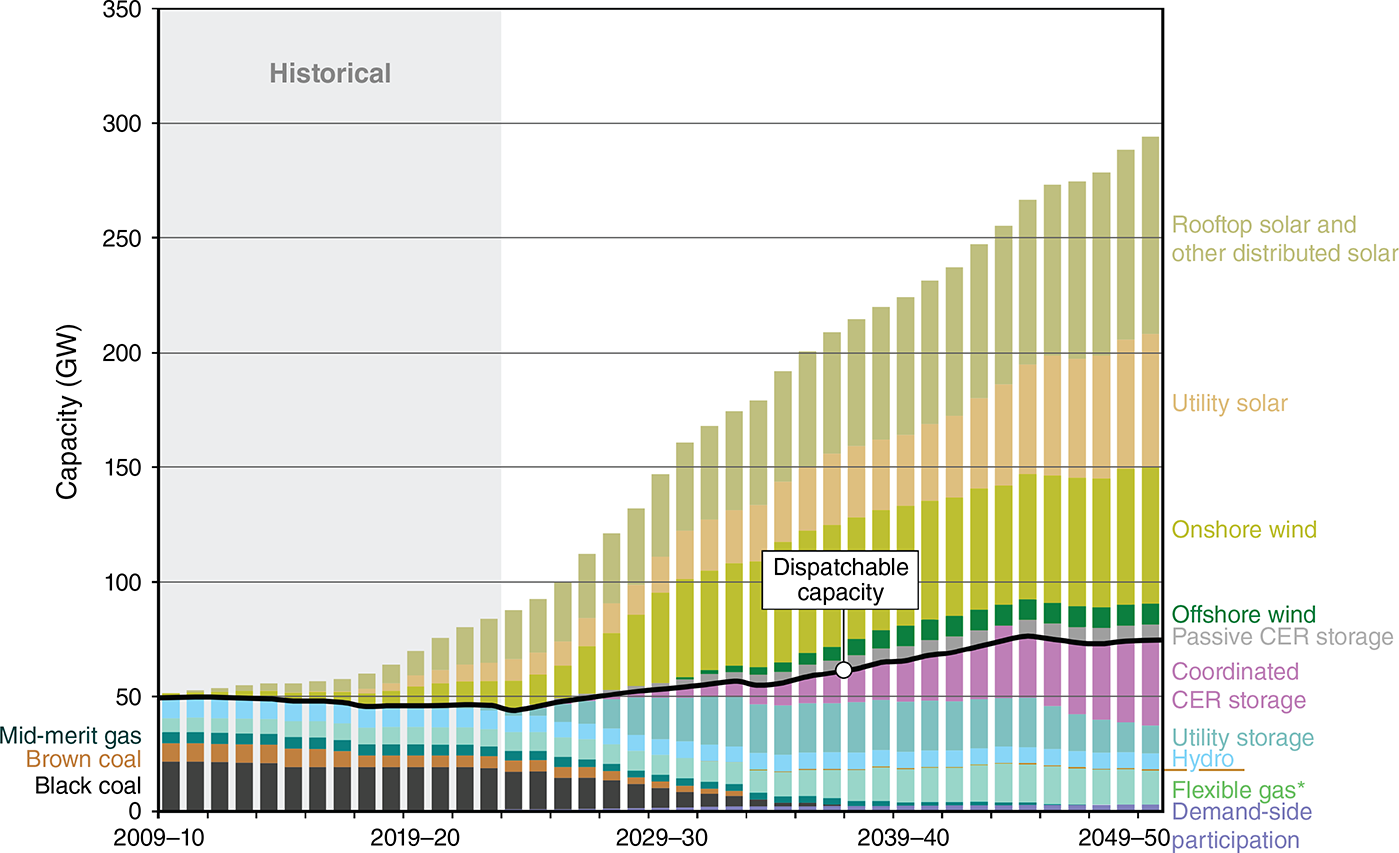
The AEMO 2024 Integrated System Plan (ISP) Step Change scenario projects CPG to effectively exit the NEM from the mid-2030s (Fig. 9). In contrast, the ISP anticipates substantial (~15 GW) GPG capacity to ‘…back-up supply during long periods of “dark and still” renewable droughts…’; however, there is significant uncertainty in long-term GPG demand.
NEM capacity data (historical and outlook) from the ISP Step Change scenario showing reduction in black coal and brown coal capacities since the mid-2010s and retirement by the mid-2030s. CER, Consumer Energy Resources. *Flexible gas includes potential hydrogen capacity.
The AEMO 2024 ISP models that GPG will serve as a ‘strategic reserve for…reliability and security, so is not forecast to run frequently…’ even if only running at ‘…just 5% of its annual potential…’. Setting aside the economic challenges of low utilisation, there is also a fundamental risk caused by consideration of average annual utilisation. This disguises the fact that, as aggregate GPG usage declines, the system becomes more likely to be exposed to very large, and unpredictable, gas demand peaks on the order of triple or more historical maxima (Fig. 10). This tripling of winter peak daily demand, coupled with its volatility, can’t be met with the existing supply and infrastructure and would require substantial changes in pipeline infrastructure and/or gas storage and/or gas field/supply location and/or gas import facilities and/or all of the above.
Actual and forecast NEM and Northern Territory annual gas consumption (bars, left axis) and seasonal maximum daily demand (lines, right axis) (modified from AEMO 2024, Step Change scenario).
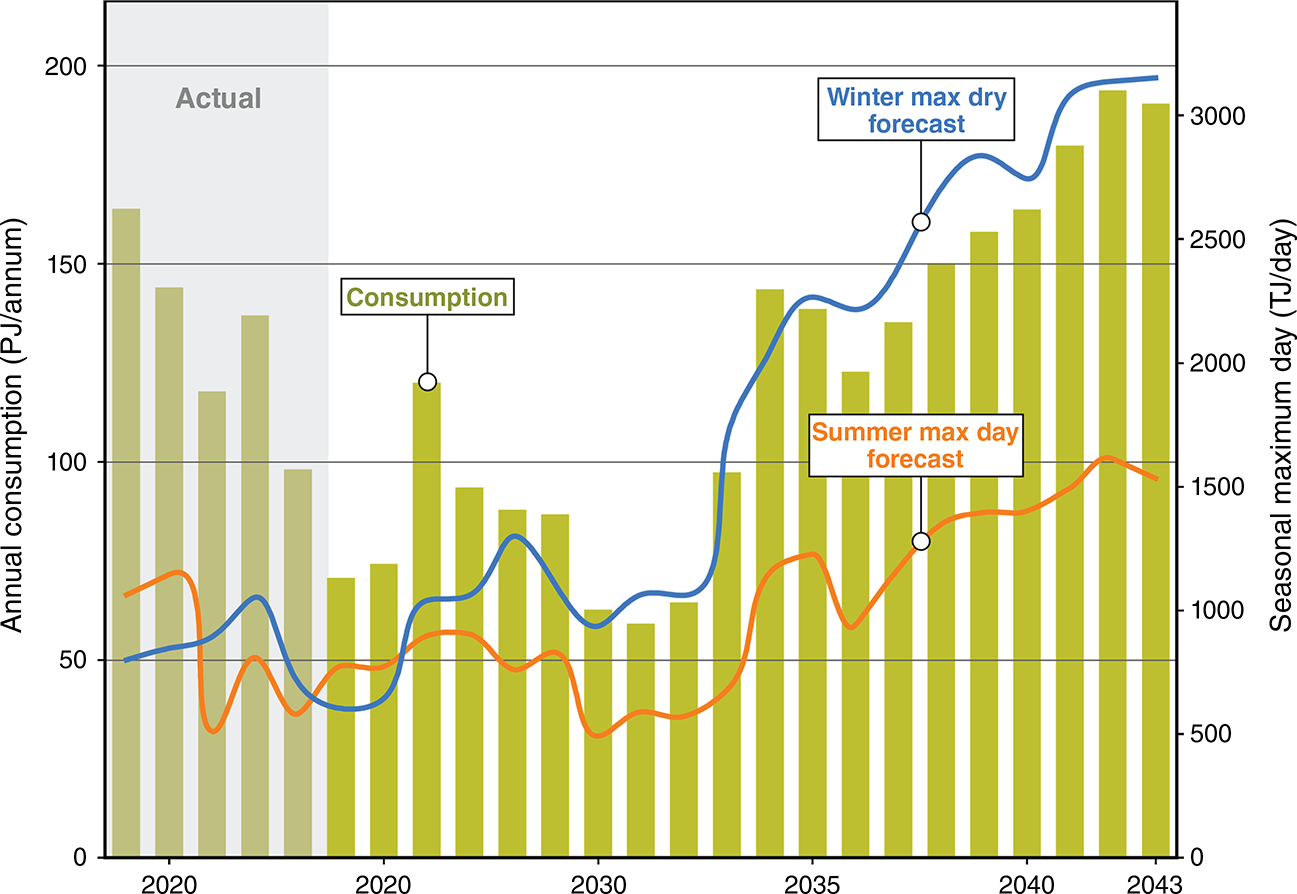
The marked change in maximum daily quantity (MDQ) volumes from 2035 (Fig. 10) coincide with major coal-plant retirements. Modelling by Lane et al. (2025), based on the ISP, also shows that although average, annual GPG utilisation is likely to be low, when the GPG fleet is active, it will be running at very high utilisation rates, which suggests there will be very little redundancy in the system with limited options to fall back on, potentially leading to greater risk of generation-led demand shortfalls.
The primary risk of gas shortfalls impacting GPG and the NEM are in the southern states (Victoria, NSW, ACT, SA, and Tasmania) during periods of low VRE generation due to cold, cloudy, and relatively windless conditions – most common during the autumn and winter months. The decline of Gippsland Basin production is the largest single factor in this already increased and continuously increasing risk. There has been insufficient (and relatively minimal) supply replacement for the production lost out of the Gippsland Basin through either new field development or gas transport capacity from locations that have developed new fields (i.e. Queensland or NT).
Discussion
The risk of gas shortfalls in the southern states in the coming years has become increasingly clear and urgently articulated over recent years. The role gas transport limitations play in this risk is, arguably, also understood. However, our view is that the upstream gas supply contribution is an underappreciated risk factor and that current policy settings in relation to gas supply could, unintentionally, worsen this risk. Government policy plays a critical role in energy transitions, particularly incentivising growth or decline in specific technologies, such as the Queensland Gas Scheme and the growth in CSG, the Renewable Energy Target Small-scale Renewable Energy Scheme, and the growth in rooftop solar. State government policy in NSW and Victoria, however, has not been conducive to investment in the gas sector – supply, transport, or storage. These states have variously introduced moratoria and bans, changed tenure rules, and disrupted approval processes, amongst other things, which have collectively contributed to a lack of exploration and development activity. Alternatively, Queensland and SA have not prevented or discouraged ongoing investment in gas supply through material policy impediments. These state settings, however, may not be sufficient to continue to support investment if there are Commonwealth interventions through the Australian Domestic Gas Market Mechanism (ADGSM) or the Gas Market Code.
An emerging risk to the ongoing successful intersection of the ECGM and the NEM is that as the MDQ of gas required to meet peak daily gas demand in the NEM increases, the MDQ that the ECGM can deliver is declining. With 2024 production, transport, and GPG facilities it would not be feasible to service peak daily volumes of the 3000+ TJ/d that the ISP calls from around 2035. Without Queensland’s LNG-scale projects, it would be all but impossible to meet such a large peak daily demand given the much lower steady-state domestic gas demand. Somewhat counterintuitively, the ECGM must continue to support major gas exports if it is to have capacity to meet peak domestic demand.
The stated intent of the ADGSM is to ensure ‘…there is sufficient natural gas supply to meet the needs of Australian energy users’, and we concur that, in the short-term, diverting gas production from already developed fields would achieve this. The diverted gas would come from CSG fields developed in Queensland, primarily to decrease the risk of GPG shortfalls during peak demand periods in Victoria and NSW, and it still won’t be enough without substantial infrastructure upgrades given current pipeline and southern gas storage constraints. Based on October 2024 LNG exports from Queensland, there’s an approximately 50% chance that diverted gas volumes would otherwise have been headed to China as LNG. Chinese companies have invested tens of billions in Queensland as JV partners in developing gas for export as LNG, and these projects now supply ~20% of China’s LNG imports, a material quantity for Australia’s largest trading partner.
The CSG developments in Queensland require annual investment of close to A$4 billion (Lawrence Consulting 2024) to maintain production around current levels. If the ADGSM is enacted, project owners may perceive it likely that the benefits of their ongoing investments will accrue to others and may, therefore, choose to decrease their investment. If investment decreases, production will begin to decline relatively rapidly and increase the risk of overall gas supply shortfall. The ADGSM may have material, unintended, negative consequences, and the Commonwealth and state governments must consider how to incentivise sufficient gas supply to avoid such a blunt intervention.
The impacts of the Commonwealth’s Competition and Consumer (Gas Market Code) regulations 2023 (the Gas Code) on the ECGM should provide further pause for a government intent on using the ADGSM. The Australian Competition and Consumer Commission (ACCC) reported (ACCC 2024) that ‘…there has been little gas available at the $12/GJ reasonable price level…’ for buyers in 2024 and that they ‘…do not expect the Gas Code to have had a material impact on observed prices…’.
The investment delays brought about by the introduction of the Gas Code, along with the complexity of administration and compliance, and the heightened sovereign risk for foreign direct investment in Australia, are all tangible, negative outcomes that were not intended by the original policy, which has also not delivered its intended purpose of increasing the volume of gas at ‘lower’ prices. The risks of geopolitical and investment consequences are likely to be heightened by the fact that neither Victoria nor NSW have provided an investment setting for local gas supplies to be developed at sufficient scale since the Queensland CSG projects ramped up in the 2010s. Queensland gas development meets all its domestic supply needs as well as LNG exports. In winter 2024, gas flow from Queensland was at maximum pipeline capacity in support of the southern states. Without CSG and the associated LNG developments, the southern states would have been in an even more serious shortfall situation.
If gas supply sufficient to meet the ECGM and NEM needs isn’t available out to 2050 and beyond, then the AEMO and CSIRO conclusion that a high renewable energy system can be both reliable and low-cost is no longer valid. The importance of gas to AEMO’s future, low-emissions electricity grid can’t be overstated and is much more important than the aggregate use of 5% might suggest, as it is during that 5% of time there are literally no other electricity supply sources available.
Alternative energy storage technologies, such as lithium-ion batteries, flow batteries, green hydrogen, or seasonal biofuels stored on a massive scale, or a massive scale-up in pumped-hydro each have fundamental challenges to scaling to match the role that GPG is anticipated to play. For example, replacing just a 200 TJ/d gas supply with lithium-ion batteries would require 50–60 GWh of storage, approximately 20 times NEM storage capacity in 2024, and would cost on the order of $5 billion to build (based on an optimistic $100/kilowatt-hour unit cost) – the cost for such technology to substitute 3000 TJ/d or more of GPG is currently, and likely to remain, prohibitive. Batteries will continue to grow their importance in energy system management and time-shifting renewable generation but most likely in concert with GPG, not entirely instead of GPG (although the daily peaks that GPG have relied on for decades will largely be met by lithium-ion batteries in the future based on current trends).
There is no perfect foresight in such complex matters, but the long-term gas supply risk must be taken seriously by all policymakers. It is almost certain that new supply sources, or material imports, will be needed to keep gas supply secure for the decades it will be needed.
Conclusion
The ECGM took decades to form and was built on world-class conventional fields in the Gippsland and Cooper basins, and smaller, but still important, conventional fields in the Otway and Bowen/Surat basins. The decline of the Gippsland Basin fields, despite being inevitable, has not been prepared for and there is very little supply replacement coming in the southern states. Ultimately, the massive scale of the CSG fields of the Bowen and Surat basins have dwarfed the scale of the ECGM foundation fields and basins, enshrining Queensland as the future of gas security in the ECGM.
As the NEM transforms, retiring coal-plants and massively increasing wind, solar and battery storage capacities, GPG will remain a critical part of total system security. Although the role is critical, it is on aggregate currently and likely to remain a relatively small overall part of NEM generation. However, without GPG, the ability to meet reliability expectations would not be feasible, as there are no alternative long-duration energy storage technologies that are viable.
The export-scale of the Queensland CSG industry, producing approximately 4 PJ per day, means that there are daily volumes of gas in the ECGM that approach the types of peak MDQ expected in the NEM. However, the gas transport network is not currently sufficient to move such volumes, notwithstanding the majority of these volumes are contracted as LNG supplies. The former challenge is physical infrastructure, the latter commercial and geopolitical – neither easy to solve.
If the Queensland CSG export industry is curtailed or naturally declines while substantial NEM GPG demand remains, that demand will almost certainly have to be met by imports or new domestic field developments – Narrabri, North Bowen, Deep Bowen/Taroom Trough, Cooper Deep Coal, Beetaloo Sub-basin, South Nicholson Basin, or some yet undiscovered resource. Current government policy is arguably not conducive to managing this long-term supply risk.
Data availability
Data not available through AEMO or the Australian Energy Market Commission (AEMC) were provided by EnergyQuest, an energy advisory firm. The EnergyQuest data that support this research cannot be publicly shared but may be shared upon reasonable request to the corresponding author if appropriate and with permission from EnergyQuest.
Declaration of funding
This research has been prepared by the University of Queensland Gas & Energy Transition Research Centre (the Centre). The Centre is funded variously by the University of Queensland, membership dues from APLNG, Santos and Arrow Energy, as well as state and Commonwealth governments or their agencies. This paper was prepared without oversight, input or review from industry or government funders.
Acknowledgements
Thanks to Steve Pickard (UpMap) for figure preparation and Adam Roberts (EnergyQuest) for data preparation.
References
AEMC (2023) Annual market performance review FY2023. Final report. (Australian Energy Market Commission) Available at https://www.aemc.gov.au/market-reviews-advice/annual-market-performance-review-fy2023
Downey P, Thomas J, Stone M (2019) From initial advice statement to export – a 10 year retrospective of Queensland’s liquefied natural gas industry. The APPEA Journal 59(1), 58-69.
| Crossref | Google Scholar |
Lane J, Rodger I, Garnett A, Close D (2025) Planning challenges for the changing paradigm of GPG operations. Australian Energy Producers Journal 65, EP24237. 10.1071/EP24237
Lawrence Consulting (2024) Economic Impact of the Queensland Petroleum Gas Sector. Available at https://energyproducers.au/wp-content/uploads/2024/09/Economic-Impact-of-the-Queensland-Petroleum-Gas-Sector-20211-23.pdf
Origin (2009) Target’s Statement by Origin Energy Limited. Available at https://announcements.asx.com.au/asxpdf/20080819/pdf/31brs9wr9qq649.pdf
Towler B, Firouzi M, Underschultz J, Rifkin W, Garnett A, Schultz H, Esterle J, Tyson S, Witt K (2016) An overview of the coal seam gas developments in Queensland. Journal of Natural Gas Science and Engineering 31, 249-271.
| Crossref | Google Scholar |
Footnotes
1 2013–2014 NSW Independent Review of Coal Seam Gas Activities in NSW; Petroleum (Onshore) Amendment (CoalSeam Gas Moratorium) Bill 2019; Petroleum (Onshore) Amendment (Cancellation of Zombie Petroleum Exploration Licences) Bill 2021; NSW Gas Plan 2013–2014; NSW Future of Gas 2020; The Environmental Planning and Assessment Amendment (Seabed Mining and Exploration) Bill 2024 amends the Environmental Planning and Assessment Act 1979 to prohibit offshore exploration.
Professor David Close is the Director of the University of Queensland (UQ) Gas & Energy Transition Research Centre where he leads a multi-disciplinary team undertaking independent research to address the complexities and challenges of the energy transition in Australia and the Asia–Pacific. David has over 20 years’ industry experience and holds a PhD in Marine Geophysics from the University of Oxford and a BSc (Hons) from the University of Tasmania. |
Rick Wilkinson is Chief Executive Officer of EnergyQuest, an Australian-based energy advisory firm, which specialises in independent energy market analysis and strategy. He has more than 35 years of experience in the energy industry. Rick was appointed a Gas Fields Commissioner by the Queensland Government, a position he held for 7 years. He is an Adjunct Professor at the University of Queensland. Rick has a first class BSc (Hons), majoring in nuclear physics from Melbourne University. |
Emeritus Professor Andrew Garnett was the Centre Director at the UQ Centre for Coal Seam Gas and Centre for Natural Gas from 2012 to 2023, overseeing multi-disciplinary research from the start of the Queensland coal seam gas developments to the successful establishment of a major export industry. He is the current Chair of the Australian Gas Industry Trust. He has over 25 years’ experience in international upstream conventional and unconventional oil and gas projects. |