

A meta-analysis of published semivariograms to determine sample size requirements for assessment of heavy metal concentrations at contaminated sites
L. E. Pozza A B and T. F. A. Bishop A
A The University of Sydney, School of Life and Environmental Sciences, Sydney Institute of Agriculture, Sydney, New South Wales, Australia.
B Corresponding author. Email: liana.pozza@sydney.edu.au
Soil Research 57(4) 311-320 https://doi.org/10.1071/SR18369
Submitted: 14 December 2018 Accepted: 14 February 2019 Published: 14 March 2019
Abstract
Soil contamination poses substantial risks to human and ecosystem health, justifying the need for accurate delineation and remediation of contaminated sites. The number of soil samples collected at a site during assessment is limited by cost and time available for assessment, increasing the potential for misclassification due to insufficient samples. Using distributions of heavy metals sourced from semivariograms provided in published studies, the first stage of this study sought to determine how many samples were required for the confidence interval around the mean to be above or below the Australian guideline value for each specific metal and study. Estimated sample size for assessing mean contamination across a site ranged from two to four samples; however, some distributions possessed a higher amount of variation and therefore required more samples. The second stage of the investigation explored sample size requirements for mapping contaminated sites. Unconditional Gaussian simulations created from published semivariograms were sampled using 15 different sample sizes, and the samples used to obtain predictions of the simulated distributions. For each sample, observed (simulated) and predicted (kriged) metal concentrations were classed as being below or exceeding the guideline values and compared through quantification of the number of misclassifications that occurred. When mapping a site of 5 km2 or less, uncertainty and misclassification decreased with increasing sample size, stabilising at around 200 samples; however, the lowest uncertainty occurred at around 500 samples. The study acknowledges this may be unrealistic and economically inefficient, so in addition to these findings it is worth exploring improvement in other areas of investigation, such as in the detection and mapping stages.
Additional keywords: confidence interval, guideline exceedance, mapping, simulation, soil contamination.
Introduction
Soil contamination is a leading global issue and is becoming more prominent with past and present industrial activity, increasing population density, and resulting urban expansion (Andronikov et al. 2000; Lee et al. 2006; Lacarce et al. 2012). An area is classed as ‘contaminated’ when substances, such as heavy metals, exceed background concentrations and this is often due to anthropogenic influences (National Environment Protection (Assessment of Site Contamination) Measure 1999, ASC NEPM)). Heavy metals are of particular concern as they are influenced by human activity and remain in the soil for a considerable amount of time (Markus and McBratney 1996). Soil contamination, especially heavy metal contamination, can have substantial impacts upon human and environmental health (Helios Rybicka 1996; Mielke et al. 1999; Khan et al. 2008) and it is therefore crucial that contaminated areas are identified and managed.
If substances occur above established guideline values at a test site, there is a need for further investigation and potential remediation (ASC NEPM; VROM 2000; BC MoE 2014). Site assessment and remediation is costly, with a report by the NSW Environment Protection Authority (NSW EPA 2013) estimating the cost to be AU$100–$200 million per year for testing and clean-up of contaminated sites. Testing methods vary depending on the site and contaminant, and are often determined using an ad hoc approach based on a priori knowledge of past activities in the area, the site-specific risk assessment, and the associated conceptual model developed in the preliminary investigation of the site (ASC NEPM; US EPA 2002a; Glavin and Hooda 2005).
Government organisations may regulate the sampling conducted by establishing recommended sampling procedures (VROM 2000; Theocharopoulos et al. 2001). In Europe, where many different guidelines are established, sampling methods may instead vary from organisation to organisation (Theocharopoulos et al. 2001; de Zorzi et al. 2008). Such a variety of methods can have significant impacts upon the accuracy of analyses and in turn affect the precision of the remediation process, resulting in false positive or false negative results (Cattle et al. 2002). Contaminated site analysis needs to be timely and cost-effective, and one way to enhance this is by improving the sampling scheme, which relates to collection of sufficient samples and locating them so they identify contamination levels appropriately.
In Australia, sampling is conducted in the preliminary investigation and the results used to inform subsequent detailed investigation (ASC NEPM). Preliminary sampling is conducted with the purpose of estimating mean contamination at the site and comparing this, along with the 95% upper confidence interval, to the developed health investigation levels (HILs) and if these levels are exceeded, further investigation is required (ASC NEPM). Further investigation involves conducting detailed sampling at the site to provide a better picture or distribution of contaminants, with the number of samples to collect guided by the conceptual site model and results of the initial sampling (ASC NEPM).
Delineating contamination at a site can use either a design- or model-based approach, depending on the purpose of the investigation (i.e. preliminary or detailed). Design-based, or probability-based, sampling approaches select points based on probability and randomisation to predict a mean or another statistic, whereas model-based approaches, also known as purposive or judgemental approaches, rely on a model for predicting means (De Gruijter et al. 2006). Many studies adopt a model-based, or systematic, sampling scheme where a grid is selected and samples are taken at set intervals (US EPA 2002b). As a result, the samples are not independent of each other and will provide a biased variance. In situations in which we wish to estimate the mean contamination or the 95% confidence interval, a probabilistic sampling scheme is best (ASC NEPM; US EPA 2002b).
In contrast, grid-based sampling is highly useful and has been recommended for mapping and kriging variables (Pettitt and McBratney 1993). Studies have also complemented grid designs with shorter scale samples taken so as to model the short-range spatial variation that may not otherwise be detected (Lark 2002; Karunaratne et al. 2014). Detecting shorter-range variation and reducing bias of samples assist in increasing precision in mapping, thus preventing site misclassification.
Aside from using a suitable sampling scheme, the number of samples (herein referred to as the ‘sample size’) can affect the precision and reliability of contaminated site assessment. Error may arise from insufficient sampling, or failing to sample in areas where contaminant concentrations are higher (i.e. ‘hotspots’) and in turn increase risk of misclassification (Tiller 1992; Cattle et al. 2002). Studies have sought to quantify sample size; however, they have been applied to assessment of soil properties such as loss on ignition, soil texture, and pH, rather than specifically for contaminants, which can be highly variable (McBratney and Webster 1983; Kerry and Oliver 2004). Past studies have also sought to determine suitable grid spacing for soil spatial analyses (Chang et al. 1998; McBratney and Pringle 1999); McBratney and Pringle (1999) used published semivariograms in the analyses. There are several studies that have conducted sampling at contaminated sites and so the question arises as to whether it would be possible to use these published studies in as part of a meta-analysis to estimate sample size requirements and provide broad guidelines for investigation.
Many published studies assessing heavy metal distribution use model-based sample approaches, which, as mentioned earlier, will have biased variances. There are three general types of studies available to predict variation at a site: those that adopt a probabilistic design, those that adopt a systematic sampling scheme but do not provide a semivariogram, and those that adopt a systematic sample design and do provide semivariograms. The latter of these were used throughout the current study. If summary statistics and variogram parameters are provided by the study, it is possible to extract an unbiased variance using a method proposed by Domburg et al. (1994).
By conducting a meta-analysis utilising variogram parameters from several compiled contamination studies, this study aimed to: (1) determine the optimal sample size for estimating mean heavy metal concentration at a site and calculation of the proportion of the site exceeding the set guideline value, and (2) determine suitable sample sizes for mapping heavy metal distribution by simulating the spatial variation described by the semivariograms from each of the studies. The outcomes of this study will provide broad indications of the range of samples required for contaminated site assessment, which may improve accuracy of decision making and improve efficiency of assessment.
Methods
Database compilation
A literature search was performed to find peer-reviewed research on the spatial variation of heavy metal contaminants. Studies were chosen if they provided experimental semivariograms, topsoil samples (up to 10 cm) and if the study area was less than 5 km2. The studies chosen covered a variety of land uses including industrial, agricultural, mine sites, and residential areas (Table 1). Data were obtained for a range of heavy metals, with the most commonly provided being lead (Pb), zinc (Zn), and cadmium (Cd), and so these were used for determining sample sizes for mean estimates of concentrations and for mapping contaminant distribution.

|
The majority of the studies added to the database used logarithmic transformations on skewed heavy metal concentrations and the transformed values were used in favour of raw values for later analyses. Some studies used transformed values in their analyses, but only provided untransformed means; to overcome this, the raw means were transformed using an equation derived from arithmetic moments and the lognormal distribution:

where μln is the normalised mean, μraw is the skewed (raw) mean, and σraw is the skewed standard deviation.
Throughout this study, heavy metal concentrations were compared with the most conservative HILs provided by the National Environment Protection (Assessment of Site Contamination) Act 1994 (Cth), which are used in Australia for contaminated site assessment. Guideline values for Pb, Zn, and Cd are 300 mg kg–1, 7400 mg kg–1 and 20 mg kg–1 respectively.
After compiling the variogram database we considered two situations: one where we wish to identify how many samples are required to estimate whether the mean contaminant concentration is below or above a guideline value, and another for mapping the concentration of the contaminant to identify whether the concentration at each spatial location was above or below the guideline value.
Mean contamination across a site
Unbiased variance and sample sizes
Equation 2 was used to calculate the 95% confidence interval (CI) around the mean. Given an estimate of the mean ( ) or the variance (s2), the sample size (n) impacts on the width of CI due to the tcrit and the standard error of the mean,
  , decreasing with increasing sample size:

It was hypothesised that the mean would not be equal to the guideline value, whereas if the null hypothesis were proven true, the mean would be equal to the guideline value. Therefore, if the 95% confidence interval did not overlap with the contaminant guideline value, the null hypothesis would be rejected.
However, to be able to calculate the required sample size, it needs to be ensured that the variances were unbiased. Many of the selected studies used systematic sample designs, for example a grid or transect design (Table 1). Since the designs had no probabilistic component the estimated variances may be biased. To extract an unbiased estimate of the variance for each study included in the meta-analysis, the method established by Domburg et al. (1994) was implemented (Eqn 3). This method estimates the variance of the sample mean of an area using the semivariogram parameters:

where  is the mean semivariance calculated using variogram parameters provided by the study and n is the sample size used in the study.
Calculation of the mean semivariance () was accomplished by simulating a matrix of 1000 sets of random pairs of coordinates within a simulated study area in the shape of a square and equal in size to each published study. All analyses were performed using R (R Core Team 2016).
Once the mean semivariance was calculated for each study, unbiased variance across each study area was obtained using Eqn 3. Subsequently, sample size requirements were quantified using Eqn 2, with a tcrit of 0.025, the degrees of freedom (n − 1) obtained in each study, and substituting the newly calculated unbiased variance of the mean into the equation. The sample size was increased until the 95% CI was above or below the guideline value.
Proportion of contaminated samples
Although the mean and confidence interval may be under the guideline value, some part of the site could still be contaminated. We estimated this for each study based on the cumulative upper probability above the guideline value using the t-distribution in Genstat 16 (VSN International Ltd 2013), based upon the optimal sample size.
Sample size for mapping contaminated sites
Simulation, sampling, and prediction
As a case study, data from a subset of studies quantifying Pb were selected for simulation. Unconditional Gaussian simulation incorporating variogram parameters from each study was used to simulate contaminant distribution via the ‘gstat’ package in R (Pebesma 2004). A total of 1000 simulations were created for each study, with the set grid area closely resembling the original study area to maintain proportions.
From these simulated fields, the sample design consisted of 90% of locations being on a grid and the remaining 10% taken a short distance from randomly selected grid points. The latter portion of samples would provide short range samples for variogram modelling, similar to the approach suggested by Lark (2002). The range of sample sizes tested included 40, 60, 80, 100, 120, 140, 160, 180, 200, 250, 300, 350, 400, 450, and 500 samples. Each tested sample size was used to map soil contamination using ordinary kriging for mapping onto the grid.
Prediction quality
The simulated grid values were assigned a class based on whether the Pb concentration exceeded (thus classed as ‘contaminated’) or was less than the guideline value (and so classed as ‘uncontaminated’). These classifications of the simulated values formed the ‘observed’ classes, or ‘truth’. The predicted values underwent a similar process; however, the guideline values were compared with the prediction intervals of each point, and used an additional classification of ‘high uncertainty’ where the guide value lay within the prediction interval (Fig. 1). The allocated classes of corresponding point locations within the observed and predicted datasets were then compared, and if they matched, they were assigned the class of ‘correct’, whereas if they mismatched, they were classed as ‘error’ (Including Type I or II); if the prediction interval indicated high uncertainty, the point was classed as ‘uncertain’.

|
Results
Exploratory data analysis and data compilation
The compiled studies incorporated a variety of sample sizes, mean concentrations, and semivariogram parameters (Table 2). Sample sizes ranged from 48 to 665 samples and these were taken over areas from 0.0004 to 3500 km2. Some studies presented mean values as logged, others presented the raw values and logged them before variogram analyses, and some used the raw values without transformation. Variogram models included linear, spherical, double spherical, Gaussian, exponential, and stable. The majority of nugget values were less than 1.0; however, some studies obtained a nugget semivariance of over 151000 as the data were not transformed before analysis. Distance parameters were often related to area size (i.e. the larger the area, the larger the distance parameter), yet this was not always the case. Mean values for many of the studies exceeded the most conservative ASC NEPM guideline values (20 mg kg–1 for Cd, 6000 mg kg–1 for Cu, and 300 mg kg–1 for Pb).

|
Sample size for mean contamination
The predicted sample sizes required for each study were very different to the sample sizes actually used (Table 3); this is justified as the purpose of these studies was to map contamination rather than estimate mean content. More samples were required for Pb compared with Cd and Cu. Overall, the majority of sample sizes required to determine whether the mean concentration was significantly different from the guideline value was four samples or less, which is quite a small number of samples in relation to the size of the study area. Some studies required a much greater sample size, such as that by Shi et al. (2008) for Cd, which required 108 samples; and the study by Bourennane et al. (2006), which required 122 samples to determine whether Pb exceeded the guideline value. Key drivers of the sample size requirement were the variability and how close the mean was to the guideline value.

|
Although we could calculate the mean and show that it was significantly greater or less than the guideline value, some of the site may still contain concentrations that exceed the guideline. To detect whether or not areas of elevated concentrations were missed, the proportion of each area exceeding the guideline was calculated based on the estimated sample size (Table 3). Overall, the proportion of each site exceeding the guideline values for Cd and Cu were very low, except for the study by Shi et al. (2008) observing Cd. There were two studies in which >90% of the site exceeded the guideline value for Pb; however, it was studies in which the mean did not exceed the guideline but showed a proportion of values exceeding the guideline that would be at greatest risk of misclassification. Contaminant distribution is most often heterogeneous and obtaining a mean value does not provide an accurate representation, increasing risk of misclassification. More accurate representation could be obtained by mapping contamination at a site.
Sample size for mapping contamination
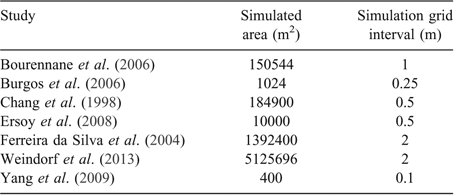
A subset of study parameters was taken from the Pb dataset and used in a simulation exercise to determine optimal sample size for mapping. Study area size (and therefore size of simulated fields) varied among studies, and as a result, grid intervals also varied to ensure the total number of grid points in the simulated fields remained consistent (Table 4).
|
Comparison between observed (simulated) and predicted classifications indicated that increasing sample size increased the number of points classified as correct while decreasing the amount of uncertainty (Fig. 2). Increasing sample size also resulted in an increase in the amount of error; however, the rate of increase was relatively small (maximum 5% increase overall). Regardless of sample size, uncertainty of predictions remained much higher than the number of samples classified correctly, where the majority of the studies had >50% of points classed as uncertain. The rate of change varied between studies, with larger study areas having lower rates, but there was generally no more than 10% increase in correct classification. There was an inflection in the results from simulation of Ersoy et al. (2008) (Fig. 2) and substantial variation throughout the categories for that specific study.

|
Rather than classifying based upon a prediction that is common among studies, the current study classified based upon calculated prediction intervals. Based on the calculations, the prediction intervals presented in the study are quite large and sample size does not greatly affect them. In terms of selecting a suitable sample size, this varied for each study and the number of points correctly classified stabilised at around 200 samples (except the first set of results from Ersoy et al. (2008)), but was slightly better around 500 samples.
To understand the underlying mechanisms for the trends, Pearson correlations were used to compare the % values for each category with variogram parameters of each study, mean, area and sampling density (Table 5). Nugget semivariance (c0) influenced all categories negatively, but the greatest indicated the higher the nugget semivariance, the lower the number of points classified as ‘correct’. As the structural semivariance (c1) increased, error also increased, but this did not seem to influence uncertainty (r = 0.183). The distance parameter for the variogram was also related to error (r = 0.533) as well as the mean, and error decreased with increasing mean (r = −0.462). Sample area also shared a relationship with the magnitude of error and uncertainty (r = 0.681 and 0.445 respectively), both parameters increasing as area increased.

|
Discussion
Meta-analysis
This study used a novel method to provide an indication of broad sample size requirements for assessment of heavy metal contamination by obtaining variogram parameters from a variety of studies. Using previous studies provides more realistic values, rather than simulating an ideal (and often less likely) scenario, as contamination can be highly variable both spatially and in magnitude (Glavin and Hooda 2005). The studies obtained encompassed a variety of land uses and sources of contamination, helping make this study more widely applicable to several situations.
Estimating mean contamination across a site
The number of samples required to show whether the 95% CI of the mean concentration exceeded the guideline values was relatively small. The majority required four samples or less; however, some exceeded this, most likely due to the variance in relation to the sample size, inducing a wider confidence interval compared with other studies. This could be attributed to various influencing factors including the original contamination source, its location, historical land use, soil morphology, climate, and anthropogenic factors affecting environmental dynamics.
Calculation of the proportion of each site exceeding the guideline was valuable as it demonstrated that although the mean may not exceed the guideline, there were still points on the site that did exceed it. The inverse was also true, with some means exceeding the guideline, yet some proportion of the site did not exceed it. Detailed investigation may negate this issue if sufficient samples are taken. Furthermore, it was useful to observe the proportion of each site exceeding the guideline values and compare these with the sample size requirements as studies with higher sample requirements possessed greater variability at the site, which may have been missed if only a small number of samples were taken. The outcomes of this research demonstrate the importance of calculating proportion of the site exceeding the guideline values, rather than relying upon the mean value alone.
Although it is useful to use the mean to obtain an overall indication of the concentration at a site, especially if samples are limited; there is much variation that may be missed. This is especially true in terms of soil contamination as there may be a mix of diffuse and point sources; these point sources may be missed, potentially undermining scientific findings and resulting in failure to remediate where it is required (Marchant et al. 2011). It is therefore more reliable if a site were mapped using interpolation to obtain more precise predictions.
Mapping contaminant distribution
A suitable sample size was suggested to be around 200 samples as the rate of change in classification error and uncertainty stabilised around this value. Based upon prediction intervals and determined classes, the lowest amount of uncertainty was detected around n = 500, indicating the more samples, the less the uncertainty, which may not be realistic in many cases. Obtaining 500 samples over any study area would be very costly both economically and temporally, and regardless of sample size, uncertainty was still quite high with little decrease with increasing sample size. With increasing sample size, the amount of classification error increased, rather than decreased, so this would also need to be weighed up when deciding upon the number of samples to collect. Contaminated sites, especially following environmental catastrophes, require urgent and timely assessment and so unless the resources can be afforded, collection of so many samples would not be economically sound. Complementary methods in both physical assessment and mapping are worth exploring; for example, the use of proximal sensing would allow the collection of more samples (Horta et al. 2015), and the use of covariates as supplementary data may provide a more accurate map of contaminant distribution (Johnson et al. 2017).
It is essential to use unbiased variances when calculating CIs for comparison with guideline values. To ensure unbiased variances it is recommended to use design-based sampling schemes, or, if not practical due to site access and cost, use correction methods such as the Domburg equation (Domburg et al. 1994). It could also be useful to explore sampling methods that are able to take available information, such as that obtained in initial site investigation, into account. Building of a conceptual model for contaminated site assessment depends upon collection of information such as site history, layout, and topography (ASC NEPM). This site information may also be useful in development of a less biased sampling scheme. Conditioned Latin Hypercube sampling derives a sampling scheme that takes ancillary variables into account, thus reducing bias (Minasny and McBratney 2006).
It is good to estimate the mean contaminant concentration of a site; however, to delineate areas that exceed contamination guideline values and inform remediation, greater detail needs to be used to reconcile cost and efficiency. The research findings in this paper and those presented in the compiled studies provide further evidence of the importance of mapping and interpolation.
Conclusions
The number of samples required for estimating whether the mean exceeds the guideline value were very low. However, evident through the calculation of proportion of site contamination, estimating the mean may miss a large portion of the variation at the site, especially as heavy metal contamination is highly variable. Therefore, it is better to use interpolation methods such as kriging to detect this variation. Estimates of plausible sample sizes for mapping a site was estimated at 200, with 500 samples resulting in the lowest amount of uncertainty. Collecting so many samples may be unrealistic in many cases and therefore shows that sample sizes and schemes are site-specific. To improve accuracy, it would be worth exploring improving efficiency in other facets of contamination assessment, such as in detection and in the reporting stage.
Conflicts of interest
The authors declare no conflicts of interest.
Acknowledgements
This work was funded by an Australian Research Council (ARC) Linkage Project: Optimised field delineation of contaminated soils, LP150100566. The authors would like to thank the editor Professor M. B. Kirkham, the reviewers, and copy editors who took the time to review this manuscript, providing insightful and helpful feedback.
References
Andronikov S, Davidson D, Spiers R (2000 ) Variability in contamination by heavy metals: sampling implications. Water, Air, and Soil Pollution 120, 29–45.| Variability in contamination by heavy metals: sampling implications.Crossref | GoogleScholarGoogle Scholar |
Assadian NW, Esparza LC, Fenn LB, Ali AS, Miyamoto S, Figueroa UV, Warrick AW (1998 ) Spatial variability of heavy metals in irrigated alfalfa fields in the upper Rio Grande River basin. Agricultural Water Management 36, 141–156.
| Spatial variability of heavy metals in irrigated alfalfa fields in the upper Rio Grande River basin.Crossref | GoogleScholarGoogle Scholar |
Atteia O, Dubois JP, Webster R (1994 ) Geostatistical analysis of soil contamination in the Swiss Jura. Environmental Pollution 86, 315–327.
| Geostatistical analysis of soil contamination in the Swiss Jura.Crossref | GoogleScholarGoogle Scholar | 15091623PubMed |
BC MoE (2014) Contaminated sites regulation. Available at http://www.esdat.net/Environmental%20Standards/Canada/BC/SCh4.htm [Verified 17 September 2014].
Bourennane H, Dère C, Lamy I, Cornu S, Baize D, van Oort F, King D (2006 ) Enhancing spatial estimates of metal pollutants in raw wastewater irrigated fields using a topsoil organic carbon map predicted from aerial photography. The Science of the Total Environment 361, 229–248.
| Enhancing spatial estimates of metal pollutants in raw wastewater irrigated fields using a topsoil organic carbon map predicted from aerial photography.Crossref | GoogleScholarGoogle Scholar | 15993472PubMed |
Burgos P, Madejón E, Pérez-de-Mora A, Cabrera F (2006 ) Spatial variability of the chemical characteristics of a trace-element-contaminated soil before and after remediation. Geoderma 130, 157–175.
| Spatial variability of the chemical characteristics of a trace-element-contaminated soil before and after remediation.Crossref | GoogleScholarGoogle Scholar |
Cattle JA, McBratney AB, Minasny B (2002 ) Kriging method evaluation for assessing the spatial distribution of urban soil lead contamination. Journal of Environmental Quality 31, 1576–1588.
| Kriging method evaluation for assessing the spatial distribution of urban soil lead contamination.Crossref | GoogleScholarGoogle Scholar | 12371175PubMed |
Chang YH, Scrimshaw MD, Emmerson RHC, Lester JN (1998 ) Geostatistical analysis of sampling uncertainty at the Tollesbury Managed Retreat site in Blackwater Estuary, Essex, UK: kriging and cokriging approach to minimise sampling density. The Science of the Total Environment 221, 43–57.
| Geostatistical analysis of sampling uncertainty at the Tollesbury Managed Retreat site in Blackwater Estuary, Essex, UK: kriging and cokriging approach to minimise sampling density.Crossref | GoogleScholarGoogle Scholar |
De Gruijter J, Brus D, Bierkens M, Knotters M (2006) ‘Sampling for natural resource monitoring.’ (Springer-Verlag Berlin Heidelberg: The Netherlands)
de Zorzi P, Barbizzi S, Belli M, Mufato R, Sartori G, Stocchero G (2008 ) Soil sampling strategies: evaluation of different approaches. Applied Radiation and Isotopes 66, 1691–1694.
| Soil sampling strategies: evaluation of different approaches.Crossref | GoogleScholarGoogle Scholar | 18514534PubMed |
Domburg P, de Gruijter JJ, Brus DJ (1994 ) A structured approach to designing soil survey schemes with prediction of sampling error from variograms. Geoderma 62, 151–164.
| A structured approach to designing soil survey schemes with prediction of sampling error from variograms.Crossref | GoogleScholarGoogle Scholar |
Ersoy A, Yunsel TY, Atici Ü (2008 ) Geostatistical conditional simulation for the assessment of contaminated land by abandoned heavy metal mining. Environmental Toxicology 23, 96–109.
| Geostatistical conditional simulation for the assessment of contaminated land by abandoned heavy metal mining.Crossref | GoogleScholarGoogle Scholar | 18214925PubMed |
Ferreira da Silva E, Zhang C, Serrano Pinto Ls, Patinha C, Reis P (2004 ) Hazard assessment on arsenic and lead in soils of Castromil gold mining area, Portugal. Applied Geochemistry 19, 887–898.
| Hazard assessment on arsenic and lead in soils of Castromil gold mining area, Portugal.Crossref | GoogleScholarGoogle Scholar |
Glavin RJ, Hooda PS (2005 ) A practical examination of the use of geostatistics in the remediation of a site with a complex metal contamination history. Soil and Sediment Contamination: An International Journal 14, 155–169.
| A practical examination of the use of geostatistics in the remediation of a site with a complex metal contamination history.Crossref | GoogleScholarGoogle Scholar |
Helios Rybicka E (1996 ) Impact of mining and metallurgical industries on the environment in Poland. Applied Geochemistry 11, 3–9.
| Impact of mining and metallurgical industries on the environment in Poland.Crossref | GoogleScholarGoogle Scholar |
Horta A, Malone B, Stockmann U, Minasny B, Bishop TFA, McBratney AB, Pallasser R, Pozza L (2015 ) Potential of integrated field spectroscopy and spatial analysis for enhanced assessment of soil contamination: a prospective review. Geoderma 241–242, 180–209.
| Potential of integrated field spectroscopy and spatial analysis for enhanced assessment of soil contamination: a prospective review.Crossref | GoogleScholarGoogle Scholar |
Johnson LE, Bishop TFA, Birch GF (2017 ) Modelling drivers and distribution of lead and zinc concentrations in soils of an urban catchment (Sydney estuary, Australia). The Science of the Total Environment 598, 168–178.
| Modelling drivers and distribution of lead and zinc concentrations in soils of an urban catchment (Sydney estuary, Australia).Crossref | GoogleScholarGoogle Scholar | 28441595PubMed |
Karunaratne SB, Bishop TFA, Odeh IOA, Baldock JA, Marchant BP (2014 ) Estimating change in soil organic carbon using legacy data as the baseline: issues, approaches and lessons to learn. Soil Research 52, 349–365.
| Estimating change in soil organic carbon using legacy data as the baseline: issues, approaches and lessons to learn.Crossref | GoogleScholarGoogle Scholar |
Kerry R, Oliver MA (2004 ) Average variograms to guide soil sampling. International Journal of Applied Earth Observation and Geoinformation 5, 307–325.
| Average variograms to guide soil sampling.Crossref | GoogleScholarGoogle Scholar |
Khan S, Cao Q, Zheng YM, Huang YZ, Zhu YG (2008 ) Health risks of heavy metals in contaminated soils and food crops irrigated with wastewater in Beijing, China. Environmental Pollution 152, 686–692.
| Health risks of heavy metals in contaminated soils and food crops irrigated with wastewater in Beijing, China.Crossref | GoogleScholarGoogle Scholar | 17720286PubMed |
Lacarce E, Saby NPA, Martin MP, Marchant BP, Boulonne L, Meersmans J, Jolivet C, Bispo A, Arrouays D (2012 ) Mapping soil Pb stocks and availability in mainland France combining regression trees with robust geostatistics. Geoderma 170, 359–368.
| Mapping soil Pb stocks and availability in mainland France combining regression trees with robust geostatistics.Crossref | GoogleScholarGoogle Scholar |
Lark RM (2002 ) Optimized spatial sampling of soil for estimation of the variogram by maximum likelihood. Geoderma 105, 49–80.
| Optimized spatial sampling of soil for estimation of the variogram by maximum likelihood.Crossref | GoogleScholarGoogle Scholar |
Lee CS-l, Li X, Shi W, Cheung SC-n, Thornton I (2006 ) Metal contamination in urban, suburban, and country park soils of Hong Kong: a study based on GIS and multivariate statistics. The Science of the Total Environment 356, 45–61.
| Metal contamination in urban, suburban, and country park soils of Hong Kong: a study based on GIS and multivariate statistics.Crossref | GoogleScholarGoogle Scholar |
Lin Y-P, Chang T-K, Teng T-P (2001 ) Characterization of soil lead by comparing sequential Gaussian simulation, simulated annealing simulation and kriging methods. Environmental Geology 41, 189–199.
| Characterization of soil lead by comparing sequential Gaussian simulation, simulated annealing simulation and kriging methods.Crossref | GoogleScholarGoogle Scholar |
Marchant BP, Tye AM, Rawlins BG (2011 ) The assessment of point-source and diffuse soil metal pollution using robust geostatistical methods: a case study in Swansea (Wales, UK). European Journal of Soil Science 62, 346–358.
| The assessment of point-source and diffuse soil metal pollution using robust geostatistical methods: a case study in Swansea (Wales, UK).Crossref | GoogleScholarGoogle Scholar |
Markus J, McBratney A (1996 ) An urban soil study: heavy metals in Glebe, Australia. Soil Research 34, 453–465.
| An urban soil study: heavy metals in Glebe, Australia.Crossref | GoogleScholarGoogle Scholar |
McBratney AB, Pringle MJ (1999 ) Estimating average and proportional variograms of soil properties and their potential use in precision agriculture. Precision Agriculture 1, 125–152.
| Estimating average and proportional variograms of soil properties and their potential use in precision agriculture.Crossref | GoogleScholarGoogle Scholar |
McBratney AB, Webster R (1983 ) How many observations are needed for regional estimation of soil properties? Soil Science 135, 177–183.
| How many observations are needed for regional estimation of soil properties?Crossref | GoogleScholarGoogle Scholar |
Mielke HW, Gonzales CR, Smith MK, Mielke PW (1999 ) The urban environment and children’s health: soils as an integrator of lead, zinc, and cadmium in New Orleans, Louisiana, U.S.A. Environmental Research 81, 117–129.
| The urban environment and children’s health: soils as an integrator of lead, zinc, and cadmium in New Orleans, Louisiana, U.S.A.Crossref | GoogleScholarGoogle Scholar | 10433843PubMed |
Minasny B, McBratney AB (2006 ) A conditioned Latin hypercube method for sampling in the presence of ancillary information. Computers & Geosciences 32, 1378–1388.
| A conditioned Latin hypercube method for sampling in the presence of ancillary information.Crossref | GoogleScholarGoogle Scholar |
NSW EPA [Environment Protection Authority] (2013) Regulatory Impact Statement: Proposed Contaminated Land Management Regulation 2013. Prepared by the NSW Environment Protection Authority, EPA, Sydney. Available at https://www.epa.nsw.gov.au/-/media/epa/corporate-site/resources/clm/130403risclm.pdf [verified 26 February 2019]
Pebesma EJ (2004 ) Multivariable geostatistics in S: the gstat package. Computers & Geosciences 30, 683–691.
| Multivariable geostatistics in S: the gstat package.Crossref | GoogleScholarGoogle Scholar |
Pettitt AN, McBratney AB (1993 ) Sampling designs for estimating spatial variance components. Journal of the Royal Statistical Society. Series C, Applied Statistics 42, 185–209.
| Sampling designs for estimating spatial variance components.Crossref | GoogleScholarGoogle Scholar |
R Core Team (2016) ‘R: A language and environment for statistical computing.’ (R Foundation for Statistical Computing: Vienna, Austria)
Shi G, Chen Z, Xu S, Zhang J, Wang L, Bi C, Teng J (2008 ) Potentially toxic metal contamination of urban soils and roadside dust in Shanghai, China. Environmental Pollution 156, 251–260.
| Potentially toxic metal contamination of urban soils and roadside dust in Shanghai, China.Crossref | GoogleScholarGoogle Scholar | 18703261PubMed |
Simasuwannarong B, Satapanajaru T, Khuntong S, Pengthamkeerati P (2012 ) Spatial distribution and risk assessment of As, Cd, Cu, Pb, and Zn in topsoil at Rayong Province, Thailand. Water, Air, and Soil Pollution 223, 1931–1943.
| Spatial distribution and risk assessment of As, Cd, Cu, Pb, and Zn in topsoil at Rayong Province, Thailand.Crossref | GoogleScholarGoogle Scholar |
Theocharopoulos SP, Wagner G, Sprengart J, Mohr ME, Desaules A, Muntau H, Christou M, Quevauviller P (2001 ) European soil sampling guidelines for soil pollution studies. The Science of the Total Environment 264, 51–62.
| European soil sampling guidelines for soil pollution studies.Crossref | GoogleScholarGoogle Scholar | 11213188PubMed |
Tiller K (1992 ) Urban soil contamination in Australia. Soil Research 30, 937–957.
| Urban soil contamination in Australia.Crossref | GoogleScholarGoogle Scholar |
US EPA (2002a) ‘Guidance on choosing a sampling design for environmental data collection.’ (United States Environmental Protection Agency; Washington, DC)
US EPA (2002b) ‘Guidance on choosing a sampling design for environmental data collection, EPA QA/G-5S.’( US Environmental Protection Agency, Office of Environmental Information, Washington, DC)
VROM (2000) ‘Dutch Target and Intervention Values, 2000 (the New Dutch List).’ (Ministerie van Volkshuisvesting, Ruimtelijke Ordening en Milieu (Ministry of Housing, Spatial Planning and Environment): The Netherlands)
VSN International Ltd (2013) ‘Genstat For Windows 16th Edition.’ (VSN International: Hemel Hempstead, UK)
Wei B, Yang L (2010 ) A review of heavy metal contaminations in urban soils, urban road dusts and agricultural soils from China. Microchemical Journal 94, 99–107.
| A review of heavy metal contaminations in urban soils, urban road dusts and agricultural soils from China.Crossref | GoogleScholarGoogle Scholar |
Wei C, Wang C, Yang L (2009 ) Characterizing spatial distribution and sources of heavy metals in the soils from mining-smelting activities in Shuikoushan, Hunan Province, China. Journal of Environmental Sciences (China) 21, 1230–1236.
| Characterizing spatial distribution and sources of heavy metals in the soils from mining-smelting activities in Shuikoushan, Hunan Province, China.Crossref | GoogleScholarGoogle Scholar |
Weindorf DC, Paulette L, Man T (2013 ) In-situ assessment of metal contamination via portable X-ray fluorescence spectroscopy: Zlatna, Romania. Environmental Pollution 182, 92–100.
| In-situ assessment of metal contamination via portable X-ray fluorescence spectroscopy: Zlatna, Romania.Crossref | GoogleScholarGoogle Scholar | 23906556PubMed |
Yang P, Mao R, Shao H, Gao Y (2009 ) An investigation on the distribution of eight hazardous heavy metals in the suburban farmland of China. Journal of Hazardous Materials 167, 1246–1251.
| An investigation on the distribution of eight hazardous heavy metals in the suburban farmland of China.Crossref | GoogleScholarGoogle Scholar | 19282107PubMed |
Zhao K, Liu X, Xu J, Selim HM (2010 ) Heavy metal contaminations in a soil–rice system: identification of spatial dependence in relation to soil properties of paddy fields. Journal of Hazardous Materials 181, 778–787.
| Heavy metal contaminations in a soil–rice system: identification of spatial dependence in relation to soil properties of paddy fields.Crossref | GoogleScholarGoogle Scholar | 20561748PubMed |
Zupan M, Einax J, Kraft J, Lobnik F, Hudnik V (2000 ) Chemometric characterization of soil and plant pollution: part 1: multivariate data analysis and geostatistical determination of relationship and spatial structure of inorganic contaminants in soil. Environmental Science and Pollution Research International 7, 89–96.
| Chemometric characterization of soil and plant pollution: part 1: multivariate data analysis and geostatistical determination of relationship and spatial structure of inorganic contaminants in soil.Crossref | GoogleScholarGoogle Scholar | 19009428PubMed |