

Quantifying blue carbon and nitrogen stocks in surface soils of temperate coastal wetlands
Christina H. Asanopoulos A B C , Jeff A. Baldock A B , Lynne M. Macdonald A B and Timothy R. Cavagnaro A
A The Waite Research Institute and School of Agriculture, Food and Wine, The University of Adelaide, PMB 1 Glen Osmond, SA 5064, Australia.
B CSIRO Agriculture & Food, PMB 2 Glen Osmond, SA 5064, Australia.
C Corresponding author. Email: christina.asanopoulos@csiro.au
Soil Research - https://doi.org/10.1071/SR20040
Submitted: 11 February 2020 Accepted: 22 April 2021 Published online: 25 June 2021
Journal Compilation © CSIRO 2021 Open Access CC BY-NC
Abstract
Coastal wetlands are carbon and nutrient sinks that capture large amounts of atmospheric CO2 and runoff of nutrients. ‘Blue carbon’ refers to carbon stored within resident vegetation (e.g. mangroves, tidal marshes and seagrasses) and soil of coastal wetlands. This study aimed to quantify the impact of vegetation type on soil carbon stocks (organic and inorganic) and nitrogen in the surface soils (0–10 cm) of mangroves and tidal marsh habitats within nine temperate coastal blue carbon wetlands in South Australia. Results showed differences in surface soil organic carbon stocks (18.4 Mg OC ha–1 for mangroves; 17.6 Mg OC ha–1 for tidal marshes), inorganic carbon (31.9 Mg IC ha–1 for mangroves; 35.1 Mg IC ha–1 for tidal marshes), and total nitrogen (1.8 Mg TN ha–1 for both) were not consistently driven by vegetation type. However, mangrove soils at two sites (Clinton and Port Augusta) and tidal marsh soils at one site (Torrens Island) had larger soil organic carbon (SOC) stocks. These results highlighted site-specific differences in blue carbon stocks between the vegetation types and spatial variability within sites. Further, differences in spatial distribution of SOC within sites corresponded with variations in soil bulk density (BD). Results highlighted a link between SOC and BD in blue carbon soils. Understanding the drivers of carbon and nitrogen storage across different blue carbon environments and capturing its spatial variability will help improve predictions of the contribution these ecosystems to climate change mitigation.
Keywords: blue carbon, coastal wetlands, mangroves, soil carbon, soil nitrogen, temperate wetlands, tidal marshes.
Introduction
Occurring at the interface between land and sea, vegetated coastal wetlands are dynamic ecosystems that play an important role in global carbon and nutrient cycles (Duarte et al. 2013). These ecosystems, including mangrove forests, tidal marshes and seagrass meadows, absorb significant amounts of carbon dioxide (CO2) from the atmosphere and capture nutrients leached or eroded from their adjacent environments (Chmura et al. 2003; Moseman-Valtierra et al. 2011; Sanders et al. 2014; Atwood et al. 2017). Coastal carbon (organic), termed ‘blue carbon’, is stored in the above- and below-ground biomass, sediment and soils with soils representing the largest (49−99%) long-term organic carbon (OC) storage pool in these ecosystems (Donato et al. 2011; Siikamäki et al. 2013). Organic matter deposited by in situ vegetation or entering a coastal wetland through tidal inundation/runoff becomes trapped in the vegetations extensive root systems and buried by additional sediment depositions (Bouillon et al. 2003; Saintilan et al. 2013; Sanders et al. 2014; Hayes et al. 2017). This organic matter, rich in carbon and nitrogen, is subject to slow decomposition and can accumulate in the ecosystem for long periods of time (Duarte et al. 2013; Mitra and Zaman 2014; Kelleway et al. 2016b; Howard et al. 2017).
The global stock of blue carbon was estimated to be 11.25 Peta-grams (Pg C) when carbon contained in the above- and below-ground biomass and soils to a depth of 1 m were combined (Siikamäki et al. 2013). Mangrove ecosystems have the largest reported carbon stores; they account for 6.5 Pg C of the global blue carbon stocks, followed by seagrasses (2.3 Pg C) and then tidal marshes (2 Pg C) (Duarte et al. 2013; Siikamäki et al. 2013). The distribution of mangroves is largely concentrated in tropical latitudes, while salt marshes are prevalent in temperate regions and seagrasses are globally dispersed (Twilley et al. 1992; Alongi 2002; Siikamäki et al. 2013; Feher et al. 2017). To our knowledge, global estimates for nitrogen in the blue carbon environments are not available. However, regional assessments have shown higher soil nitrogen stocks in disturbed wetlands (Breithaupt et al. 2014; Sanders et al. 2014; Saderne et al. 2020). Quantification of nitrogen stocks in wetlands is important as nitrogen availability can increase primary productivity of coastal vegetation, and promote algal growth that may increase soil organic carbon (SOC) storage in blue carbon environments (Lovelock et al. 2007; Reddy and DeLaune 2008; Sanders et al. 2014). However, high nutrient loads can also increase mineralisation of organic matter and reduce carbon stocks in these ecosystems (Sanders et al. 2014).
In some regions, inorganic carbon (IC; i.e. calcium carbonate, CaCO3) accumulates in coastal soils through the burial of calcified shells and skeletons of wetland fauna (e.g. crabs, snails, bivalves, sea stars) (Saderne et al. 2019). The production of 1 mol of CaCO3 results in the release of 0.63 mol of CO2 to the atmosphere (Macreadie et al. 2017; Saderne et al. 2019). Thus, in areas where CaCO3 production exceeds 0.63 times CaCO3 burial, the CO2 sink benefit associated with the accretion of organic carbon in blue carbon environments can be counteracted (Macreadie et al. 2017; Saderne et al. 2019). The IC content of soil in blue carbon studies is not often reported but can represent a significant proportion of stored carbon when present. Therefore, it is important to quantify IC stocks in blue carbon environments to identify areas where high IC is present as it may indicate the potential for blue carbon environments to act as a CO2 source depending on the relative rates of CaCO3 production and burial.
The accumulation and storage of carbon (SOC and IC) in blue carbon habitats is inherently linked to the characteristics of their environmental setting (Bouillon et al. 2008; Lovelock et al. 2014; Lavery et al. 2019; Ewers Lewis et al. 2020; Owers et al. 2020). For example, the temperature, precipitation patterns, geomorphology and hydrodynamics of an environment influence the structure and colonisation of the coastal vegetation, and the deposition of organic matter (Owers et al. 2016b; Ewers Lewis et al. 2020). As such, variability of SOC stocks in blue carbon environments is primarily considered to be a function of the in-situ vegetation given their significant contribution of carbon inputs to the soil (Saintilan et al. 2013). The type of above-ground vegetation may therefore provide an indication of below-ground soil carbon stocks resulting from autochthonous carbon additions (primary productivity) and allochthonous carbon capture (sediment accumulation) (Bouillon et al. 2003; Lamb et al. 2006; Ewers Lewis et al. 2020). This highlights the importance of understanding soil carbon dynamics under different types of vegetation to gain better understanding of SOC storage in the blue carbon system.
Previous studies have found SOC contents and stocks to be highly variable across different geomorphic settings. For example, Chmura et al. (2003) found that mangrove soils (0.055 ± 0.004 g OC cm–3) had significantly larger soil carbon densities than tidal marshes (0.039 ± 0.003 g OC cm–3) when compared globally. However, a large proportion of sites included by Chmura et al. (2003) were tropical mangrove sites that typically have larger primary productivity compared to sub-tropical or temperate latitudes where tidal marshes are found (Sanders et al. 2016; Feher et al. 2017). In contrast, studies in temperate regions have found average tidal marsh SOC stocks and densities were larger than in mangrove soils, but also differed within each ecosystem (Howe et al. 2009; Livesley and Andrusiak 2012; Ewers Lewis et al. 2018). Comparable studies have not been undertaken in South Australia with most Australian studies focused on blue carbon systems along the country’s north to south-eastern coastlines.
In South Australia, there are 164 km2 of mangrove and 198 km2 of tidal marsh habitats across the Gulf St Vincent and Spencer Gulf region (Foster et al. 2019). In addition to mitigating climate change, these habitats provide a suite of ecosystem services such as providing nursery habitats for commercially important finfish and feeding grounds for migratory shore birds, prevention of coastal erosion, protection of the coast during storm surges and filtering nutrients from entering coastal waters (Edyvane 1999; Baker 2015). However, there is a lack of regional-specific data for SOC stocks for coastal wetlands in SA. Focusing on adjacent tidal marsh and mangrove environments, this study aimed to quantify the impact of vegetation type on stocks of soil carbon (OC and IC) and nitrogen in the surface soils (0–10 cm) of temperate blue carbon environments in South Australia. Given the information available from previous blue carbon studies we hypothesised that: (i) South Australian mangroves will have larger carbon and nitrogen stocks than tidal marshes, driven by larger inputs from vegetation and more efficient trapping of allochthonous organic matter; and (ii) that tidal marsh environments would demonstrate higher intra-site variability than mangroves due to irregular patterns of tidal inundation and limited allochthonous sediment supply.
Materials and methods
Study site and sample collection
Nine sites along South Australia’s coastline spanning the eastern side of Gulf St Vincent and Spencer Gulf were sampled (Fig. 1a) during the (Austral) spring of 2016 and 2017 (Department of Environment and Water, permit number U26525–1). Study sites included Mutton Cove, Torrens Island, Port Gawler, Port Wakefield, Clinton, Port Broughton, Port Pirie, Port Paterson and Port Augusta, characterised according to Bourman et al. (2016) in Table 1. At all sites, vegetation was dominated by beaded samphire (Sarcocornia quinqueflora) and scrubby samphire (Tecticornia arbuscular) tidal marshes and the single mangrove species occurring in South Australia, the grey mangrove (Avicennia marina). At each site, three 35 m transects that spanned across the tidal marsh to mangroves vegetation were sampled. The transects were anchored (mid-point) at the transition between vegetation types, evidenced by mangrove seedlings (30 cm) within the tidal marsh dominant vegetation (Fig. 1b). The first mangrove core (position 5) was sampled where greater than 80% of the vegetation was defined as mangrove. All sampling points were 5 m apart, running from tidal marsh (transect positions 1–4) to the mangrove (positions 5–8), as depicted in Fig. 1b. Surface soils (0–10 cm) were sampled by intact coring (8 cm internal diameter) from each transect sampling position. Shallow sampling depths were chosen with the aim of capturing the influence of overlying vegetation rather than historical influences deeper in the profile (Yando et al. 2016; Kelleway et al. 2017b; Owers et al. 2020). Additionally, the transect sampling approach was taken to account for the tidal gradient typically observed in blue carbon environments and allowed for visualisation of the occurrences of spatial tends.

|

|
A total of 216 (108 tidal marsh and 108 mangrove forest) soils were collected across the nine sites. Following collection, intact cores were stored at <4°C for transportation before being stabilised through freezing and lyophilisation (Cuddon freeze dryer, Blenheim, New Zealand) before analysis.
Soil processing and analysis
All soil samples were weighed, dried to a constant weight (freeze-dried), crushed and sieved to ≤2 mm. A riffle box (12 × 13 mm slotted box; Civilab Australia, Sydney, Australia) was used to collect a representative sub-sample (approx. 25 g) of the ≤2 mm sample for fine grinding (Standard Ring Mill, SRM-RC-3P; Rocklabs Ltd, Auckland, New Zealand, fitted with a stainless-steel head, CARB-40-BLP). Fine ground samples were further analysed for total carbon (TC) and total nitrogen (TN) concentration (mg g–1) by high temperature dry combustion (LECO TruMac CN analyser, LECO Corporation, St. Joseph, MI, USA). Soil dry bulk density (BD) was calculated as the dry sample weight (g) of the soil divided by the original wet sample volume (cm3). To account for the >2 mm portion of the soils, a gravel correction was later applied in the stock calculation.
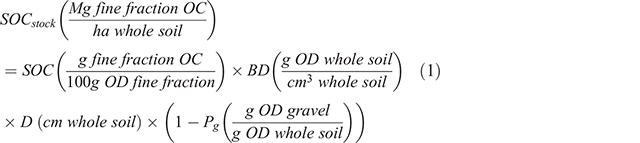
The presence of inorganic carbon (IC) in samples was determined on fine ground samples using diffuse reflectance infrared (IR) spectra collected as described in Baldock et al. (2013) using a Nicolet 6700 FTIR spectrometer (Thermo Fisher Scientific Inc., Waltham, MA, USA). Inorganic carbon has a distinct and easily observable absorption at a frequency of 2560–2480 cm–1 (Vohland et al. 2014). Samples identified to contain IC were repeatedly acidified (1 M hydrochloric acid, ~25 mL) until effervescence ceased, washed (three times) with deionised water, frozen and lyophilised. Organic carbon (OC) concentration (mg g–1) was then determined on the acidified samples by dry combustion as described above. The IC concentration (mg g–1) was calculated as the difference between TC and OC. For the soils containing no IC, their OC concentrations were equated to the measured TC. Soil OC (SOC) and TN concentrations were used to calculate carbon to nitrogen ratios (C:N) as an indicator of nitrogen limitation/enrichment. Surface stocks (Mg ha–1) of SOC, IC and TN associated with the ≤2 mm soil fraction were calculated according to Eqn 1 using SOC as an example with units associated with each term given in parentheses after the term.
Statistical analysis
The influence of vegetation (tidal marsh vs mangrove) on the measured soil properties was determined across the entire sample population (216 samples), and individually within the nine sites. A restricted maximum likelihood (REML) linear mixed model was used to determine differences in SOC, IC, TN, C:N and BD between tidal marsh and mangrove environments. Within the model, vegetation type (i.e. mangrove vs tidal marsh) was set as the fixed effect and site, vegetation type nested within site and position nested within transect then vegetation type and site were set as random terms. Homoscedasticity and normality was confirmed for all test parameters. Likelihood ratio tests were applied to the full model with effect of vegetation type included against the model without the effect in question to obtain P values. Univariate analysis was applied to the SOC, IC and TN stocks, and BD data with the linear model as described above. Three sites (Torrens Island, Mutton Cove and Port Broughton) were excluded from the analysis of IC due to the absence or low number of soil samples that contained IC. Additionally, the corresponding bivariate ANOVA with random effects of site and site by vegetation was performed for SOC and TN. REML indicated that the variance introduced by site was greater than the residual variance and could not be ignored, thus was analysed further. Therefore, the subsequent results presented are for the response of each soil property to vegetation type, across and within sites, explored with bivariate and univariate ANOVA. Statistical analysis and graphic outputs were performed using GenStat 19 (VSN International 2017) and R studio for R (RStudio Team 2016; R Core Team 2017) with packages ‘lme4’ (Bates et al. 2015); ‘ggplot2’ (Wickham 2016) and ‘grid extra’ (Auguie 2016).
Results
The surface soil BD of tidal marshes was significantly larger than that of mangroves (P = 0.05; Table 2). In contrast, surface SOC, IC, TN and C:N did not differ significantly with vegetation type. Average carbon (SOC and IC) and TN stocks, C:N and soil BD are summarised in Table 2.

|
At a site level, soil properties (SOC, IC, TN, C:N and BD) between the tidal marsh and mangrove ecosystems differed significantly with location (Fig. 2). Tidal marsh surface SOC and TN stocks, and C:N ratios at Torrens Island (33.7 ± 6.3 Mg OC ha–1; 2.7 ± 0.4 Mg TN ha–1; and C:N = 12.6 ± 0.6 for tidal marshes and 25.5 ± 4.4 Mg OC ha–1; 2.1 ± 0.3 Mg TN ha–1; and C:N = 12.1 ± 0.5 for mangroves; Fig. 2a, c) were larger than the mangrove surface soils (P < 0.001 for SOC and P < 0.05 for TN and C:N, respectively). At Port Paterson and Port Augusta, IC stocks were also larger in tidal marsh surface soils (41.3 ± 5.1 Mg IC ha–1 at Port Paterson and 18.6 ± 5.0 Mg IC ha–1 at Port Augusta) when compared to the mangroves (24.3 ± 8.6 Mg IC ha–1 at Port Paterson and 11.7 ± 6.5 Mg IC ha–1 at Port Augusta; P < 0.001 for both; Fig. 2b). The surface soil BD of the tidal marshes at Port Paterson were also larger than the mangrove soils (0.96 ± 0.06 g cm–3 vs 0.81 ± 0.10 g cm–3; P < 0.001). Tidal marsh surface soil BD was also larger than mangrove soils (0.71 ± 0.06 g cm–3 vs 0.58 ± 0.21 g cm–3; P = 0.05; Fig. 2e) at Port Pirie but mangroves had larger C:N ratios than the tidal marshes (C:N = 9.6 ± for mangroves vs C:N = 8.6 ± and for tidal marshes; P < 0.05; Fig. 2d). At Mutton Cove, the C:N ratio of the tidal marsh surface soils were larger than that of the mangrove soils (12.4 ± 0.4 for tidal marshes vs 11.3 ± 0.6 for mangroves; P < 0.001; Fig. 2d). However, the BD of the mangrove surface soils at Mutton Cove were higher than the tidal marsh soils (0.46 ± 0.07 g cm–3 vs 0.31 ± 0.07 g cm–3; P < 0.0001; Fig. 2e).

|
The surface soils of mangroves at Clinton had larger SOC and TN stocks, and C:N ratios than tidal marshes (16.9 ± 1.2 Mg OC ha–1; 1.9 ± 0.3 Mg TN ha–1; and C:N = 9.0 ± 1.5 for mangroves vs 12.5 ± 4.4 Mg OC ha–1; 1.6 ± 0.5 Mg TN ha–1; and C:N = 7.5 ± 0.9 for tidal marshes; P < 0.001 for OC and P < 0.05 for TN and C:N; Fig. 2a, c, d). However, the BD of the surface soils at Clinton were smaller for the mangrove soils than the tidal marshes (0.48 ± 0.08 g cm–3 vs 0.95 ± 0.23 g cm–3; P < 0.0001; Fig. 2e). Again at Port Augusta, mangroves had larger SOC stocks and C:N ratios than tidal marshes (9.8 ± 3.2 Mg OC ha–1 and C:N = 11.4 ± 3.5 for mangroves vs 6.5 ± 3.3 Mg OC ha–1 and C:N = 9.0 ± 1.1 for tidal marshes; P < 0.05; Fig. 2a, d). Within the other sites, there were no statistically significant differences in carbon (SOC and IC) and TN stocks, C:N and soil BD.
The spatial distribution of the surface soil carbon (OC and IC) stocks and BD were variable with sampling position within vegetation and site (Fig. 3; Table 3). Variability in OC stocks across the mangroves and tidal marsh samples ranged 7–51%. Port Gawler, Port Broughton and Port Augusta had the largest variability (greater than 25%) in OC stocks in both vegetation types. At Port Wakefield, Clinton and Port Paterson, the tidal marsh samples had larger variability in OC stocks than the mangroves. However, the OC stocks of the mangrove samples at Port Pirie had larger variability than the tidal marshes (21% vs 14%; Fig. 3a; Table 3). The variability of mangrove IC stocks was also larger than its variability in tidal marshes at Port Wakefield, Port Pirie, Port Paterson and Port Augusta (Table 3). Conversely, at Clinton, variability in the IC stocks of the tidal marsh samples was larger than the mangroves. At Port Gawler, there was above 50% variability in the IC stocks in both the mangrove and tidal marsh samples (Fig. 3b; Table 3). Variation of soil BD ranged 7–55% with larger variability across mangrove samples than tidal marshes at Port Wakefield, Port Broughton, Port Pirie and Port Paterson. The variability of soil BD in tidal marsh samples were larger than the mangrove samples at Mutton Cove, Torrens Island, Port Gawler, Clinton and Port Augusta (Fig. 3c; Table 3).

|

|
Discussion
In contrast to other studies (Chmura et al. 2003; Howe et al. 2009; Livesley and Andrusiak 2012), the average carbon densities for tidal marsh and mangrove (0.019 g OC cm–3 for both) soils did not differ across the blue carbon sites in this study. These results do not support our first hypothesis, and this is potentially a result of the temperate environment and lower primary productivity rates of mangroves in South Australia. Surface SOC stocks (17.6 Mg OC ha–1) for South Australian tidal marshes were lower than stocks (32.1 Mg OC ha–1) reported for temperate tidal marshes of Victoria (Livesley and Andrusiak 2012). The mangrove surface SOC stocks (18.4 Mg OC ha–1) were, however, comparable to stocks (17.6 Mg OC ha–1) of temperate mangroves in Victoria (Livesley and Andrusiak 2012). The average SOC densities (0–10cm) were also lower than those reported across Australia’s eastern coastline for tidal marshes (0.03–0.04 g OC cm–3) but within range of the mangroves (0.01–0.04 g OC cm–3) (Saintilan et al. 2013). Additionally, the average SOC density for both the tidal marsh and mangroves (0.019 g OC cm–3 for both) were also lower than those reported globally (0.039 and 0.055 g OC cm–3, respectively) (Chmura et al. 2003). However, global estimates were derived from coastal wetlands from the Indian Ocean to the north-eastern Atlantic Ocean and so do not reflect carbon stocks from temperate coastal ecosystems. Furthermore, our data is restricted to the top 10 cm and is unrepresentative of the of the entire ecosystem SOC stocks as global estimates have done.
At the local scale, there was no consistent pattern in the surface carbon (SOC and IC) and TN stocks, C:N or soil BD across the tidal marsh and mangrove habitats. Three sites that had larger SOC stocks in the mangroves or tidal marsh soils also had larger C:N ratios within the same vegetation type. Larger C:N implies more cellulose and lignin-like material and is perhaps indicative of less processed carbon (Kelleway et al. 2017a). Torrens Island and Port Augusta occur in densely populated areas and are likely subject to high anthropogenic inputs from the surrounding area. Clinton is less populated but is in close proximity to the densely populated city of Port Wakefield. The main supply and deposition of sediment in Clinton is marine derived allochthonous material that combined with a sheltered and low energy environment would promote carbon and nitrogen accumulation (Table 1). Sanders et al. (2014) showed eutrophic wetlands had higher OC and TN accumulation rates than undisturbed sites. Therefore, larger nutrient loads, reflected in the larger TN stocks of tidal marshes and mangroves at Torrens Island and Clinton, respectively, would also increase primary productivity of the vegetation. An increase in primary productivity of the ecosystem could cause the larger SOC stocks that were observed at Torrens Island and Clinton (Sanders et al. 2014).
Previous studies have reported that in low energy tidal environments, such as our sites, mineral sediments are deposited closer to the tidal source (mangroves) (Howe et al. 2009; Livesley and Andrusiak 2012; Breithaupt et al. 2019). This reflects larger SOC contents in sediments deeper in the wetland (tidal marshes) (Howe et al. 2009). Sediment deposition in the interior of the wetland would account for larger SOC in tidal marshes at Torrens Island but is unsupported at Port Augusta and Clinton. However, unlike Torrens Island and Clinton, the tidal marshes at Port Augusta had significantly larger IC stocks than the mangroves. This is likely driven by the high production and accumulation of calcifying fauna and flora and/or amplified tidal range (4.1 m) depositing mineral sediments deeper in the wetland at Port Augusta (Table 1). The larger IC stocks in the tidal marshes at Port Paterson further supports this hypothesis with amplified tides (4.1 m) potentially causing the accumulation of sand and shells deeper in the wetland (tidal marshes). Mineral sediments (siliciclastic and carbonate) make up most of the material buried within sediments of blue carbon environments and are a likely source of the IC stocks at the sites (Saderne et al. 2019). The production of IC in the blue carbon environment can result in a release of CO2 to the atmosphere that counteracts the effects of SOC burial while dissolution of IC would add to the sink capacity (Macreadie et al. 2017). The quantification of IC stocks in blue carbon habitats could therefore be used to highlight regions that may be a potential source or larger sink than estimated from SOC stocks alone.
Changes in SOC concentration were directly correlated with soil BD. The BD of a soil is affected by differences in soil properties (e.g. texture, water content, depth, organic matter content) and processes that loosen or compact the soil (e.g. mixing, traffic, plant growth) (Heuscher et al. 2005; Turner et al. 2006; Ruehlmann and Körschens 2009). Previous assessments have found 25% of the variation in BD can be explained by the SOC contents alone, and 33% if the square root SOC content is used (Heuscher et al. 2005). In this study, surface soil BD across sites was variable (0.15–1.35 g cm–3) and had a negative exponential relationship with the variations in surface soil OC concentrations (mg g–1) (Fig. 4). Therefore, increase in soil BD over time could reflect decreases SOC stocks. To investigate the relative importance of SOC content (mg g–1), soil BD (g cm–3), and the proportion of gravel (g) to defining the SOC stocks, we performed a correlation analysis. For this dataset, the most important variable in accounting for variation in SOC stock (Mg OC ha–1) was SOC content (mg g–1) (R2 = 0.56). However, the correlation analysis also showed that soil BD (g cm–3) (R2 = 0.44) and gravel content (g) (R2 = 0.16) could also independently account for a portion of the variation in SOC stock. For tidal marshes and within some sites (Port Paterson, Port Pirie and Mutton Cove), the larger soil BD did not correspond with lower SOC stocks. This could be driven by differences in the packing density of the organic matter fraction and mineral fraction of the soils. For example, variations in the volumetric fraction of minerals in coastal soils have been shown to account for variations in soil BD (Breithaupt et al. 2017). Tidal marshes also hold a higher position in the tidal frame that could drive faster decay rates of the organic matter, due to greater oxygen exposure, that would lower soil BD. In addition, greater terrestrial sediment deposition through runoff would occur on the landward side of a wetland resulting in the accumulation of mineral rather than organic sediments.

|
The variability of the soil properties (OC, IC and BD) did not follow a consistent pattern with vegetation type and appeared to be driven by site specific differences. Additionally, spatial patterns of TN and C:N ratio were similar to that of SOC. The second hypothesis was therefore unsupported by these results as the spatial distribution of stocks was variable within both vegetation types. Significant variability in the distribution of blue carbon soil stocks have been consistently observed across different geomorphic settings, vegetation structure, soil type and soil depth (Chmura et al. 2003; Donato et al. 2011; Kauffman et al. 2011; Livesley and Andrusiak 2012; Saintilan et al. 2013; Adame et al. 2015; Kelleway et al. 2016a; Owers et al. 2016a; Hayes et al. 2017; Ewers Lewis et al. 2018; Owers et al. 2020). The only difference between our vegetation types within each of our study sites was at the broad scale; i.e. mangrove vs tidal marsh and soils were only sampled to the top 10 cm. Therefore, it is probable that geomorphic setting and soil type are the main drivers of the spatial variability in SOC and IC stocks found within our sites. These results indicate future sampling strategies of blue carbon habitats need to consider the variability of carbon stocks in an ecosystem for accurate stock estimates.
Most of the variation in SOC contents between mangroves and tidal marshes are likely due to differences in sediment supply and the tidal inundation patterns of a region (Chmura et al. 2003; Howe et al. 2009; Saintilan et al. 2013). Short-term SOC accumulation rates in South Australia have been estimated to range 4.3–94.1 g OC m–2 year–1 in tidal marsh systems and 9.3–97.1 g OC m–2 year–1 in mangroves (Lavery et al. 2019). The mean accumulation rates for tidal marshes and mangroves is estimated at 31.1 g OC m–2 year–1 and 38.8 g OC m–2 year–1, respectively (Lavery et al. 2019). These results suggest South Australian mangroves should have higher SOC stocks than tidal marshes. However, these values are only representative of a few locations and may not account for the variability in SOC stocks as highlighted across our study sites.
Conclusion
Despite their potential to mitigate climate change, coastal wetlands are being degraded and lost as a direct result of anthropogenic activity (EPA 2021). Blue carbon habitats have been suggested as long-term sinks for carbon and nutrients due to their high sediment accumulation rates and slow decomposition of organic matter. Yet, the drivers of carbon accretion and patterns of carbon storage in the blue carbon environment remain uncertain. This study showed that surface soils in tidal marsh and mangrove ecosystems have comparable surface SOC stocks, indicating that vegetation type has little impact on surface SOC stocks for regional assessments (i.e. state-wide) in South Australia. Within smaller spatial scales, however, there can be variability in surface SOC stocks within, and among, sites. Capturing the spatial variability of SOC stocks in the blue carbon environment will be important in improving future estimates of the contribution these habitats have in mitigating climate change.
Conflicts of interest
The authors declare no conflicts of interest.
Declaration of funding
This work was supported by The University of Adelaide Research Training Program Scholarship and The Goyder Institute for Water Research [CA-16–04].
Acknowledgements
Dr Oleana Kravchuk from the biometry hub at The University of Adelaide and Dr Dan Pagendam from Data61, CSIRO are acknowledged for assistance and advice with statistical analysis. Assistance in field work and soil sample collection from Nick Asanopoulos, Dr Nina Welti, Thi Thanh Hue Ngo, Matthias Salomon, Dr Anthelia Bond, Rebecca Stonor, Dr Jessica McKay, Stephen Lang, Dr Olivia Cousins, A/Prof. Ronald Smernik and Dr Ashlea Doolette are acknowledged. Further thanks to Sophie Russell for helping to generate Fig. 1.
References
Adame MF, Santini NS, Tovilla C, Vazquez-Lule A, Castro L, Guevara M (2015) Carbon stocks and soil sequestration rates of tropical riverine wetlands. Biogeosciences 12, 3805–3818.| Carbon stocks and soil sequestration rates of tropical riverine wetlands.Crossref | GoogleScholarGoogle Scholar |
Alongi DM (2002) Present state and future of the world’s mangrove forests. Environmental Conservation 29, 331–349.
| Present state and future of the world’s mangrove forests.Crossref | GoogleScholarGoogle Scholar |
Atwood TB, Connolly RM, Almahasheer H, Carnell PE, Duarte CM, Ewers Lewis CJ, Irigoien X, Kelleway JJ, Lavery PS, Macreadie PI, Serrano O, Sanders CJ, Santos I, Steven ADL, Lovelock CE (2017) Global patterns in mangrove soil carbon stocks and losses. Nature Climate Change 7, 523–528.
| Global patterns in mangrove soil carbon stocks and losses.Crossref | GoogleScholarGoogle Scholar |
Auguie B (2016) gridExtra: Miscellaneous Functions for “Grid” Graphics. R package version 2.2.1. URL https://CRAN.R-project.org/package=gridExtra
Baker, JL (2015) Marine Assets of Yorke Peninsula. Volume 2 of report for Natural Resources - Northern and Yorke, South Australia. Available at https://www.naturalresources.sa.gov.au/files/sharedassets/northern_and_yorke/coast_and_marine/yp_2014_assets_-_part_2_-_marine_ecological_assets_-_section_151_-_rock_islands.pdf
Baldock JA, Sanderman J, Macdonald LM, Puccini A, Hawke B, Szarvas S, McGowan J (2013) Quantifying the allocation of soil organic carbon to biologically significant fractions. Soil Research 51, 561–576.
| Quantifying the allocation of soil organic carbon to biologically significant fractions.Crossref | GoogleScholarGoogle Scholar |
Bates D, Maechler M, Bolker B, Walker S (2015) Fitting Linear Mixed-Effects Models Using lme4. Journal of Statistical Software 67, 1–48.
| Fitting Linear Mixed-Effects Models Using lme4.Crossref | GoogleScholarGoogle Scholar |
Bouillon S, Dahdouh-Guebas F, Rao AVVS, Koedam N, Dehairs F (2003) Sources of organic carbon in mangrove sediments: variability and possible ecological implications. Hydrobiologia 495, 33–39.
| Sources of organic carbon in mangrove sediments: variability and possible ecological implications.Crossref | GoogleScholarGoogle Scholar |
Bouillon S, Borges AV, Castañeda‐Moya E, Diele K, Dittmar T, Duke NC, Kristensen E, Lee SY, Marchand C, Middelburg JJ, Rivera‐Monroy VH, Smith TJ, Twilley RR (2008) Mangrove production and carbon sinks: A revision of global budget estimates. Global Biogeochemical Cycles 22,
| Mangrove production and carbon sinks: A revision of global budget estimates.Crossref | GoogleScholarGoogle Scholar |
Bourman RP, Murray-Wallace C, Harvey N (2016) 'Coastal Landscapes of South Australia.' (University of Adelaide Press: Adelaide)
Breithaupt JL, Smoak JM, Smith TJ, Sanders CJ (2014) Temporal variability of carbon and nutrient burial, sediment accretion, and mass accumulation over the past century in a carbonate platform mangrove forest of the Florida Everglades. Journal of Geophysical Research. Biogeosciences 119, 2032–2048.
| Temporal variability of carbon and nutrient burial, sediment accretion, and mass accumulation over the past century in a carbonate platform mangrove forest of the Florida Everglades.Crossref | GoogleScholarGoogle Scholar |
Breithaupt JL, Smoak JM, Rivera-Monroy VH, Castañeda-Moya E, Moyer RP, Simard M, Sanders CJ (2017) Partitioning the relative contributions of organic matter and mineral sediment to accretion rates in carbonate platform mangrove soils. Marine Geology 390, 170–180.
| Partitioning the relative contributions of organic matter and mineral sediment to accretion rates in carbonate platform mangrove soils.Crossref | GoogleScholarGoogle Scholar |
Breithaupt JL, Smoak JM, Sanders CJ, Troxler TG (2019) Spatial Variability of Organic Carbon, CaCO3 and Nutrient Burial Rates Spanning a Mangrove Productivity Gradient in the Coastal Everglades. Ecosystems 22, 844–858.
| Spatial Variability of Organic Carbon, CaCO3 and Nutrient Burial Rates Spanning a Mangrove Productivity Gradient in the Coastal Everglades.Crossref | GoogleScholarGoogle Scholar |
Chmura GL, Anisfeld SC, Cahoon DR, Lynch JC (2003) Global carbon sequestration in tidal, saline wetland soils. Global Biogeochemical Cycles 17,
| Global carbon sequestration in tidal, saline wetland soils.Crossref | GoogleScholarGoogle Scholar |
Donato DC, Kauffman JB, Murdiyarso D, Kurnianto S, Stidham M, Kanninen M (2011) Mangroves among the most carbon-rich forests in the tropics. Nature Geoscience 4, 293–297.
| Mangroves among the most carbon-rich forests in the tropics.Crossref | GoogleScholarGoogle Scholar |
Duarte CM, Losada IJ, Hendriks IE, Mazarrasa I, Marbà N (2013) The role of coastal plant communities for climate change mitigation and adaptation. Nature Climate Change 3, 961–968.
| The role of coastal plant communities for climate change mitigation and adaptation.Crossref | GoogleScholarGoogle Scholar |
Edyvane KS (1999) Coastal and marine wetlands in Gulf St. Vincent, South Australia: understanding their loss and degradation Wetlands Ecology and Management 7, 83–104.
| Coastal and marine wetlands in Gulf St. Vincent, South Australia: understanding their loss and degradationCrossref | GoogleScholarGoogle Scholar |
EPA (2021) Investigation into dieback of St Kilda mangroves. Available at https://www.epa.sa.gov.au/articles/2020/12/18/investigation_into_dieback_of_st_kilda_mangroves
Ewers Lewis CJ, Carnell PE, Sanderman J, Baldock JA, Macreadie PI (2018) Variability and Vulnerability of Coastal ‘Blue Carbon’ Stocks: A Case Study from Southeast Australia. Ecosystems 21, 263–279.
| Variability and Vulnerability of Coastal ‘Blue Carbon’ Stocks: A Case Study from Southeast Australia.Crossref | GoogleScholarGoogle Scholar |
Ewers Lewis CJ, Young MA, Ierodiaconou D, Baldock JA, Hawke B, Sanderman J, Carnell PE, Macreadie PI (2020) Drivers and modelling of blue carbon stock variability in sediments of southeastern Australia. Biogeosciences 17, 2041–2059.
| Drivers and modelling of blue carbon stock variability in sediments of southeastern Australia.Crossref | GoogleScholarGoogle Scholar |
Feher LC, Osland MJ, Griffith KT, Grace JB, Howard RJ, Stagg CL, Enwright NM, Krauss KW, Gabler CA, Day RH, Rogers K (2017) Linear and nonlinear effects of temperature and precipitation on ecosystem properties in tidal saline wetlands. Ecosphere 8, e01956
| Linear and nonlinear effects of temperature and precipitation on ecosystem properties in tidal saline wetlands.Crossref | GoogleScholarGoogle Scholar |
Foster N, Jones AR, Waycott M, Gillanders BM (2019) Coastal carbon opportunities: technical report on changes in the distribution of mangrove and saltmarsh across South Australia (1987–2015). Goyder Institute for Water Research Technical Report. Available at http://www.goyderinstitute.org/_r2158/media/system/attrib/file/602/Goyder_TRS-19-23%20Coastal%20C%20Task2a_technical%20report_Final.pdf
Hayes MA, Jesse A, Hawke B, Baldock J, Tabet B, Lockington D, Lovelock CE (2017) Dynamics of sediment carbon stocks across intertidal wetland habitats of Moreton Bay, Australia. Global Change Biology 23, 4222–4234.
| Dynamics of sediment carbon stocks across intertidal wetland habitats of Moreton Bay, Australia.Crossref | GoogleScholarGoogle Scholar | 28407457PubMed |
Heuscher SA, Brandt CC, Jardine PM (2005) Using Soil Physical and Chemical Properties to Estimate Bulk Density. Soil Science Society of America Journal 69, 51–56.
| Using Soil Physical and Chemical Properties to Estimate Bulk Density.Crossref | GoogleScholarGoogle Scholar |
Howard J, Sutton-Grier A, Herr D, Kleypas J, Landis E, Mcleod E, Pidgeon E, Simpson S (2017) Clarifying the role of coastal and marine systems in climate mitigation. Frontiers in Ecology and the Environment 15, 42–50.
| Clarifying the role of coastal and marine systems in climate mitigation.Crossref | GoogleScholarGoogle Scholar |
Howe AJ, Rodríguez JF, Saco PM (2009) Surface evolution and carbon sequestration in disturbed and undisturbed wetland soils of the Hunter estuary, southeast Australia. Estuarine, Coastal and Shelf Science 84, 75–83.
| Surface evolution and carbon sequestration in disturbed and undisturbed wetland soils of the Hunter estuary, southeast Australia.Crossref | GoogleScholarGoogle Scholar |
International VSN (2017) ‘Genstat for Windows 19th Edition.’ Hemel Hempstead, UK.)
Kauffman JB, Heider C, Cole TG, Dwire KA, Donato DC (2011) Ecosystem Carbon Stocks of Micronesian Mangrove Forests. Wetlands 31, 343–352.
| Ecosystem Carbon Stocks of Micronesian Mangrove Forests.Crossref | GoogleScholarGoogle Scholar |
Kelleway JJ, Saintilan N, Macreadie PI, Ralph PJ (2016a) Sedimentary Factors are Key Predictors of Carbon Storage in SE Australian Saltmarshes. Ecosystems 19, 865–880.
| Sedimentary Factors are Key Predictors of Carbon Storage in SE Australian Saltmarshes.Crossref | GoogleScholarGoogle Scholar |
Kelleway JJ, Saintilan N, Macreadie PI, Skilbeck CG, Zawadzki A, Ralph PJ (2016b) Seventy years of continuous encroachment substantially increases ‘blue carbon’ capacity as mangroves replace intertidal salt marshes. Global Change Biology 22, 1097–1109.
| Seventy years of continuous encroachment substantially increases ‘blue carbon’ capacity as mangroves replace intertidal salt marshes.Crossref | GoogleScholarGoogle Scholar | 26670941PubMed |
Kelleway JJ, Saintilan N, Macreadie PI, Baldock JA, Ralph PJ (2017a) Sediment and carbon deposition vary among vegetation assemblages in a coastal salt marsh. Biogeosciences 14, 3763–3779.
| Sediment and carbon deposition vary among vegetation assemblages in a coastal salt marsh.Crossref | GoogleScholarGoogle Scholar |
Kelleway JJ, Saintilan N, Macreadie PI, Baldock JA, Heijnis H, Zawadzki A, Gadd P, Jacobsen G, Ralph PJ (2017b) Geochemical analyses reveal the importance of environmental history for blue carbon sequestration. Journal of Geophysical Research. Biogeosciences 122, 1789–1805.
| Geochemical analyses reveal the importance of environmental history for blue carbon sequestration.Crossref | GoogleScholarGoogle Scholar |
Lamb AL, Wilson GP, Leng MJ (2006) A review of coastal palaeoclimate and relative sea-level reconstructions using δ13C and C/N ratios in organic material. Earth-Science Reviews 75, 29–57.
| A review of coastal palaeoclimate and relative sea-level reconstructions using δ13C and C/N ratios in organic material.Crossref | GoogleScholarGoogle Scholar |
Lavery PS, Lafratta A, Serrano O, Masqué P, Jones A, Fernandes M, Gaylard S, Gillanders B (2019) Coastal carbon opportunities: technical report on carbon storage and accumulation rates at three case study sites. Goyder Institute for Water Research Technical Report Series No. 19/21. Available.
Livesley SJ, Andrusiak SM (2012) Temperate mangrove and salt marsh sediments are a small methane and nitrous oxide source but important carbon store. Estuarine, Coastal and Shelf Science 97, 19–27.
| Temperate mangrove and salt marsh sediments are a small methane and nitrous oxide source but important carbon store.Crossref | GoogleScholarGoogle Scholar |
Lovelock CE, Feller IC, Ellis J, Schwarz AM, Hancock N, Nichols P, Sorrell B (2007) Mangrove growth in New Zealand estuaries: the role of nutrient enrichment at sites with contrasting rates of sedimentation. Oecologia 153, 633–641.
| Mangrove growth in New Zealand estuaries: the role of nutrient enrichment at sites with contrasting rates of sedimentation.Crossref | GoogleScholarGoogle Scholar | 17492316PubMed |
Lovelock CE, Adame MF, Bennion V, Hayes M, O’Mara J, Reef R, Santini NS (2014) Contemporary Rates of Carbon Sequestration Through Vertical Accretion of Sediments in Mangrove Forests and Saltmarshes of South East Queensland, Australia. Estuaries and Coasts 37, 763–771.
| Contemporary Rates of Carbon Sequestration Through Vertical Accretion of Sediments in Mangrove Forests and Saltmarshes of South East Queensland, Australia.Crossref | GoogleScholarGoogle Scholar |
Macreadie PI, Serrano O, Maher DT, Duarte CM, Beardall J (2017) Addressing calcium carbonate cycling in blue carbon accounting. Limnology and Oceanography Letters 2, 195–201.
| Addressing calcium carbonate cycling in blue carbon accounting.Crossref | GoogleScholarGoogle Scholar |
Mitra A, Zaman S (2014) ‘Carbon Sequestration by Coastal Floral Community.’ (TERI: New Delhi)
Moseman-Valtierra S, Gonzalez R, Kroeger KD, Tang J, Chao WC, Crusius J, Bratton J, Green A, Shelton J (2011) Short-term nitrogen additions can shift a coastal wetland from a sink to a source of N2O. Atmospheric Environment 45, 4390–4397.
| Short-term nitrogen additions can shift a coastal wetland from a sink to a source of N2O.Crossref | GoogleScholarGoogle Scholar |
Owers CJ, Rogers K, Mazumder D, Woodroffe CD (2016a) Spatial Variation in Carbon Storage: A Case Study for Currambene Creek, NSW, Australia. Journal of Coastal Research 75, 1297–1301.
| Spatial Variation in Carbon Storage: A Case Study for Currambene Creek, NSW, Australia.Crossref | GoogleScholarGoogle Scholar |
Owers CJ, Rogers K, Woodroffe CD (2016b) Identifying spatial variability and complexity in wetland vegetation using an object-based approach. International Journal of Remote Sensing 37, 4296–4316.
| Identifying spatial variability and complexity in wetland vegetation using an object-based approach.Crossref | GoogleScholarGoogle Scholar |
Owers CJ, Rogers K, Mazumder D, Woodroffe CD (2020) Temperate coastal wetland near-surface carbon storage: Spatial patterns and variability. Estuarine, Coastal and Shelf Science 235, 106584
| Temperate coastal wetland near-surface carbon storage: Spatial patterns and variability.Crossref | GoogleScholarGoogle Scholar |
R Core Team (2017) ‘R: A language and environment for statistical computing. R Foundation for Statistical Computing, Vienna, Austria. URL https://www.R-project.org/
Reddy KR, DeLaune RD (2008) ‘Biogeochemistry of Wetlands: Science and Applications’ (CRC Press: Boca Raton)
RStudio Team (2016) ‘RStudio: Integrated Development for R. RStudio, Inc., Boston, MA URL http://www.rstudio.com/
Ruehlmann J, Körschens M (2009) Calculating the Effect of Soil Organic Matter Concentration on Soil Bulk Density. Soil Science Society of America Journal 73, 876–885.
| Calculating the Effect of Soil Organic Matter Concentration on Soil Bulk Density.Crossref | GoogleScholarGoogle Scholar |
Saderne V, Geraldi NR, Macreadie PI, Maher DT, Middelburg JJ, Serrano O, Almahasheer H, Arias-Ortiz A, Cusack M, Eyre BD, Fourqurean JW, Kennedy H, Krause-Jensen D, Kuwae T, Lavery PS, Lovelock CE, Marba N, Masqué P, Mateo MA, Mazarrasa I, McGlathery KJ, Oreska MPJ, Sanders CJ, Santos IR, Smoak JM, Tanaya T, Watanabe K, Duarte CM (2019) Role of carbonate burial in Blue Carbon budgets. Nature Communications 10, 1106
| Role of carbonate burial in Blue Carbon budgets.Crossref | GoogleScholarGoogle Scholar | 30846688PubMed |
Saderne V, Cusack M, Serrano O, Almahasheer H, Krishnakumar PK, Rabaoui L, Qurban MA, Duarte CM (2020) Role of vegetated coastal ecosystems as nitrogen and phosphorous filters and sinks in the coasts of Saudi Arabia. Environmental Research Letters 15, 034058
| Role of vegetated coastal ecosystems as nitrogen and phosphorous filters and sinks in the coasts of Saudi Arabia.Crossref | GoogleScholarGoogle Scholar |
Saintilan N, Rogers K, Mazumder D, Woodroffe C (2013) Allochthonous and autochthonous contributions to carbon accumulation and carbon store in southeastern Australian coastal wetlands. Estuarine, Coastal and Shelf Science 128, 84–92.
| Allochthonous and autochthonous contributions to carbon accumulation and carbon store in southeastern Australian coastal wetlands.Crossref | GoogleScholarGoogle Scholar |
Sanders CJ, Eyre BD, Santos IR, Machado W, Luiz-Silva W, Smoak JM, Breithaupt JL, Ketterer ME, Sanders L, Marotta H, Silva-Filho E (2014) Elevated rates of organic carbon, nitrogen, and phosphorus accumulation in a highly impacted mangrove wetland. Geophysical Research Letters 41, 2475–2480.
| Elevated rates of organic carbon, nitrogen, and phosphorus accumulation in a highly impacted mangrove wetland.Crossref | GoogleScholarGoogle Scholar |
Sanders CJ, Maher DT, Tait DR, Williams D, Holloway C, Sippo JZ, Santos IR (2016) Are global mangrove carbon stocks driven by rainfall? Journal of Geophysical Research. Biogeosciences 121, 2600–2609.
| Are global mangrove carbon stocks driven by rainfall?Crossref | GoogleScholarGoogle Scholar |
Siikamäki J, Sanchirico JN, Jardine S, McLaughlin D, Morris D (2013) Blue Carbon: Coastal Ecosystems, Their Carbon Storage, and Potential for Reducing Emissions. Environment 55, 14–29.
| Blue Carbon: Coastal Ecosystems, Their Carbon Storage, and Potential for Reducing Emissions.Crossref | GoogleScholarGoogle Scholar |
Turner ER, Milan CS, Swenson EM (2006) Recent volumetric changes in salt marsh soils. Estuarine, Coastal and Shelf Science 69, 352–359.
| Recent volumetric changes in salt marsh soils.Crossref | GoogleScholarGoogle Scholar |
Twilley RR, Chen RH, Hargis T (1992) Carbon sinks in mangroves and their implications to carbon budget of tropical coastal ecosystems. Water, Air, and Soil Pollution 64, 265–288.
| Carbon sinks in mangroves and their implications to carbon budget of tropical coastal ecosystems.Crossref | GoogleScholarGoogle Scholar |
Vohland M, Ludwig M, Sören T-B, Ludwig B (2014) Determination of Soil Properties with Visible to Near- and Mid-Infrared Spectroscopy: Effects of Spectral Variable Selection. Geoderma 223–225, 88–96.
| Determination of Soil Properties with Visible to Near- and Mid-Infrared Spectroscopy: Effects of Spectral Variable Selection.Crossref | GoogleScholarGoogle Scholar |
Wickham, H (2016) ggplot2: Elegant Graphics for Data Analysis. Springer-Verlag New York.
Yando ES, Osland MJ, Willis JM, Day RH, Krauss KW, Hester MW (2016) Salt marsh-mangrove ecotones: using structural gradients to investigate the effects of woody plant encroachment on plant–soil interactions and ecosystem carbon pools. Journal of Ecology 104, 1020–1031.
| Salt marsh-mangrove ecotones: using structural gradients to investigate the effects of woody plant encroachment on plant–soil interactions and ecosystem carbon pools.Crossref | GoogleScholarGoogle Scholar |