

Redesigning the soil Tea Bag Index methodology for school and citizen science in Australia
Wartini Ng A * , Alex B. McBratney A , Vanessa Pino A , Eugenia O’Brien A and Bendrik Baumeister B
A
B
Abstract
The Tea Bag Index (TBI) evaluates the rate of organic matter decomposition using Lipton tea bags. However, this tea bag cannot be easily found in Australia, having to be imported from Europe. The 90-day incubation period also poses problems for school and citizen science projects, such as missing tea bags and organism-induced damage.
The study aims to: (1) investigate the suitable alternative Australian tea bag brands for the decomposition studies; (2) assess the potential for reducing the incubation period; and (3) evaluate the priming effects of different substrates on decomposition rate.
The feasibility of two local Australian tea bag brands (Madame Flavour or T2) was compared to Lipton by collecting time-series data over the incubation period in pot experiments with the addition of sugar, citric acid and microplastic.
We found an alternative tea brand that can be used for TBI in Australia.
(1) Madame Flavour tea bags can be used as an alternative litter material for the TBI in Australia. (2) The incubation period potentially could be reduced to 21 days, with another sampling taken on day 4 and 14. (3) Although there is a significant difference in decomposition rate between the control and substrates addition, no significant difference in decomposition rate is found among different substrates.
The utilisation of the Madame Flavour tea bag enables the adoption of decomposition studies by a broader spectrum of citizen scientists in Australia.
Keywords: Australian tea brand, citizen science, climate change, decomposition, decomposition rate, green tea, rooibos tea, Tea Bag Index.
Introduction
Soil is one of the largest terrestrial carbon pools (2344 Gt), second only to the oceans (38,400 Gt) (Stockmann et al. 2013). Its potential as a carbon sink to mitigate climate change through the process of sequestration has been widely discussed (Stockmann et al. 2013; Minasny et al. 2017). To be able to develop strategies for mitigating the risks of climate change, gaining a better understanding of the processes that affect the global carbon budget is helpful. Litter decomposition is a vital part of the carbon cycle that determines not only the amount of carbon sequestered, but also how fast it enters back into the carbon cycle. The decomposition process is affected by various factors including climatic and edaphic conditions, litter quality and soil organism activity (Aerts 2006).
Since the litterbag technique was introduced in the 1950s for decomposition studies by Bocock and Gilbert (1957), there have been more than 1000 related studies (Prescott 2005). In a recent search using the Scopus database with the keywords ‘decomposition’, ‘litterbag’ or ‘litter decomposition’, we found that there are approximately 6800 studies to date. Earlier efforts to develop standardised global decomposition utilised cellulosic objects, such as cotton strips (Correll et al. 1997; Slocum et al. 2009). However, the decomposition of cotton strips has a weak relationship to that of plant litter as the latter comprises more complex materials. Keuskamp et al. (2013) developed a standardised test known as the Tea Bag Index (TBI) to measure litter decomposition in soil. The process involves the burial of both green and rooibos Lipton brand tea bags in soil followed by the measurement of weight loss over a 90-day period. The incubation time can be adjusted depending on the environmental condition. Sites that have high temperature and precipitation can reduce the incubation time, while sites that have low temperature and precipitation can extend its incubation period. Due to its simplicity and low cost, the TBI has become a popular ‘citizen science’ project that attracts the participation of volunteers across the globe through the Teatime 4 Science campaign (http://www.teatime4science.org/). Here, we define citizen science as participation of non-scientists in scientific research, which serves purposes of not only enlisting non-scientists to amplify scientific research but also building citizen support for, and understanding of, science.
Although there were uncertainties as to whether the tea bag would provide comparable characteristics of ‘native litter’, Duddigan et al. (2020) confirmed that the tea leaves used in the TBI study were suitably representative of plant litter. Didion et al. (2016) and MacDonald et al. (2018) found similar responses in the decomposition patterns between the tea bags and local plant litter in the Austrian Limestone Alps and peatlands across Canada, respectively, despite differences in the decomposition rates. Similarly, Trevathan-Tackett et al. (2020) also conducted a comparative study of tea bag and seagrass litter in seagrass ecosystems.
Several adaptations have also been applied to TBI studies in various ecosystems. Seelen et al. (2019) adapted the TBI method to determine decomposition in the freshwater environment while taking the leaching factor into account. Marley et al. (2019) undertook a similar study to use locally sourced tea (tlc: St Andrews, www.drinktlc.com) instead of the Lipton brand for a decomposition study in intertidal environments. Teo et al. (2020) modified the TBI by applying a physical (wire cloth) and chemical (diluted bifenthrin) barrier to prevent tea bag damage in a termite-rich ecosystem.
The TBI has been proposed as a proxy to characterise long-term global soil decomposition across biomes. The University of Sydney adopted the TBI method from 2017 under the project name ‘TeaComposition’. The project aims to not only collect and analyse urban soil conditions across primary and high school grounds, but also boost soil connectivity amongst students and teachers. Connectivity, one of the dimensions within the Soil Security concept (McBratney et al. 2014), can be defined as a connection to the soil, both on an individual and societal level. To ensure soil security for future generations, it is imperative to raise awareness about the significance of soil.
The TeaComposition project has been conducted over the past five consecutive years, involving more than 50 schools in New South Wales (NSW) and Queensland (Qld) with 110 classes participating, and each year with an increasing number of school participants. Details of the project were described in Pino et al. (2021). However, these tea bags used for the TeaComposition project are not readily available in Australian supermarkets. They are distributed by grocery shops in only a few countries in Europe (e.g. Dutchsupermarket and Dutch Expat Shop). Imports from Europe to Australia are time-consuming and expensive, and online orders are not straightforward for all citizens such as those in rural areas.
From the previous projects (Pino et al. 2021), one of the difficulties faced was the inability to locate tea bags due to problematic access, indecipherable labels and bag damage by organisms (i.e. termites, earthworms, larger mammals, birds and excessive plant root growth). Similar sample destructions had been observed in a study by Eggleton et al. (2020), where the tea leaves were completely emptied from the tea bag by macrofauna in a Bornean tropical rainforest, and the incubation time had to be reduced to 60 days. Other difficulties surround the lack of continuation due to planting time and the school year period. Typically, the tea bags were planted during spring (September–November) in Australia, and the school year runs from February to December. With the 90-day burial period, the tea bags were often collected during summer holidays and analysed in January; the results were then returned in the following school year and participating students might not have been able to check their results. The hands-on interaction was limited to only the burial and retrieval days of the experiment.
To encourage students’ critical thinking, the priming effects of various substrates were also evaluated. Priming effects can be defined as a short-term change in the decomposition of organic matter caused by the addition of new substrates to the soil. The addition of new substrate could potentially affect the interaction between the added substrate and the soil (Kuzyakov et al. 2000). Three types of substrates were introduced, namely sugar, acid and microplastics. Sugars are the most abundant organic compounds in the biosphere because they are the basic components of all polysaccharides: cellulose, hemicellulose (polyoses), starch, pectin, fructanes, and glucanes as well as of chitin (Kögel-Knabner 2002). Considering the dominance of polysaccharides in plants (50–70% of dry mass), they are the most important primary input of organic carbon in soil. Soil acidification is a natural process that can potentially lead to land degradation. Acidification occurring in soil is caused by various factors, including acidic precipitation as well as the application of acidifying fertilisers and nutrient uptake by crops and root exudates (Goulding 2016). Microplastics are defined as synthetic polymers that have a particle size smaller than 5 mm. They are emerging contaminants which can be found in both aquatic and terrestrial ecosystems (Duis and Coors 2016). We expected an increase in decomposition rate in terms of mass loss with the addition of sugar and citric acid and a negligible effect with the addition of microplastic into the soil as it should take a long time to degrade this material.
The aims of this study are to: (1) identify the most suitable Australian tea bags to be used for implementing the TBI in Australia based on similar mass loss trajectories; (2) determine the possibility of reducing burial time by collecting time-series data across the duration of the experiments; and (3) evaluate the priming effects of various substrates on decomposition rate.
Materials and methods
Tea varieties
Two local Australian tea bag brands (Madame Flavour and T2) were purchased from grocery shops in Sydney, New South Wales (NSW), Australia. For the Madame Flavour brand, the green (EAN 9341007000053) and rooibos (EAN 9341007000374) tea were used, and for the T2 brand, the green (EAN 9330462057405) and the black tea (EAN 9330462057399) were used as the T2 brand did not have the rooibos variety. Other easily sourced tea brands (e.g. Nerada, Tetley and Twinings) were also tested, and it was found that they were unsuccessful candidates for the TBI study because the mesh bags were predominantly paper which decomposed in less than 30 days incubation. Lipton teas (green EAN 8714100770542 and rooibos EAN 8722700188438) were still sourced from two grocery shops in the Netherlands as controls.
Chemical analysis
The dry tea samples were prepared in triplicates for the subsequent fractionation and analyses looking at five different carbon fractions (TAPPI 1969, 1975; Effland 1977; Ryan et al. 1990; Keuskamp et al. 2013) at Southern Cross University. The five fractions of interest were: (1) nonpolar extractives (NPE), the lipophilic extractable fraction (e.g. fat and waxes); (2) water solubles (WS), the hydrophilic extractable fraction (e.g. simple sugars and simple polar phenolics); (3) acid solubles (AS), the acid digestible fraction (e.g. cellulose and hemicellulose); (4) acid insolubles (AIS), the acid undigestible fraction (e.g. lignin); and (5) ash, the non-combustible fraction (e.g. minerals). The flow chart of the chemical analysis is included in Fig. 1.
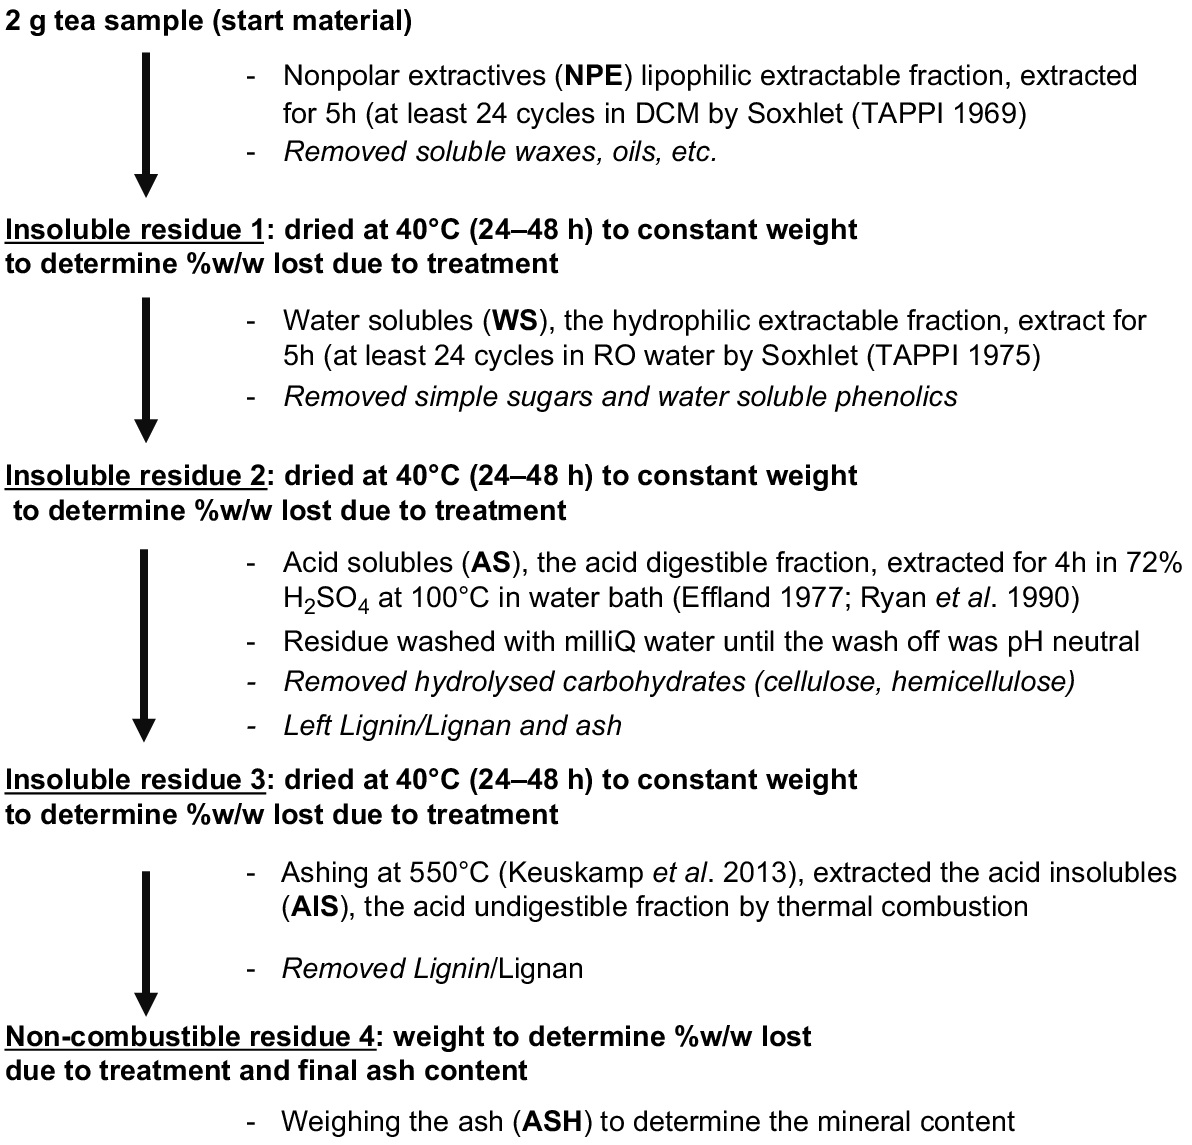
In order to sequentially fractionate the tea leaves into soluble and insoluble extracts, the samples were treated with different solvents and heat. Samples were first homogenised to an even particle size using a Waring commercial laboratory blender. Approximately 2 g of sample were accurately weighed to the nearest 0.1 mg. The NPE fraction was extracted for 5 h (at least 24 cycles) using a Soxhlet apparatus with 200 mL dichloromethane (TAPPI 1969). Then, the samples were dried at 40°C (~48 h) to constant weight to determine the %w/w lost due to the dichloromethane treatment. Afterwards, the WS fraction was extracted for 5 h (at least 24 cycles) using a Soxhlet apparatus with 200 mL of deionised water (TAPPI 1975). As per the previous step, weight loss due to water extraction was determined by drying samples at 40°C (~48 h) until no further change in weight occurred. Sulphuric acid was used to digest the acid soluble polymer sugars which account for the AS fraction. For that purpose, the dried material after water extraction was mixed with 50 mL of 72% sulphuric acid and was heated in a water bath to 100°C for 4 h (until no bubbles rose) to solubilise cellulose and hemicellulose. The remaining material (AIS and ASH fraction, mostly lignin and minerals) was vacuum filtered and washed with approximately 500 mL deionised water (until the filtrate was pH neutral) through a fritted glass crucible or glass filter paper (Effland 1977; Ryan et al. 1990). The remains after the acid digestion were dried at 40°C (~48 h) to constant weight to determine the %w/w lost due to treatment. The remaining material (e.g. lignin and ash) was heated to 550°C and the weight of the ash residue (ASH fraction) was determined gravimetrically. Finally, the %w/w content of the combustible fraction (AIS fraction, lignin and lignan) was calculated from the discrepancy between the amount of dried residue after sulphuric acid digestion and the weight of the ash fraction (AIS fraction, lignin and lignan) (Keuskamp et al. 2013). The hydrolysable fraction H is defined as the sum of NPE, WS and AS fractions, which was assumed to be rapidly decomposing in comparison to the non-hydrolysable fraction.
The summary of chemical analysis for various tea varieties is summarised in Table 1. The hydrolysable fraction (Hg) of all the green teas is relatively the same (Hg_Lipton = 0.759 ± 0.012, Hg_MadameFlavour = 0.746 ± 0.01, Hg_T2 = 0.751 ± 0.007). A similar observation is true for the rooibos tea types (Hr_Lipton = 0.673 ± 0.013, Hr_MadameFlavour = 0.699 ± 0.01, Hb_T2 = 0.678 ± 0.01). The hydrolysable fraction of Lipton tea determined in this study is slightly different than those reported in the original study (Keuskamp et al. 2013) where HG = 0.842 and HR = 0.552.
| Lipton | Madame Flavour | T2 | |||||
|---|---|---|---|---|---|---|---|
| Green | Rooibos | Green | Rooibos | Green | Black | ||
| Total tea bag weight (g) | 2.034 ± 0.11 | 2.255 ± 0.025 | 2.21 ± 0.075 | 2.243 ± 0.091 | 2.15 ± 0.046 | 2.283 ± 0.04 | |
| Empty bag weight (g) | 0.129 ± 0.003 | 0.124 ± 0.003 | 0.14 ± 0.01 | 0.14 ± 0.01 | 0.103 ± 0.006 | 0.113 ± 0.006 | |
| Nonpolar extractable fraction (g g−1) | 0.014 ± 0.001 | 0.009 ± 0.001 | 0.009 ± 0.001 | 0.079 ± 0.001 | 0.009 ± 0.001 | 0.019 ± 0.002 | |
| Water soluble fraction (g g−1) | 0.418 ± 0.013 | 0.207 ± 0.005 | 0.472 ± 0.007 | 0.324 ± 0.013 | 0.447 ± 0.007 | 0.349 ± 0.002 | |
| Acid soluble fraction (g g−1) | 0.327 ± 0.006 | 0.457 ± 0.018 | 0.264 ± 0.012 | 0.295 ± 0.017 | 0.296 ± 0.002 | 0.31 ± 0.013 | |
| Acid insoluble fraction (g g−1) | 0.238 ± 0.011 | 0.326 ± 0.014 | 0.253 ± 0.011 | 0.299 ± 0.011 | 0.249 ± 0.007 | 0.321 ± 0.01 | |
| Mineral fraction (g g−1) | 0.003 ± 0.002 | 0.001 ± 0.001 | 0.002 ± 0.001 | 0.002 ± 0.001 | 0 ± 0 | 0.001 ± 0.001 | |
| Hydrolysable fraction (H) (g g−1) | 0.759 ± 0.012 | 0.673 ± 0.013 | 0.746 ± 0.01 | 0.699 ± 0.01 | 0.751 ± 0.007 | 0.678 ± 0.01 | |
Simple pot experiments (control)
Soil samples were collected in April 2020 from a canola field from the University of Sydney farm ‘Lansdowne’ at Cobbitty, NSW, Australia (34°01′25.2″S 150°39′45.4″E). The soil was classified as red clay loam Dermosol (pH = 5.41, OC = 0.79%) according to the Australian Soil Classification System (Isbell 1996). Soil samples were taken from the upper 0–15 cm, and stored in polyurethane bags prior to being transported to a cool room and kept at 4°C. The soil was bulked to provide composite samples of the site prior to packing in the plant pots.
The tea bags were incubated in plant pots with a 10 cm diameter × 13.5 cm depth with approximately 900 g of soil and kept on a laboratory bench top. All tea bags were buried approximately 8 cm deep from the surface of the pot. The pots were then arranged in a randomised block design to account for variation in effect of light and moisture within the laboratory environment. Each pot contained only one tea bag. The tea bags were retrieved at 0, 0.5, 1, 1.5, 2, 4, 7, 10, 14, 21, 28, 35, 60, 75 and 90 days. There were three replicates of tea bags in each of the day trials (15 days × 3 brands × 2 types × 3 replicates = 270 tea bags in total).
The pot experiments were conducted in the dark at maintained room temperature of 23°C. Soil moisture was maintained weekly by adding a fixed amount of deionised water (~20 mL – ~80% water holding capacity). Upon retrieval, the adhered soil particles were removed from the tea bags. The remaining dry weight of the tea bags was determined after drying in an oven for 48 h at 70°C. The mass loss for each tea bag was then expressed in relative proportions.
The rate of organic matter decomposition was determined by using kinetic models. In particular, the use of the single pool first-order and first-order two-pools kinetic model was explored (Table 2). The single pool approach assumes that all the carbon decomposes at a particular rate, while the two-pools approach assumes that the decomposition occurs at different rates depending on carbon compositions, namely labile and more recalcitrant carbon pools. The labile component is expected to decompose at a much faster rate in comparison to those of the recalcitrant component (k1 > k2).
| Model | Equation | Reference | |
|---|---|---|---|
| First-order | Stanford and Smith (1972) | ||
| First-order two-pools | Molina et al. (1980) |
Where C is the amount of residue remaining at time t. C1 and 1 − C1 is the initial proportion of labile and recalcitrant component which decomposed by the rate constants k1 and k2, respectively.
The performance of the first-order two-pools and the simple first-order kinetic model were compared and evaluated using the root mean square error (RMSE).
The TBI index will be calculated following the method from Keuskamp et al. (2013), Mori (2022a) and Mori (2022b). Note that the measurements of the parameters on Keuskamp et al. (2013) depends on a 1 day observation (~90 days after the incubation period), while those from Mori (2022a) and Mori (2022b) depends on the time series observations.
Parameters of the TBI approach (ag_TBI, ar_TBI, kTBI and STBI) following Keuskamp et al. (2013) can be calculated as:
Where ag_TBI and ar_TBI are the labile fractions of green tea and rooibos tea, respectively, Mloss_g@90 and Mremaining_r@90 are the fraction of green tea mass lost and fraction of rooibos tea mass remaining at the end of the 90 day incubation, Hg and Hr are the hydrolysable fractions of green tea and rooibos tea, t is the incubation period, STBI is the stabilisation factor, and kTBI is the decomposition rate constant of rooibos tea.
Following Mori (2022a), the TBI parameters (ag_fitting, ar_fitting, kfitting_g, kfitting_r, Sg_fitting and Sr_fitting) can be determined by fitting the asymptote model:
Where Mg_remaining, t and Mr_remaining, t are the mass loss ratio of the remaining green and rooibos tea at t incubation period, kfitting_g and kfitting_r are the decomposition rate constant by fitting the asymptote model, (1 − ag_fitting) and (1 − ar_fitting) are the asymptotes for the nonlinear regression of green and rooibos tea, and Sg_fitting and Sr_fitting are the stabilisation factor for the green tea and rooibos tea.
Shortening incubation period
To determine the decomposition rate on a shorter incubation period, more frequent sampling is needed to capture the possible variation throughout the period. From the given 15 sampling intervals across the 90-day period, combinations of sampling intervals that had the shortest length of the incubation period were selected based on the following conditions: (1) that no more than four sampling days were utilised, and for which day zero must also be included; and (2) the combinations should be done without replacement, and the last day of incubation should not be greater than 30 days. The kinetic models selected from combination of days (n = 165) that yielded the lowest RMSE of prediction for the unselected days were chosen as the most appropriate combination.
Priming effects
In this study, three types of substrates were added into the soil, namely sugar, citric acid and microplastic. These substrates were chosen for their relevance to current environmental issues faced and could be used to raise environmental awareness.
Granulated white sugar and citric acid powder, which is commonly found in the home kitchen pantry or supermarket was used as the sugar source and citric acid respectively. Microplastic was obtained by cutting a transparent, low-density polyethylene plastic bag into small pieces and passing through a 2 mm sieve. Microplastics and sugar were introduced into the soil at concentrations of 0.1% and 1% by mass, respectively. Enough citric acid (~0.75% by mass) was added to lower the pH one unit.
The addition of substrates was applied only for Madame Flavour tea incubated in the same soil described above due to space and budget constraint. The tea bags were retrieved at 1.5, 2, 5, 21 and 60 days. There were three replicates of tea bags in each of the day trials (5 days × 2 types × 3 replicates × 3 substrates = 90 tea bags in total).
Statistical analysis
All statistical analyses were performed in R ver. 4.02 (R Core Team 2020). The kinetic models were developed using the nls function from the ‘stats’ package. To assess the priming effects of different substrates on the decomposition rate based on mass loss, data were analysed using linear regression, ANOVA, and Tukey’s post hoc test (α = 0.05) using the ‘stats’ package. The plots were created with the ‘ggplot2’ package (Wickham 2016).
Results and discussion
Mass loss for various teas
Changes in the relative mass of tea bags for the various brands are shown in Fig. 2. In general, the remaining proportion of tea leaves decreased with time. However, there was a slight plateau in the first day of incubation for the T2 green tea prior to showing a similar decomposition trend. The proportion of tea remaining, through time, also varied amongst brands because of the difference in carbon fractions. Green tea decomposed more than either rooibos or black tea because of the higher composition of hydrolysable fraction in the tea leaves, which agreed with the findings from the carbon fractions in Table 1. Based on similar mass loss trajectories, Madame Flavour tea was chosen as the suitable alternative. Although it seemed like the Madame Flavour tea was still decomposing after 90 days, these observations might not be entirely accurate. The mesh size for the tea bag is slightly larger than the other tea brands (see Supplementary Fig. S1), affecting mass loss upon sample weighing, especially after a longer period of incubation (>60 days) where the tea leaves inside the tea bags had heavily decomposed.
Relative mass remaining of various tea types (green, rooibos and black) from (a) Lipton, (b) Madame Flavour and (c) T2 modelled using first-order kinetic models (---) and two-pools first-order kinetic models (—).
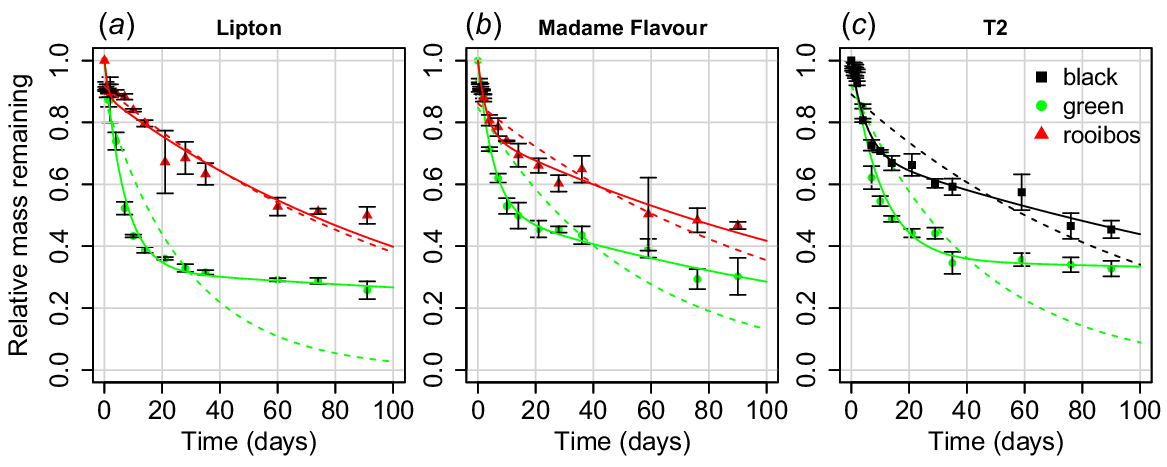
The decomposition rate constants utilised in both simple first-order and first-order two-pools kinetic models are illustrated in Fig. 2 and summarised in Table 3.
| Model | Tea types | C 1 | C 2 = (1–C 1) | k 1 | k 2 | RMSE | |
|---|---|---|---|---|---|---|---|
| First-order | Lipton green | 0.881 | – | 0.035 | – | 0.128 | |
| Lipton rooibos | 0.917 | – | 0.009 | – | 0.048 | ||
| Madame Flavour green | 0.880 | – | 0.025 | – | 0.103 | ||
| Madame Flavour rooibos | 0.872 | – | 0.010 | – | 0.051 | ||
| T2 green | 0.920 | – | 0.023 | – | 0.128 | ||
| T2 black | 0.891 | – | 0.010 | – | 0.081 | ||
| First-order two-pools | Lipton green | 0.677 | 0.323 | 0.145 | 0.002 | 0.038 | |
| Lipton rooibos | 0.113 | 0.887 | 0.990 | 0.008 | 0.044 | ||
| Madame Flavour green | 0.533 | 0.467 | 0.171 | 0.003 | 0.024 | ||
| Madame Flavour rooibos | 0.250 | 0.750 | 0.308 | 0.005 | 0.032 | ||
| T2 green | 0.645 | 0.355 | 0.097 | 0.001 | 0.046 | ||
| T2 black | 0.299 | 0.701 | 0.197 | 0.005 | 0.029 |
C1 and C2 is the initial proportions of the labile and recalcitrant carbon compositions which decomposed by the rate constants k1 and k2 respectively.
The simple first-order model underestimated the decomposition both at the beginning and end, but overestimated decomposition in between the incubation period (~2–40 days) (Fig. 2), similar to findings by Seyfried and Rao (1988). In the simple first-order kinetic model, the accuracy of all the green tea models was lower than the rooibos or black tea from the same brand (higher RMSE). Of all the tea types, green teas decomposed at a faster rate (k = 0.023–0.035) in comparison to both rooibos and black teas (k = 0.01) (Table 3). However, the decomposable carbon fractions (C1) of all the teas were slightly different. The highest proportion of the decomposable carbon (C1) fraction was found in T2 green tea (0.920), followed by Lipton rooibos tea (0.917), while the lowest proportion of decomposable carbon fraction was found in Madame Flavour rooibos tea (0.872). The results for Madame Flavour and T2 were unexpected as there should be a lower portion of decomposable carbon fractions in the green tea in comparison to the rooibos or black tea alternatives. Furthermore, the model did not fit the observation data well.
The two-pools model was superior in terms of fit in comparison to the simple first-order model (lower RMSE) across various tea types and brands (Fig. 2, Table 3). Using the first-order two-pools model, the relative composition of carbon pools for labile and recalcitrant portions within each tea type could be estimated. For green tea, both Lipton and T2 had a similar composition with approximately 0.645–0.677 of labile fraction (C1) and 0.323–0.355 of recalcitrant fraction (C2). The labile fraction (C1) of Madame Flavour green tea is slightly lower (0.533) in comparison to the other two green teas. In general, k1 (0.097–0.171) was greater than k2 (0.001–0.003) for green teas, which supported the assumption that the labile fraction decomposed faster than the recalcitrant fraction. The decomposition rate constant of the labile fraction (k1) for the Lipton green tea was slightly higher at 0.145 in comparison to the T2 green tea (0.097), but lower than that of the Madame Flavour green tea (0.171). Lipton rooibos has the smallest portion of labile fraction (C1 = 0.113) in comparison to both Madame Flavour rooibos tea (0.250) and T2 black tea (0.299), respectively. The decomposition rate of the labile portion (k1) of Lipton rooibos tea (0.990) is much higher than those of Madame Flavour rooibos tea (0.308) and T2 black tea (0.197). However, the decomposition rate of the recalcitrant portion (k2) is similar (0.005–0.008).
To be able to relate the results found from this study to other global decomposition studies, an estimation of the TBI index (Keuskamp et al. 2013; Mori 2022a, 2022b) was determined and is summarised in Table 4. There are great variations in both k and S calculated from both methods. The kTBI is much lower than that of kfitting_r, similar to findings by Mori (2022a). This is due to an overestimation of ar_TBI as discussed previously in Mori (2022a). A greater variation between STBI and Sg_fitting was also found, where Sg_fitting >> STBI. As the composition of tea leaves in each tea brand varied, the decomposition rate (k) and stabilisation factor (S) for each tea brand also differed and should not be used for comparison.
| Keuskamp’s method | |||||||||
|---|---|---|---|---|---|---|---|---|---|
| Tea brand | a g_TBI | a r_TBI | H g | H r | S TBI | k TBI | |||
| Lipton | 0.742 | 0.658 | 0.759 | 0.673 | 0.022 | 0.016 | |||
| Madame Flavour | 0.697 | 0.654 | 0.746 | 0.699 | 0.065 | 0.019 | |||
| T2 | 0.672 | 0.607A | 0.751 | 0.678A | 0.008 | 0.025 | |||
Compared to the TBI index, the decomposition rate calculated using the two-pools model was larger in values for all the tea brands. Once more tests have been conducted to observe the suitability of Madame Flavour tea under different environmental conditions, a conversion factor will be developed to relate the Madame Flavour tea brand and the Lipton tea brand to contribute to global decomposition studies.
Shortening the incubation period
The kinetics model from the selected combinations of days was compared to those utilising the whole days of the incubation period. Some illustrations of the model performance comparison are included in Fig. 3.
Illustrations of model fitting (a–p) using the first-order two-pools kinetic models with data from selected days (—) and the whole incubation period (---) for Madame Flavour tea for both green and rooibos tea.
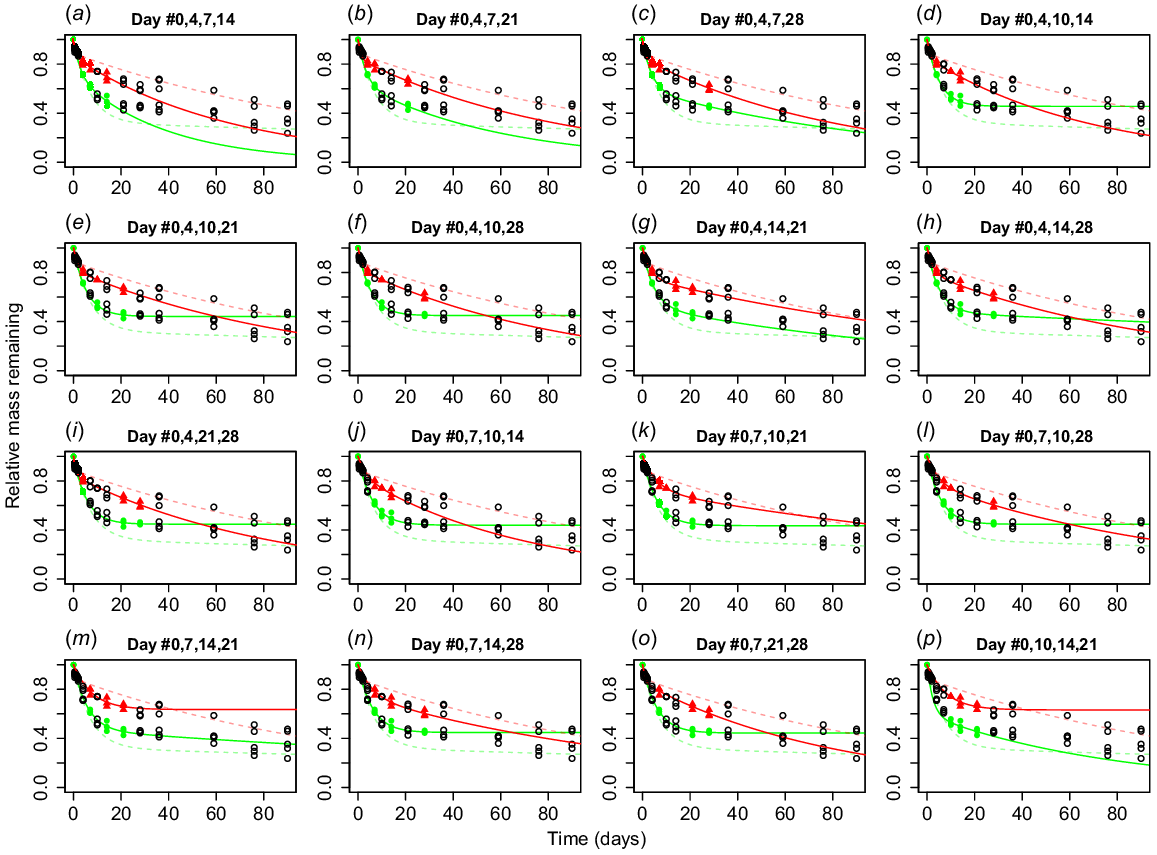
Proper selection of days was critical in developing a robust prediction model. Model fitting was not plotted for models which failed to converge. Although some of the models fitted well to the dataset upon the initial days of incubation, it either overpredicted or underpredicted the various fractions at the end of the incubation period. For example, the model seemed to underpredict and overpredict the decomposition of the rooibos tea and green tea, respectively, over the 90-day incubation period when using 0-, 4-, 10- and 28-day data only.
We found that the combination days of 0, 4, 14 and 21 yielded the lowest RMSE. The differences in the values were minimal compared to those selected from different days. This falls in line with the proposal made by Mori et al. (2022), in which time series data should be collected to determine the TBI parameters as some of the key assumptions in the approach do not always hold true when the decomposition of green tea is slow. If the environmental condition is not favourable for the tea decomposition, the unstabilised fraction of green tea might not have fully decomposed by the end of the 90-day period. Furthermore, the ratio of the stabilised to total hydrolysable fractions in rooibos tea is not equal to that in the green tea.
Mass loss and priming effects
Decomposition dynamics of the tea with added substrates (sugar, citric acid and microplastic) started within a similar range of those observed in the controlled laboratory setting, and only began to differ within 21 days of incubation (Fig. 4). The difference could be easily spotted at the 60-day incubation period.
Relative mass of (a) green and (b) rooibos tea from the Madame Flavour tea brand in laboratory incubation, with and without the addition of various substrates (i.e. addition of sugar, citric acid and microplastic). All the tea bags were incubated in the dark, covered in black low-density polyethylene plastic, and retrieved after at 1.5, 2, 5, 21 and 60 days. The control tea bags were retrieved after 0.5, 1, 1.5, 2, 4, 7, 10, 14, 21, 28, 35, 60, 75 and 90 days. Vertical lines represent standard errors of the three replicates.
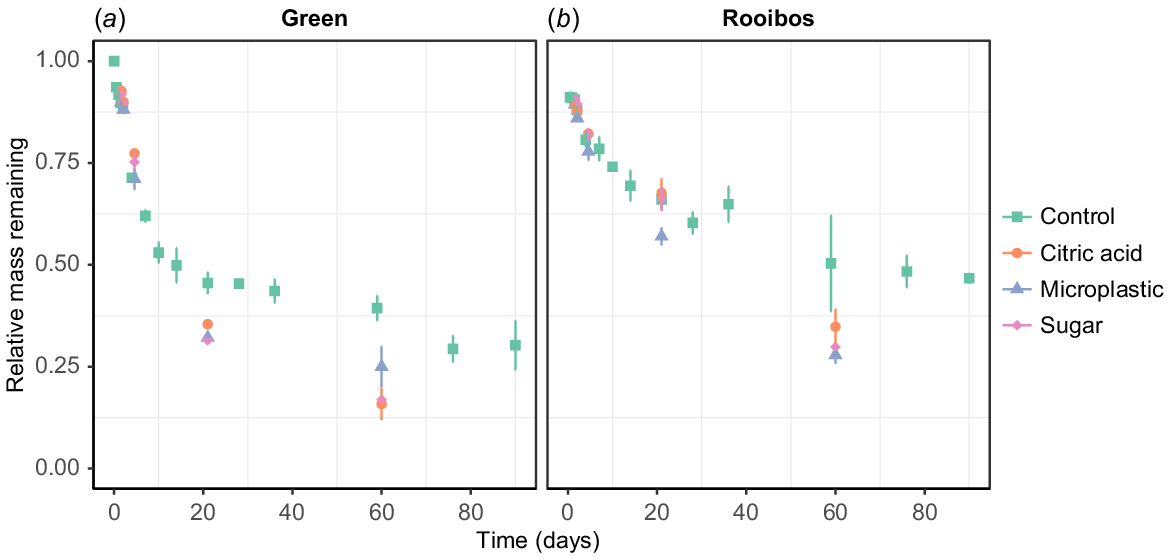
From one-way ANOVA results, statistically significant differences (P < 0.001) amongst different substrates were found for both green (d.f. = 3; F = 28.57; P = 0.000126) and rooibos tea (d.f. = 3; F = 49.66; P = 0.000438). The post hoc Tukey test was then performed to compare the effects of all the substrates. To aid in visualising the comparison amongst substrates, upper-case letters were utilised to group similar effects of substrates (group A, B and AB).
Significant differences were observed in terms of increases in the mass loss for the green tea under different substrates (group A) in comparison to the control samples (group B) after 60 days of the incubation period (Fig. 5) based on the Tukey test. However, there were no significant differences in the mass loss among the three different substrates (all group As).
Boxplots relating effects of various substrates to the rate of decomposition based on the proportion of tea mass remaining for Madame Flavour (a) green tea and (b) rooibos tea after 60 days incubation. Upper-case letters were utilised to group similar effects of substrates. A same letter denotes that there was no significant difference in priming effects of the different substrates using ANOVA and post hoc Tukey test (P < 0.05).
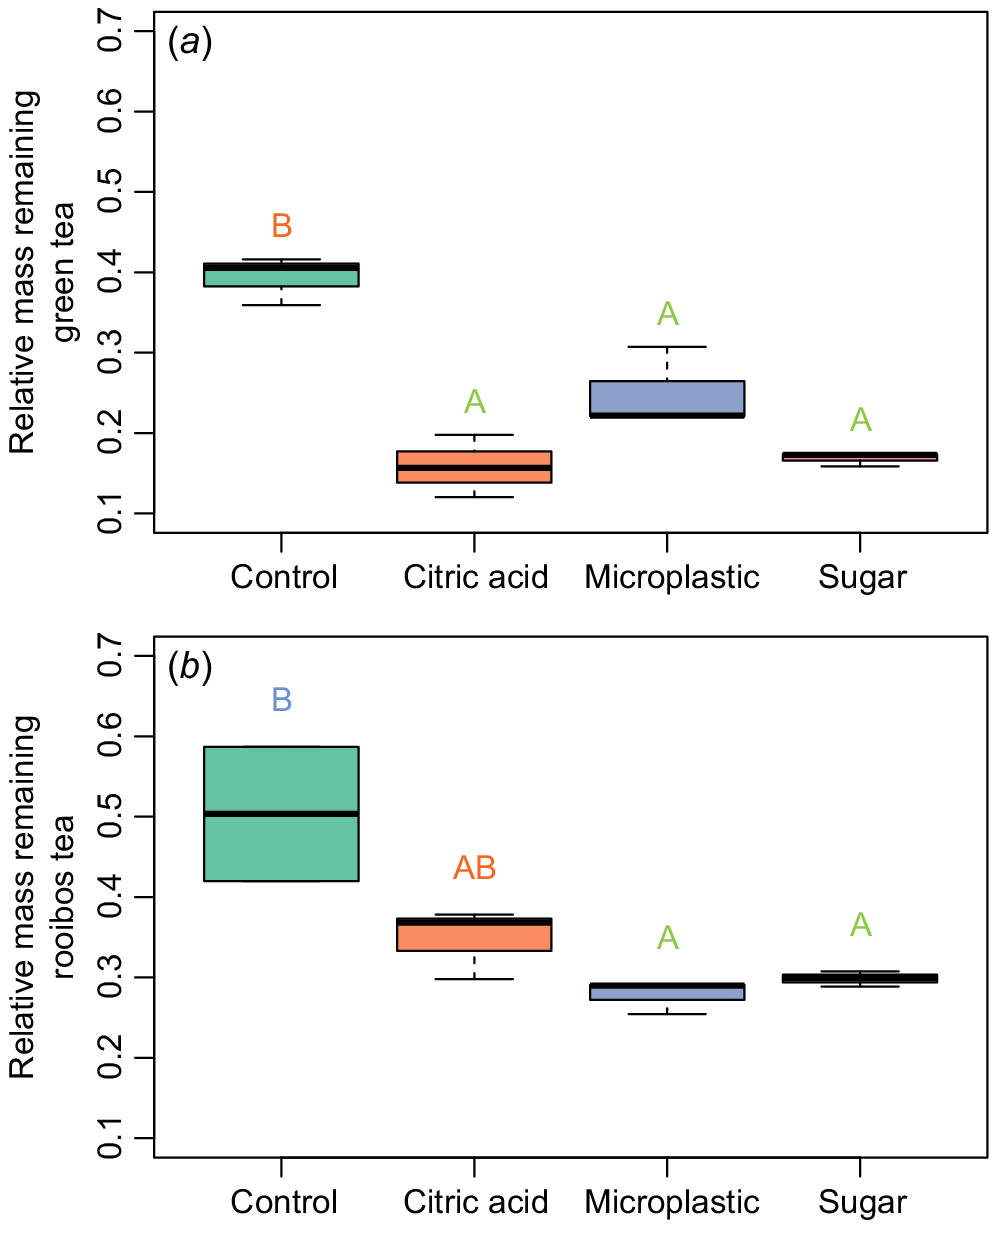
Similar observations were also found for the mass loss of the rooibos tea, where the addition of various substrates (group A and AB) increased the mass loss in comparison to the control sample (group B). The addition of sugar and plastic (group A) were found to speed up the mass loss more than the addition of citric acid (group AB) and were significantly different than the mass loss found in the control sample. The addition of citric acid showed no significant difference (group AB) to the sugar and plastic substrates (group A) or to the control (group B).
As sugar is the most important carbon and energy source for soil microorganisms, it is essential to observe the contribution of sugar in affecting the decomposition rate based on mass loss. We found that the additional sugar increased the uptake rate and the decomposition rate. This positive priming effect is due to an increase in activity of the microorganisms as the amount of easily decomposable organic substrates increases (Kuzyakov et al. 2000). The addition of microplastics altered the soil physical properties, which in turn might have affected the microbial activity (Liu et al. 2017; de Souza Machado et al. 2018) and potentially led to an increase in the mass loss compared to the control samples. Lowering pH promoted the abundance of fungi in the soil (visual observation of mould growth) which was observed during the beginning of the incubation period. The fungi availability may have led to a faster decomposition rate due to its ability to penetrate fresh litter with hyphae, for example. As the Earth is undergoing ever-changing conditions due to anthropogenic activities, it is important for humans to have a rough understanding of the profound consequences of their actions on the environment through the effects of substrates.
Citizen science application
Shortening the timeframe down to 21 days may sustain student’s interest and connection to the TeaComposition project. However, the selected days were only tested for one type of soil, and more tests on different environmental conditions have yet to be conducted to observe its versatility. Once tested for suitability, the TeaComposition project also intends to expand the target audience to include farmers and land managers. Thus, the ability of participants to use tea bags bought from local stores, may improve the number of participants in citizen science projects to have a better understanding of soil condition and microbial decomposition under different management practices. In particular, participants would be able to understand the condition of the soil, and how organic matter decomposition affects the soil function, in particular its ability to store and regulate carbon which affects how soil produces food and biomass.
Furthermore, increasing sampling frequency through the time series and addition of substrates (sugar and citric acid) promotes more hands-on activities for scientific learning outcomes. This is important, especially in younger participants, where practicing (including hands-on interaction) is preferential to talking (Kountoupes and Oberhauser 2008; Shah and Martinez 2016). Jargon and the complexity of requirements for citizen science projects should be limited, as it could potentially lead to a barrier to engagement (Tregidgo et al. 2013; Tulloch et al. 2013; Pocock et al. 2014; de Sherbinin et al. 2021). Learning gains of participants can be evaluated based on awareness and acquisition of concepts, understanding the scientific method, and increased motivation and interest in science.
Conclusions
Litter decomposition is a vital part of the global carbon cycle as it determines not only the amount of carbon sequestered but also how fast it enters the cycle. In this study, we demonstrated the use of tea leaves as a proxy for plant litter to determine the decomposition rate of organic matter in the soil.
We found a suitable alternative brand for the TBI method using a locally sourced Australian tea brand, Madame Flavour, which could be easily obtained from local supermarkets in Australia.
The incubation period can be shortened down to 21 days with the result of having several sampling intervals to promote hands-on interaction during the experiment.
The difference in the decomposition rate of the tea with and without the addition of substrate is observed after 21 days of incubation. Although no differences in decomposition rates among the substrates was observed in our case study, the inclusion of such substrates would stimulate critical thinking on possible phenomena that would affect the litter decomposition process.
A future study will investigate the redesigned method in field trials within university farms before introducing the new method to schools and citizen scientists in Australia.
Data availability
The data that support this study will be shared upon reasonable request to the corresponding author.
Acknowledgements
The TeaComposition project at the University of Sydney has been supported by an anonymous donor. The authors would like to thank the donor for their generous contribution to progressing soil science and education.
References
Aerts R (2006) The freezer defrosting: global warming and litter decomposition rates in cold biomes. Journal of Ecology 94(4), 713-724.
| Crossref | Google Scholar |
Bocock KL, Gilbert OJW (1957) The disappearance of leaf litter under different woodland conditions. Plant and Soil 9(2), 179-185.
| Crossref | Google Scholar |
Correll RL, Harch BD, Kirkby CA, O’Brien K, Pankhurst CE (1997) Statistical analysis of reduction in tensile strength of cotton strips as a measure of soil microbial activity. Journal of Microbiological Methods 31(1–2), 9-17.
| Crossref | Google Scholar |
de Sherbinin A, Bowser A, Chuang T-R, Cooper C, Danielsen F, Edmunds R, Elias P, Faustman E, Hultquist C, Mondardini R, Popescu I, Shonowo A, Sivakumar K (2021) The critical importance of citizen science data. Frontiers in Climate 3, 650760.
| Crossref | Google Scholar |
de Souza Machado AA, Lau CW, Till J, Kloas W, Lehmann A, Becker R, Rillig MC (2018) Impacts of microplastics on the soil biophysical environment. Environmental Science & Technology 52(17), 9656-9665.
| Crossref | Google Scholar | PubMed |
Didion M, Repo A, Liski J, Forsius M, Bierbaumer M, Djukic I (2016) Towards harmonizing leaf litter decomposition studies using standard tea bags – a field study and model application. Forests 7(12), 167.
| Crossref | Google Scholar |
Duddigan S, Shaw LJ, Alexander PD, Collins CD (2020) Chemical underpinning of the Tea Bag Index: an examination of the decomposition of tea leaves. Applied and Environmental Soil Science 2020, 1-8.
| Crossref | Google Scholar |
Duis K, Coors A (2016) Microplastics in the aquatic and terrestrial environment: sources (with a specific focus on personal care products), fate and effects. Environmental Sciences Europe 28(1), 2.
| Crossref | Google Scholar | PubMed |
Effland MJ (1977) Modified procedure to determine acid-insoluble lignin in wood and pulp. Tappi 60(10), 143-144.
| Google Scholar |
Eggleton P, Griffiths H, Ashton L, Law S, Evans T, Parr K (2020) Not our cup of tea: the Tea Bag Index (Kueskamp et al. 2013) for assessing decomposition is problematic in most environments, due to macrofauna. Authorea
| Crossref | Google Scholar |
Goulding KWT (2016) Soil acidification and the importance of liming agricultural soils with particular reference to the United Kingdom. Soil Use and Management 32(3), 390-399.
| Crossref | Google Scholar | PubMed |
Keuskamp JA, Dingemans BJJ, Lehtinen T, Sarneel JM, Hefting MM (2013) Tea Bag Index: a novel approach to collect uniform decomposition data across ecosystems. Methods in Ecology and Evolution 4(11), 1070-1075.
| Crossref | Google Scholar |
Kögel-Knabner I (2002) The macromolecular organic composition of plant and microbial residues as inputs to soil organic matter. Soil Biology and Biochemistry 34(2), 139-162.
| Crossref | Google Scholar |
Kountoupes DL, Oberhauser KS (2008) Citizen science and youth audiences: educational outcomes of the Monarch Larva Monitoring Project. Journal of Community Engagement and Scholarship 1(1), 10-20 10.54656/CGNR5551.
| Google Scholar |
Kuzyakov Y, Friedel JK, Stahr K (2000) Review of mechanisms and quantification of priming effects. Soil Biology and Biochemistry 32(11-12), 1485-1498.
| Crossref | Google Scholar |
Liu H, Yang X, Liu G, Liang C, Xue S, Chen H, Ritsema CJ, Geissen V (2017) Response of soil dissolved organic matter to microplastic addition in Chinese loess soil. Chemosphere 185, 907-917.
| Crossref | Google Scholar | PubMed |
MacDonald E, Brummell ME, Bieniada A, Elliott J, Engering A, Gauthier T-L, Saraswati S, Touchette S, Turmel-Courchesne L, Strack M (2018) Using the Tea Bag Index to characterize decomposition rates in restored peatlands. Boreal Environment Research 23, 221-235.
| Google Scholar |
Marley ACRG, Smeaton C, Austin WEN (2019) An assessment of the Tea Bag Index method as a proxy for organic matter decomposition in intertidal environments. Journal of Geophysical Research: Biogeosciences 124(10), 2991-3004.
| Crossref | Google Scholar |
McBratney A, Field DJ, Koch A (2014) The dimensions of soil security. Geoderma 213, 203-213.
| Crossref | Google Scholar |
Minasny B, Malone BP, McBratney AB, Angers DA, Arrouays D, Chambers A, Chaplot V, Chen Z-S, Cheng K, Das BS, Field DJ, Gimona A, Hedley CB, Hong SY, Mandal B, Marchant BP, Martin M, McConkey BG, Mulder VL, O’Rourke S, Richer-de-Forges AC, Odeh I, Padarian J, Paustian K, Pan G, Poggio L, Savin I, Stolbovoy V, Stockmann U, Sulaeman Y, Tsui C-C, Vagen T-G, van Wesemael B, Winowiecki L (2017) Soil carbon 4 per mille. Geoderma 292, 59-86.
| Crossref | Google Scholar |
Molina JAE, Clapp CE, Larson WE (1980) Potentially mineralizable nitrogen in soil: the simple exponential model does not apply for the first 12 weeks of incubation. Soil Science Society of America Journal 44(2), 442-443.
| Crossref | Google Scholar |
Mori T (2022a) Is the Tea Bag Index (TBI) useful for comparing decomposition rates among Soils? Ecologies 3(4), 521-529.
| Crossref | Google Scholar |
Mori T (2022b) Validation of the Tea Bag Index as a standard approach for assessing organic matter decomposition: a laboratory incubation experiment. Ecological Indicators 141, 109077.
| Crossref | Google Scholar |
Mori T, Nakamura R, Aoyagi R (2022) Risk of misinterpreting the Tea Bag Index: field observations and a random simulation. Ecological Research 37(3), 381-389.
| Crossref | Google Scholar |
Pino V, McBratney A, O’Brien E, Ng W (2021) Boosting soil citizen-science using Tea Bag Index method towards soil security in Australia. Soil Security 5, 100016.
| Crossref | Google Scholar |
Prescott CE (2005) Do rates of litter decomposition tell us anything we really need to know? Forest Ecology and Management 220(1–3), 66-74.
| Crossref | Google Scholar |
Ryan MG, Melillo JM, Ricca A (1990) A comparison of methods for determining proximate carbon fractions of forest litter. Canadian Journal of Forest Research 20(2), 166-171.
| Crossref | Google Scholar |
Seelen LMS, Flaim G, Keuskamp J, Teurlincx S, Arias Font R, Tolunay D, Frankova M, Sumberova K, Temponeras M, Lenhardt M, Jennings E, de Senerpont Domis LN (2019) An affordable and reliable assessment of aquatic decomposition: tailoring the Tea Bag Index to surface waters. Water Research 151, 31-43.
| Crossref | Google Scholar | PubMed |
Seyfried MS, Rao PSC (1988) Kinetics of nitrogen mineralization in Costa Rican soils: model evaluation and pretreatment effects. Plant and Soil 106(2), 159-169.
| Crossref | Google Scholar |
Shah HR, Martinez LR (2016) Current approaches in implementing citizen science in the classroom. Journal of Microbiology & Biology Education 17(1), 17-22.
| Crossref | Google Scholar |
Slocum MG, Roberts J, Mendelssohn IA (2009) Artist canvas as a new standard for the cotton-strip assay. Journal of Plant Nutrition and Soil Science 172(1), 71-74 10.1002/jpln.200800179.
| Google Scholar |
Stanford G, Smith SJ (1972) Nitrogen mineralization potentials of soils. Soil Science Society of America Journal 36(3), 465-472.
| Crossref | Google Scholar |
Stockmann U, Adams MA, Crawford JW, Field DJ, Henakaarchchi N, Jenkins M, Minasny B, McBratney AB, Courcelles VdRd, Singh K, Wheeler I, Abbott L, Angers DA, Baldock J, Bird M, Brookes PC, Chenu C, Jastrow JD, Lal R, Lehmann J, O’Donnell AG, Parton WJ, Whitehead D, Zimmermann M (2013) The knowns, known unknowns and unknowns of sequestration of soil organic carbon. Agriculture, Ecosystems & Environment 164, 80-99.
| Crossref | Google Scholar |
Teo A, Kristensen NP, Keuskamp JA, Evans TA, Foo M, Chisholm RA (2020) Validation and extension of the Tea Bag Index to collect decomposition data from termite-rich ecosystems. Pedobiologia 80, 150639.
| Crossref | Google Scholar |
Tregidgo DJ, West SE, Ashmore MR (2013) Can citizen science produce good science? Testing the OPAL Air Survey methodology, using lichens as indicators of nitrogenous pollution. Environmental Pollution 182, 448-451.
| Crossref | Google Scholar | PubMed |
Trevathan-Tackett SM, Brodersen KE, Macreadie PI (2020) Effects of elevated temperature on microbial breakdown of seagrass leaf and tea litter biomass. Biogeochemistry 151(2–3), 171-185.
| Crossref | Google Scholar |
Tulloch AIT, Possingham HP, Joseph LN, Szabo J, Martin TG (2013) Realising the full potential of citizen science monitoring programs. Biological Conservation 165, 128-138.
| Crossref | Google Scholar |