

Estimating the attainable soil organic carbon deficit in the soil fine fraction to inform feasible storage targets and de-risk carbon farming decisions
Senani Karunaratne A * , Christina Asanopoulos B , Huidong Jin C , Jeff Baldock B , Ross Searle D , Ben Macdonald A and Lynne M. Macdonald B
A
B
C
D
Abstract
Defining soil organic carbon (SOC) ‘potential’ storage, underpins the economic feasibility of carbon sequestration; however, ‘potential’ storage is not quantifiable using historical and current empirical data. We propose a framework to define ‘attainable’ SOC storage that varies with soil properties, environmental conditions and management practices.
Within the soil fine fraction, we quantified additional storage capacity of the fine fraction SOC attainable deficit (FFSOC_Attainable_Def) by the difference between attainable (FFSOC_Attainable) and actual fine fraction SOC.
Using three analyses, we developed a framework to: (1) estimate the FFSOC_Attainable_Def of the fine fraction of Australian agricultural soils within broad mean annual precipitation ranges and soil depth classes; (2) establish rapid prediction capability for the FFSOC_Attainable_Def using infrared/partial least square regression modelling; and (3) generate spatial FFSOC_Attainable_Def estimates for agricultural regions with ensemble Random Forest modelling.
Global analyses of FFSOC_Attainable_Def do not consider key environmental drivers of carbon inflows and outflows nor soil depth. Separate analyses of soils derived from different combinations of precipitation and soil depth need to include variations in environmental conditions and soil properties to accurately define FFSOC_Attainable and FFSOC_Attainable_Def within the fine fraction. Spatially estimated FFSOC_Attainable_Def stocks revealed an opportunity to increase current fine fraction SOC stock by 3.47 GT (0–0.10 m depth) and 3.24 GT (0.10–0.30 m depth).
Our findings suggests that FFSOC_Attainable_Def is dynamic, not static. Caution is needed when interpreting the results from this analysis.
Deriving estimates of FFSOC_Attainable_Def will reduce risks in decision making on carbon farming in national policies.
Keywords: attainable soil organic carbon, mid-infrared spectroscopy, mineral associated organic carbon, soil carbon storage, soil organic carbon deficit, soil organic carbon potential, soil organic carbon saturation, spatial machine learning modelling.
Introduction
The conversion of natural ecosystems into agricultural production systems, in general, has resulted in reduced soil organic carbon (SOC) stocks (Minasny et al. 2017; Sanderman et al. 2017). For example, Sanderman et al. (2017) reported the adoption of agriculture had caused a global carbon debt of 133 Pg C within the top 2 m of soil. Further, they noted that in the past 200 years of human civilisation, SOC was being lost at an alarming rate. Similar to global trends, over the past 40 years, approximately half the topsoil SOC has been lost under Australian agricultural production systems (Luo et al. 2010). Changing land management practices in an attempt to restore some of the lost SOC is therefore important for enhancing soil health and production (Lal 2016; Lehmann et al. 2020), natural capital (Robinson et al. 2017), and carbon sequestration (Lal 2004).
Increasing current SOC stocks, or reducing the loss of SOC stocks, can contribute to mitigating rising global greenhouse gas concentrations and its associated adverse effects (Lal 2004; Minasny et al. 2017). The ‘4 per mille Soils for Food Security and Climate’ initiative was launched at COP21 to increase global SOC stocks by 4 per mille (or 0.4 %) per annum (Minasny et al. 2017). A key aim of this initiative was to tackle greenhouse gas emissions caused by anthropogenic activities through the sequestration of carbon in soils. There are counter-arguments and evidence that question whether the target of the ‘4 per mille’ initiative is realistic (White et al. 2018; Berthelin et al. 2022). Nevertheless, there is potential for enhancing SOC stocks in agricultural soils by increasing the flow of carbon into the soil by reducing constraints on agricultural production and minimising carbon flows out of the soil with the adoption of next-generation land management practices. For example, the Australian Government’s domestic climate change policies have incentivised the adoption of improved land management activities that promote the sequestration of SOC in agricultural soils under Emissions Reduction Fund (ERF) activities (Paustian et al. 2019). As a result, where a soil carbon sequestration project has demonstrated a positive change in SOC stock in response to new land management activities, Australian Carbon Credit Units (ACCUs) can be issued. Such policy directions encourage the adoption of agricultural practices that increase SOC stocks and can potentially diversify the income sources and reduce the farming risk profile for landholders.
An important question faced by landholders considering entry into a carbon sequestration project is: ‘what is the quantity of SOC that can be added to soils and retained for the long-term through improved land management practices for a given land parcel/location?’ The answer to this question is not straightforward. The SOC component of soils consists of a heterogeneous mixture of organic carbon, existing at different stages of decomposition and extents of interaction with the mineral phase, both of which can influence SOC turnover time. Various analytical methods have been used to simplify the complexity of SOC composition by allocating it to different fractions that are considered to represent components with varying cycling rates based on particle size, density, and/or chemical composition (e.g. Poeplau et al. 2018). These fractionation approaches have also been used as the basis for initialising and calibrating process-based multi-pool models of SOC cycling, such as, DayCent (Dangal et al. 2022) and RothC (Skjemstad et al. 2004). Further, SOC stocks vary significantly across spatial and temporal scales, adding additional complexities (Viscarra Rossel et al. 2014; Karunaratne et al. 2015; Gray et al. 2015, 2019). An understanding of the balance between the organic carbon entering a soil from an agricultural production system and its loss through erosion or release as CO2 into the atmosphere through decomposition, and the cycling of carbon; i.e. transformation of labile carbon to more stable forms, within the soil matrix is required to identify location-specific land management strategies with a potential to increase SOC stocks.
Soil carbon sequestration projects tend to focus on increasing total SOC, but the SOC composition requires consideration due to differences in the relative rates of decomposition associated with different SOC fractions (Baldock et al. 2013a). Allocation of total SOC to component fractions can be used to characterise stabilisation mechanisms and microbial processes controlled through environmental drivers of carbon cycling (Baldock and Skjemstad 2000). The long-term stabilisation of SOC is governed by a combination of chemical composition and physical protection, resulting in distinct turnover rates (Cotrufo et al. 2019; Six et al. 2000, 2002). Conceptually, SOC fractions can be categorised based on biological stability (labile, stable, or inert), associated with varying turnover times (short, medium, or long). The labile and stable fractions of SOC assume turnover with time, following first-order kinetics, which characterises their own turnover rates.
Theoretically, SOC stocks can increase without limit provided the inputs of carbon continue to increase and losses from the soil are minimised. However, the concept of SOC stock stabilisation is an essential aspect of long-term carbon storage in soils. There are various mechanisms proposed to account for the stabilisation of carbon entering into the soil, including: (1) adsorption of SOC onto mineral surfaces (Baldock and Skjemstad 2000); (2) encapsulation of carbon within soil aggregates (Six et al. 2000); (3) adverse micro-environmental conditions that create unfavourable conditions for the soil biota, minimising decomposition; and (4) chemical composition of the SOC.
This paper focuses on quantifying and determining the extent of carbon stabilisation within the fine fraction of soil (FFSoil) that will be defined as particles ≤50 μm. Mineral surfaces provide a mechanism for stabilising organic carbon through adsorption reactions, with the capacity of the FFSoil to stabilise SOC considered finite (Baldock and Skjemstad 2000; Six et al. 2002; Stewart et al. 2007). Ingram and Fernandes (2001) proposed that three distinct stock levels: (1) actual; (2) attainable; and (3) potential, could be defined for the more stable component of SOC with a half-life >10 years. This approach can equally be adapted to the explain SOC storage in the FFSoil. The ‘actual’ SOC stock within the FFSoil represents that existing under current management practices and will be denoted by FFSOC_Actual. The attainable stock of SOC within the FFSoil, denoted by FFSOC_Attainable, represents the stock of FFSOC that would be achieved for a soil if the input of organic carbon is constrained to that associated with maximum plant productivity that can be achieved on that soil. The ‘attainable’ SOC stock may increase in response to improvements in plant genetics and agricultural management practices that result in greater plant dry matter production and enhanced flows of organic carbon to the soil. Where the FFSOC_Actual stock is lower than the FFSOC_Attainable stock, an opportunity for sequestering additional atmospheric carbon within the FFSoil exists (Baldock et al. 2019). The ‘potential’ SOC stock within the FFSoil, denoted by FFSOC_Potential, represents the maximum plausible stock of carbon that can be stored within the FFSoil when carbon inputs remain unconstrained. The FFSOC_Potential stock represents an upper limit of carbon sequestration and corresponds to the saturated condition described by Six et al. (2002) and Stewart et al. (2007). Once the FFSOC_Potential is reached, no further stabilisation of carbon by the FFSoil can occur and any additional carbon entering the soil remains within the more labile fraction. The gap between FFSOC_Potential and FFSOC_Actual has been termed the saturation deficit and interest exists as to how this soil property can be used to assess soil carbon sequestration potential (Stewart et al. 2007, 2008; Beare et al. 2014; McNally et al. 2017).
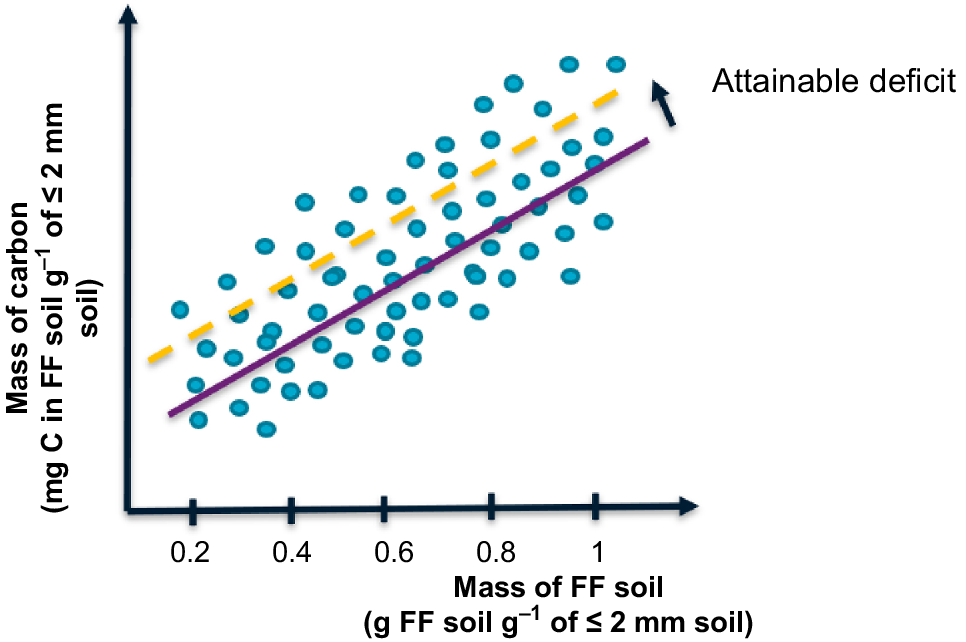
To derive estimates of the FFSOC associated with saturation (i.e. the FFSOC_Potential), research studies have often collected soils exhibiting a range of both FFSoil and FFSOC_Actual and used some form of regression to define an upper limit of FFSOC_Actual. For example, Beare et al. (2014) used a 90th quantile regression approach to define saturation and thus the value of FFSOC_Potential. However, does this approach define a value for FFSOC_Potential or is it defining an upper limit to the value of FFSOC_Actual, equivalent to FFSOC_Attainable? We hypothesise that such studies can only be used to define the value of FFSOC_Attainable given the soil properties, environmental conditions, and management practices associated with the soils included in the analysis. The value of FFSOC_Attainable may or may not be representative of FFSOC_Potential and it is likely to underestimate FFSOC_Potential. The difference between FFSOC_attainable and FFSOC_Actual should be defined as the attainable SOC deficit of the soil fine fraction (FFSOC_Attainable_Def) instead of simply as a SOC deficit. A theoretical framework explaining the concept of FFSOC_Attainable_Def is in Fig. 1.
The theoretical relationship between the gravimetric contents of the fine fraction mass (FFSoil, x-axis) and the current/actual fine fraction soil organic carbon (FFSOC_actual, y-axis). The purple line indicates the least squares regression line depicting the general relationship between soil mass and carbon loadings; the yellow dash line indicates the attainable soil organic carbon (FFSOC_Attainable) content. Attainable deficit indicates FFSOC_Attainable_Def.
Traditionally, laboratory-intensive approaches that involve particle size fractionation followed by an analysis of samples to quantify elemental SOC concentration of the component fractions, and other soil properties such as surface area, pH and Al have been used to quantify the FFSOC_Attainable (Beare et al. 2014; McNally et al. 2017). However, scaling up such laboratory-based approaches is a costly and time-consuming operation. Pioneering work led by Baldock et al. (2019) demonstrated that the use of mid infrared spectroscopy enables us to quantity of the FFSOC_Attainable directly or through the generation of the input datasets defined to estimate FFSOC_Attainable by Beare et al. (2014) and McNally et al. (2017).
Here, we developed a novel framework for rapid and cost-effective estimation of the FFSOC_Attainable_Def. Our approach combines three analytical pipelines including the following: (1) estimation of the FFSOC_Attainable_Def of the fine fraction of Australian agricultural soils within broad mean annual precipitation ranges and soil depth classes; (2) establishing a rapid prediction capability for the FFSOC_Attainable_Def based on an infrared/partial least square regression (IR/PLSR) modelling approach; and (3) generation of spatial estimates of FFSOC_Attainable_Def across the major agricultural production regions in Australia using an ensemble Random Forest modelling approach.
Materials and methods
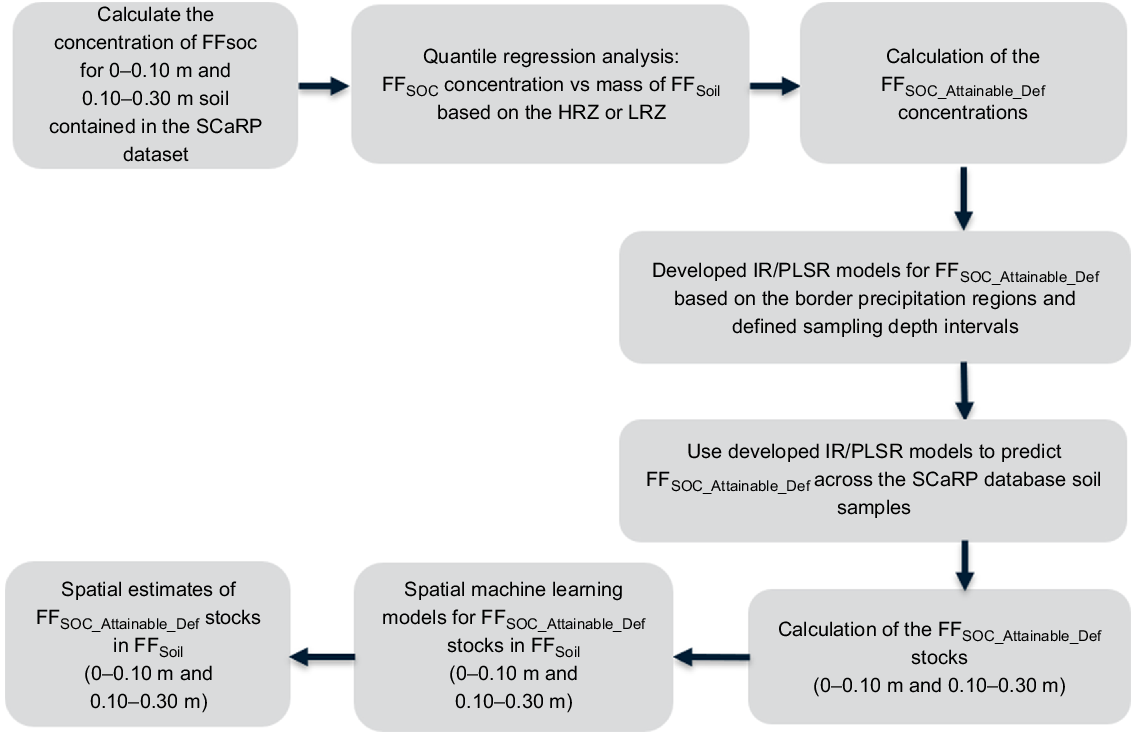
The framework for estimation, rapid and cost-effective quantification and spatial modelling of the FFSOC_Attainable and FFSOC_Attainable_Def across the major agricultural production regions in Australia is in Fig. 2.
The framework for quantification and modelling of the soil organic carbon attainable deficit (FFSOC_Attainable_Def) in agriculture production regions.
Dataset
The data used in this study were derived primarily from a national dataset collected under the Soil Carbon Research Program (SCaRP), representing 4180 farmer paddock sites across Australia’s cropping and pasture regions (Baldock et al. 2013b). The SCaRP dataset (https://doi.org/10.25919/5ddfd6888d4e5) included SOC fractionation data for 312 soils and was augmented with fractionation data derived for an additional 163 SCaRP soils, fractionated after the completion of the original SCaRP project (n = 475). The dataset included gravimetric concentrations of total organic carbon and the following three component fractions: (1) particulate organic carbon (POC) representing the SOC associated with >50 μm particles after removal of resistant organic carbon (ROC); (2) humus organic carbon (HOC) representing the SOC associated with ≤50 μm particles after removal of resistant organic carbon (ROC); and (3) ROC representing the SOC associated with >50 μm and ≤50 μm particles having a polyaromatic chemical structure. The POC fraction has a turnover time of 1–2 years, while the HOC fraction is expected to remain in soils for up to 100 years. The ROC fraction assumes a stable form of carbon, which has a turnover time of centuries to millennia.
The SOC contained within the HOC fraction was used to provide measured values for the current carbon concentration of FFSOC_Actual in each fractionated soil in units of mg FFSOC g−1 ≤2 mm soil. In addition to the data available within the published SCaRP dataset, the mass of soil fractionated and the mass of the fine fraction for each fractioned soil was obtained from archived SCaRP data files and were used to calculate the gravimetric concentration of the FFSoil in units of g FFSoil g−1 ≤2 mm soil. A detailed description of the distribution of the sampling sites, sampling design, and the procedure used to derive the total SOC, POC, HOC and ROC concentrations is described by Baldock et al. (2013a).
Quantile regression analysis and calculation of the attainable soil organic carbon deficit in the fine fraction of the soils
Initially, the FFSOC_Attainable analysis was performed as a global 90th quantile regression analysis in which soils (n = 475) collected from sites with annual precipitation values ranging from 277 mm to 1809 mm and collected from different depths (0–0.05 m; only for a few sites in New South Wales, sites; 0–0.10 m; 0.10–0.20 m; and 0.20–0.30 m) were pooled and a single model was derived. This represents the typical approach taken when calculating SOC deficit. However, after exploring the initial results, it was evident that an approach that acknowledged variations in mean annual precipitation and soil depth would be more appropriate.
The significance of separating data based on precipitation and depth prior to fitting 90th quantile regressions (Eqn 1), was tested by converting both precipitation and depth into dummy variables. The dummy variables were created based on soil depth (0–0.10 m or 0.10–0.30 m) and mean annual precipitation (≤600 mm or >600 mm) from 1991 to 2010 at the site from which the soils were collected. The 90th quantile regression model was fitted including a higher order interaction term (precipitation class × depth class), which was significant (P < 0.0001), indicating an inhomogeneity of slopes and/or of the intercepts. The inference is carried out using the ‘bootstrapped’ approach and the quantile regression modelling is performed using R package quantreg (Koenker et al. 2023). The 90th quantile regression analysis (Eqn 1) of the gravimetric content of FFSOC_Actual (mg FFSOC g−1 ≤ 2 mm soil) as a function of the gravimetric content of FFSoil (g FFSoil g−1 ≤ 2 mm soil) was applied to all soils for each depth and precipitation combination (Table 1), and the slope (β) and intercept terms were defined. The 90th quantile predicted values for FFSOC_Actual were used to define the FFSOC_Attainable for each soil, and the FFSOC_Attainable_Def of each soil was calculated as the difference between the FFSOC_Attainable and the measured FFSOC_Actual (Eqn 2).
where β and intercept refer to quantile regression analysis parameters associated.
| Model names | Number of samples (n) | Remarks | |
|---|---|---|---|
| Depth 0–0.10 m and precipitation ≤600 mm | 124 | Depth of samples between 0 and 0.10 m and low rainfall zone (LRZ) where annual cumulative rainfall is less than 600 mm | |
| Depth 0–0.10 m and precipitation >600 mm | 172 | Depth of samples between 0 and 0.10 m and high rainfall zone (HRZ) where annual cumulative rainfall is greater than 600 mm | |
| Depth 0.10–0.30 m and precipitation ≤600 mm | 72 | Depth of samples between 0.10 and 0.30 m and low rainfall zone (LRZ) where annual cumulative rainfall is less than 600 mm | |
| Depth 0.10–0.30 m and precipitation >600 mm | 107 | Depth of samples between 0.10 and 0.30 m and high rainfall zone (HRZ) where annual cumulative rainfall is greater than 600 mm |
Chemometric model development for the attainable soil organic carbon deficit
During SCaRP, infrared (IR) spectra were acquired and archived for all 475 soils and the additional 20 020 soils that SCaRP analysed (see Baldock et al. (2013c) for details about the acquisition of the IR spectra). The IR spectral datasets covered both the MIR and part of the NIR spectrum sections of the electromagnetic region. The derived FFSOC_Attainable_Def values and the concomitant IR spectra acquired for the 475 soils were used to assess the ability to generate predictive IR/PLSR algorithms to predict the FFSOC_Attainable_Def values of each soil.
The raw spectra acquired by SCaRP were pre-processed as follows: (1) reflection was converted into absorbance (absorbance = log(1/reflectance); (2) the spectra were truncated and resampled between 6000 and 600 cm−1 with a resolution of 4 cm−1; and (3) a baseline offset transformation was applied (i.e. baseline corrected). In the baseline offset transformation, the lowest absorbance value of the spectrum was subtracted from all other spectral values. Baldock et al. (2013c) built successful PLSR prediction models with MIR spectra to which only baseline correction was applied and noted that including additional pre-processing methods did not improve the resultant PLSR models. Soil samples were finely grounded prior to scanning using Fourier transform MIR spectroscopy, and minimum pre-processing of the spectra is performed in the current study.
Due to the limited number of calibration soils, instead of splitting the dataset into calibration and validation datasets, the chemometric models were developed as bootstrapped IR/PLSR models. The optimum number of factors was determined using the ‘onesigma’ approach as explained in the ‘pls’ R package through a leave-one-out-cross validation approach (Liland et al. 2022). A total of 100 bootstrapped models were developed and were validated using ‘in-the-bag’ and ‘out-of-bag’ datasets. The out-of-bag validation approach can be considered as an independent validation since the soils included were not included in the model calibration process. The models were evaluated by the root mean square error (RMSE), as a measure of the model accuracy, and Lin’s concordance correlation coefficient (LCCC) (Lawrence 1989), as a measure of how good the fit between measured and predicted values was. Model prediction quality was considered superior when RMSE and LCCC of the developed models were close to zero and one, respectively.
The developed IR/PLSR models were applied to the remaining 20 020 SCaRP MIR spectra to predict their FFSOC_Attainable_Def values. The IR/PLSR prediction uncertainty was assessed by calculating the lower (i.e. 0.05) and upper (i.e. 0.95) percentiles derived from the 100 bootstrapped model outputs for each sample.
Spatial modelling of soil carbon saturation deficit
Spatialisation of the point FFSOC_Attainable_Def concentrations was performed using the IR/PLSR predicted values for all SCaRP soils. Before spatial modelling, the FFSOC_Attainable_Def concentrations were converted into FFSOC_Attainable_Def stocks with Eqn 3.
where FFSOC_Attainable_Def stock is expressed in Mg C ha−1, FFSOC_Attainable_Def is expressed as mg C g−1 soil, bulk density is expressed as g soil cm−3, depth/thickness is expressed in cm, gravel correction factor (1 - gravel fraction), Prt correction for the proportion of the land area within the sampling unit allocated to rocks and/or trees. Measured values for bulk density, gravel correction factor and Prt were provided for each soil as part of the SCaRP dataset.
Spatialisation was then performed by an ensemble approach using a Random Forest (RF) model (Breiman 2001). Two global spatial models (i.e. 0–0.10 m and 0.10–0.30 m) were fitted with estimates generated from four different IR/PLSR model estimates associated with depth and mean annual precipitation.
A set of environmental covariates that may act as important drivers of FFSOC_Attainable_Def stock were identified for inclusion in the subsequent spatial machine learning prediction function. For a list of environmental covariates and their broad classification into the scorpan factors as described by McBratney et al. (2003), see Supplementary Table S1. Before spatial modelling, all the environmental covariates (Table S1) were re-sampled to a spatial resolution of 90 m.
A total of 4011 (for 0–0.10 m depth) and 4012 (0.10–0.30 m depth) locations with IR/PLSR estimated FFSOC_Attainable_Def stock values were used for the current analysis. In the spatial model development, due to the limited dataset covering the large parcel of landmass across the Australian continent, the full dataset was bootstrapped to create 100 bootstrapped models by sampling with a replacement rather than simply splitting the dataset into a single disjoint pair of model calibration and validation sets. Similar to IR/PLSR model fitting, model validation was performed using in-the-bag and out-of-bag validation datasets, where the latter was used as an independent validation dataset. The model quality was evaluated using RMSE and LCCC. The RF model was implemented using the computationally efficient ‘ranger’ R package (Wright and Ziegler 2017). In summary, the environmental covariates that were included in the RF model were used to explain the deterministic component of the relationship between the FFSOC_Attainable_Def stock and other features of the physical environment.
The spatial prediction was performed at three arc-second (~90 m) resolutions using the environmental covariates listed in Table S1 using 100 bootstrapped models. The resulting spatial predictions were used to construct a pixel-wise predictive distribution and percentiles (0.05 and 0.95) using the pixel-wise ensemble estimates. In addition, mean and median predictions of the FFSOC_Attainable_Def were also calculated. The modelling and prediction pipeline used for this workflow used custom R scripts developed previously, and the analysis was performed using the ‘Petrichor’ CSIRO High-Performance Computing facility.
Results
Quantifying fine fraction soil organic carbon storage parameters
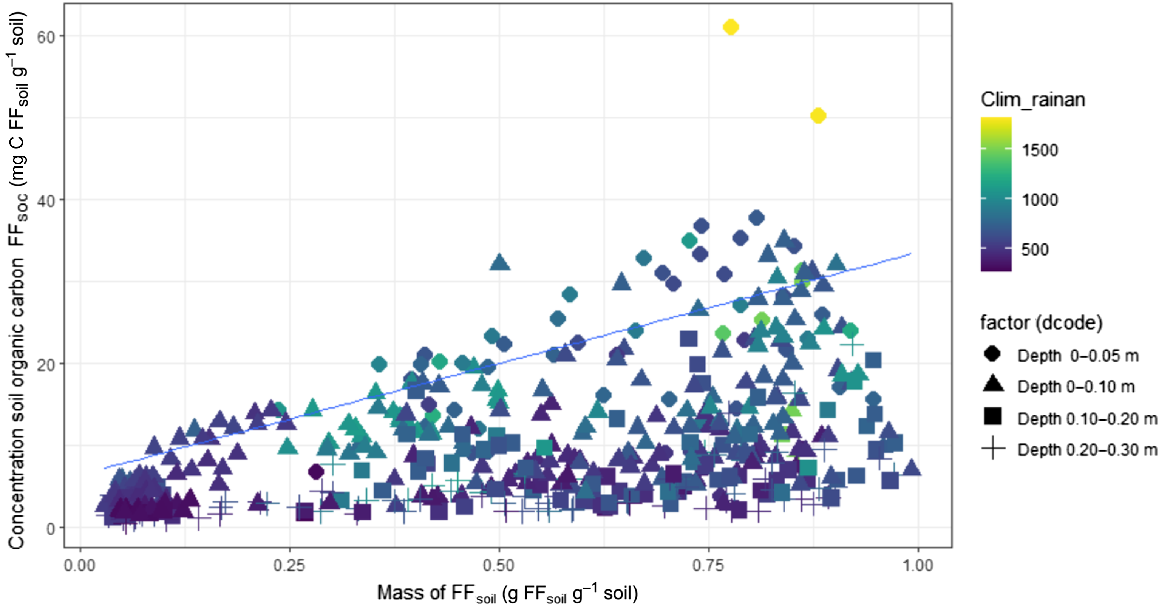
The global analysis performed to derive the FFSOC_Attainable is in Fig. 3. It was revealed that not considering key environmental drivers of carbon inflows and outflows into soils; e.g. mean annual precipitation and other factors such as the sampling depth, generated unrealistic estimates of FFSOC_Attainable_Def. As seen in Fig. 3, the 90th quantile regression line (Blue colour) that defined the FFSOC_ Attainable was governed by the FFSOC_Actual of the soils collected from the 0–0.10 m soil layer and from sites with higher mean annual precipitation. As a result, the estimated FFSOC_Attainable_Def was overestimated for regions with low mean annual precipitation and lower depth intervals even with the same FFSoil mass. The overestimation of the FFSOC_Attainable_Def is due to fitting a global 90th quantile regression where the upper limit of the FFSOC_Attainable_Def is defined using higher values of the FFSOC_Actual reported in topsoils and higher precipitation regions. The likelihood of achieving the global estimated FFSOC_Attainable might not be physically possible under current environmental constraints that affect the carbon inflows and outflows.
Relationship between soil organic carbon concentrations in the fine fraction of soils (FFSoil) with the fine fraction mass. The colour gradient in dots represents the variation in the mean annual precipitation associated with each sampling site and the symbols represent the different soil depths from which soils were collected. The blue colour line indicates 90th quantile regression line.
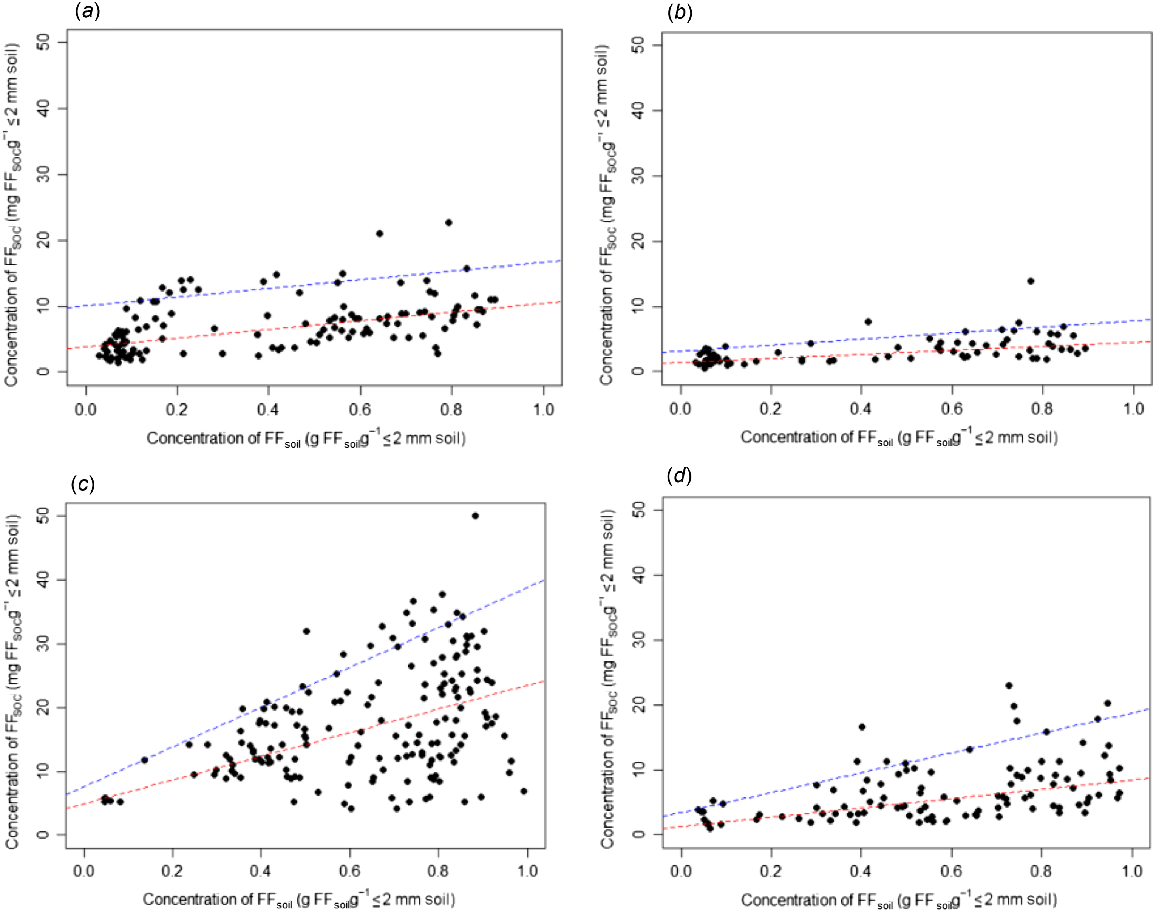
Given the limitations associated with the global analysis (Fig. 3), and the significant (P < 0.0001) higher order interaction terms, showing an inhomogeneity of slopes and/or of the intercepts, were obtained when the precipitation class and depth class were included in the 90th quantile regression analysis, performing 90th quantile regression separately for each combination precipitation and depth was justified (Table 1). As a result, FFSOC_Attainable and subsequent calculations of the FFSOC_Attainable_Def were performed separately for soils derived from different depths and from sites with different mean annual precipitations. The results of the quantile regression analyses completed for each combination of soil depth (0–0.10 m and 0.10–0.30 m) and mean annual precipitation (≤600 mm and >600 mm) are in Fig. 4. The FFSOC_Attainable, as defined by the 90th quantile regression line, in the 0–0.10 m soil layer was approximately twice that associated with the 0.10–0.30 m soil layer. The FFSOC_Attainable associated with soils collected from sites with >600 mm mean annual precipitation was approximately twice that associated with soils collected from sites with ≤600 mm mean annual precipitation.
The summary of the regression analysis that is used to derive the FFAttainable_SOC. (a) Depth 0–0.10 m and LRZ. (b) Depth 0.10–0.30 m and LRZ. (c) Depth 0.0–0.10 m and HRZ. (d) Depth 0.10–0.30 m and HRZ.
The distribution of FFSOC_Attainable_Def concentrations and some summary statistics are in Fig. 5 and Table 2. The density plot for the calculated FFSOC_Attainable_Def associated with each combination of depth and mean annual precipitation is depicted in Fig. 5. Based on the median FFSOC_Attainable_Def values, soils from the HRZ had higher concentrations of FFSOC_Attainable_Def than soils from the LRZ for both depth intervals (Table 2). Further, a higher standard deviation of FFSOC_Attainable_Def was found for soils from the 0–0.10 m depth than the 0.10–0.30 m depth within the HRZ. In contrast to the HRZ, the magnitude of the difference between FFSOC_Attainable_Def median values between the two soil depth layers was higher for the LRZ. In fact, the 0–0.10 m depth layer had FFSOC_Attainable_Def values three times larger than the 0.10–0.30 m depth layer. The quantile regression models estimated parameters are summarised in the Supplementary Table S2.
Density plots for the calculated FFSOC_Attainable_Def concentrations by depth/precipitation classes.
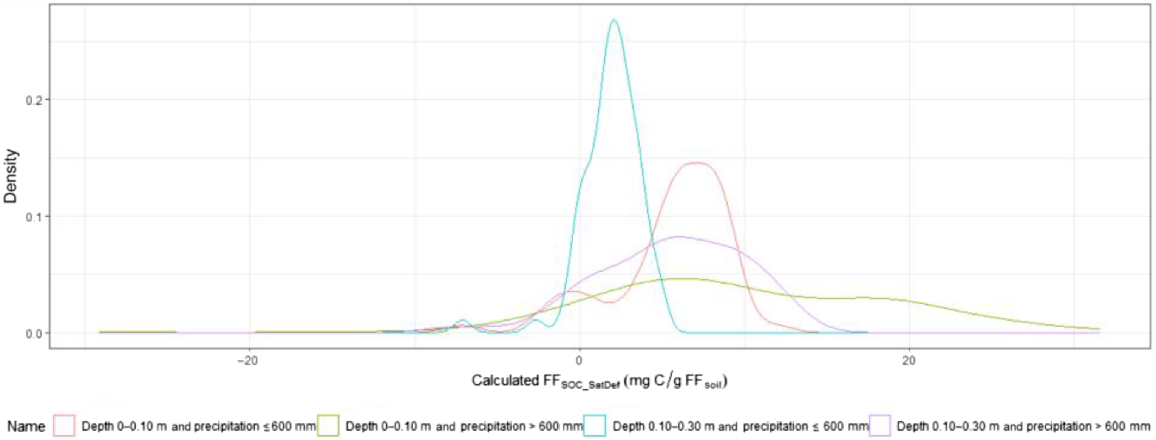
| Name | Min | Quantile: 0.10 | Median | Mean | s.d. | Quantile: 0.90 | Max | |
|---|---|---|---|---|---|---|---|---|
| Depth 0–0.10 m and precipitation ≤600 mm | −7.49 | 0.00 | 6.23 | 5.52 | 3.56 | 8.97 | 12.28 | |
| Depth 0–0.10 m and precipitation >600 mm | −29.14 | 0.00 | 8.90 | 9.90 | 9.02 | 21.58 | 31.61 | |
| Depth 0.10–0.30 m and precipitation ≤600 mm | −7.13 | 0.01 | 2.12 | 1.91 | 1.81 | 3.73 | 4.96 | |
| Depth 0.10–0.30 m and precipitation >600 mm | −8.44 | 0.00 | 6.01 | 5.57 | 4.48 | 11.36 | 13.65 |
Chemometric modelling of attainable soil organic carbon deficit concentrations in the fine fraction of soil
The four separate IR/PLSR calibration models (in-the-bag) for 0–0.10 m and 0.10–0.30 m in the LRZ and HRZ for both soil depth layers, respectively, had mean LCCC values ≥0.85 (Table 3). The out-of-bag validation of the fitted models, except for IR/PLSR model fitted for depth interval 0.10–0.30 m and LRZ, reported an LCCC value greater than 0.75. Model performance appeared to correspond with the number of samples included suggesting that increasing the number of soils in each class through the fractionation of additional soils covering wider spatial variation could increase model performance. In-the-bag and out-of-bag mean RMSE values varied over the combinations of soil depth and mean annual precipitation (Table 3). This was due to variations in the concentrations of the FFSOC_Actual across those groupings. Nonetheless, these results suggested that the IR/PLSR algorithms derived could be used to confidently predict FFSOC_Attainable_Def.
| Model | n | LCCC (in-the-bag validation) | LCCC (out-of-bag validation) | RMSE (in-the-bag validation) (mg C g−1 soil) | RMSE (out-of-bag validation) (mg C g−1 soil) | |
|---|---|---|---|---|---|---|
| LRZ | ||||||
| 0–0.10 m | 124 | 0.88 | 0.77 | 1.56 | 2.13 | |
| 0.10–0.30 m | 72 | 0.86 | 0.56 | 0.83 | 1.48 | |
| HRZ | ||||||
| 0–0.10 m | 172 | 0.90 | 0.83 | 3.67 | 4.66 | |
| 0.10–0.30 m | 107 | 0.92 | 0.78 | 1.56 | 2.61 | |
The model evaluation statistics were generated using the mean of the hundred bootstrapped models.
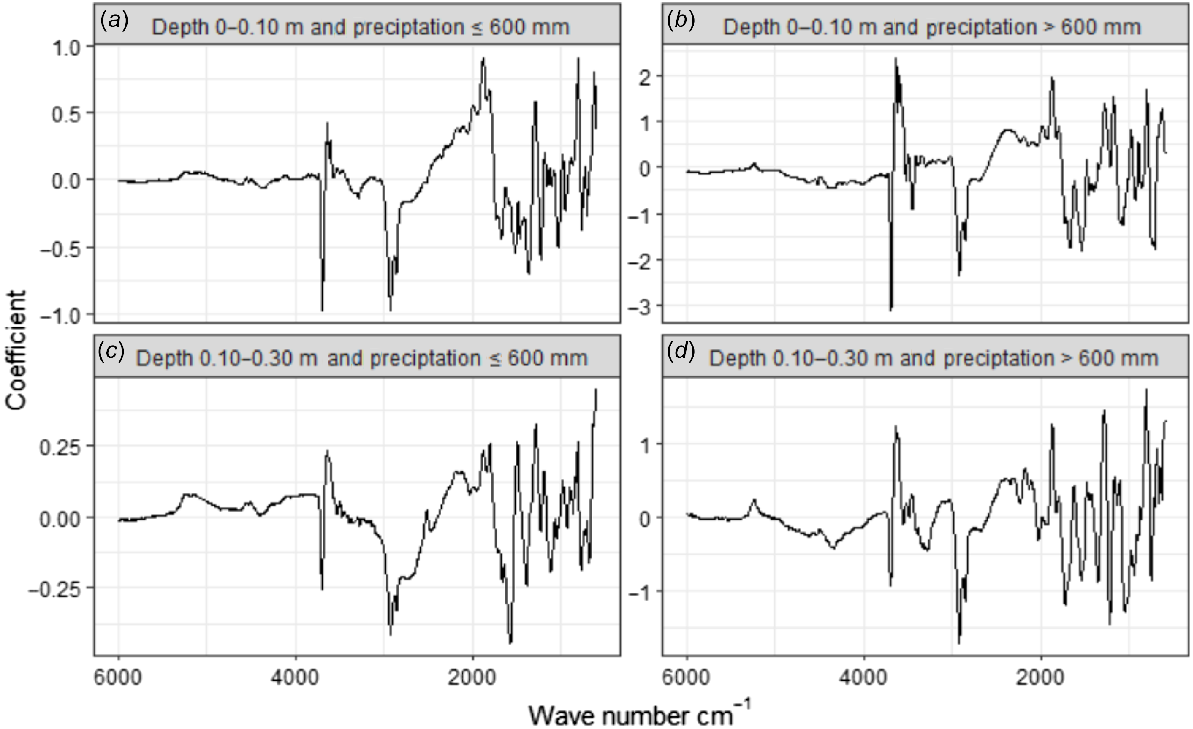
The mean β coefficients associated with 100 bootstrapped for each of the four IR/PLSR calibration models show which spectral components contributed to the prediction of the FFSOC_Attainable_Def (Fig. 6). Examination of these β coefficients showed distinct positive contributions from spectral features at 3640–3604 cm−1, 2296–1872 cm−1, 1284 cm−1, 1180 cm−1, 980 cm−1 and 812 cm−1, corresponding with mineral-associated peaks of gibbsite, quartz, clay and O-Si-O. Conversely, strong negative effects were noted from spectral features at 3700 cm−1, 3208–2806 cm−1, 1624–1552 cm−1 associated with OH−, organic matter, and amide C=O bonds. The negative contribution from organic matter to the predictions was also observed in the β coefficients of FFSOC_Attainable_Def models in Baldock et al. (2019) and as they discuss, is consistent with FFSOC_Attainable_Def declining as organic carbon content increased.
Spatial modelling of attainable soil organic carbon deficit stocks in the fine fraction of soil
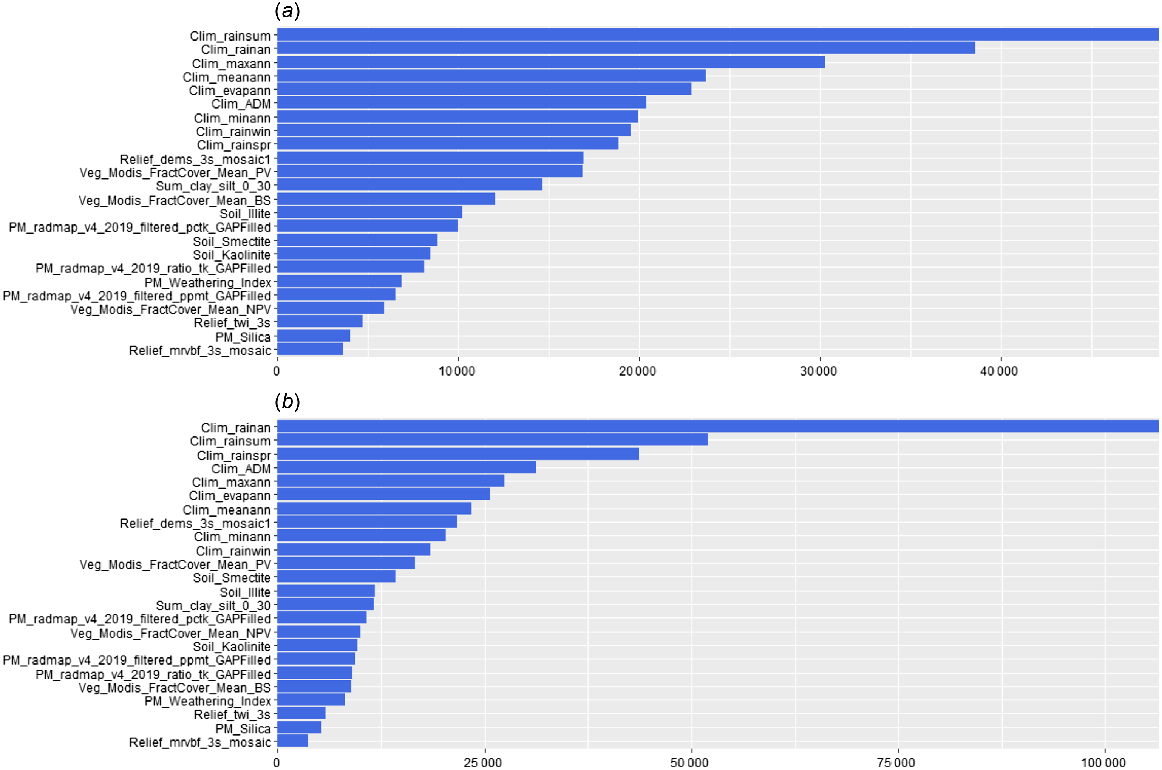
The in-the-bag and out-of-bag spatial machine learning model validation statistics are in Table 4. Both fitted models reported similar model quality assessment statistics with a model accuracy of ~5 Mg C ha−1 as defined by RMSE out-of-bag values. The top 10 environmental covariates for both depth intervals were identified and were predominately associated with climate (Fig. 7). This demonstrated the importance of climatic variables that affect biomass production and carbon flow into the soils. The SOC stabilisation was spatially represented by digitally mapped clay mineral types and the summation of the clay and silt fractions across the study area. The SOC stabilisation properties were ranked 12th and 14th in the VIP plots generated for the fitted spatial random forest models, respectively, for 0–0.10 m and 0.10–0.30 m depth intervals. Having climate-driven variables, clay-silt content (fine fraction) and clay mineral (i.e. illite, kaolinite and smectite) as environmental covariates for the prediction of FFSOC_Attainable_Def demonstrated their importance on the inflow and stabilisation of the SOC within the FFSoil.
| Model | n | LCCC (in-the-bag validation) | LCCC (out-of-bag) validation | RMSE (in-the-bag validation) (Mg C ha−1) | RMSE (out-of-bag) validation (Mg C ha−1) | |
|---|---|---|---|---|---|---|
| 0–0.10 m | 4011 | 0.84 | 0.84 | 5.04 | 5.05 | |
| 0.10–0.30 m | 4012 | 0.87 | 0.87 | 5.37 | 5.38 |
The model evaluation statistics were generated using the mean of 100 bootstrapped spatial models.
The estimated mean importance value for the considered environmental covariates used to estimate the FFSOC_Attainable_Def through fitted 100 bootstrapped spatial Random Forest models. Table S1 describes the covariates. (a) Variable importance of covariates, 0–0.10 m. (b) Variable importance of covariates, 0.10–0.30 m.
Derived spatial estimates are in Fig. 8, and prediction uncertainty was calculated as 0.05 and 0.95 percentiles (see Supplementary Fig. S1). When the FFSOC_Attainable_Def values were closer to zero or negative, those regions have less potential to enhance the SOC in the FFSoil. The spatial pattern of the FFSOC_Attainable_Def demonstrates that some of the land areas under both LRZ and HRZ have FFSOC_Attainable_Def close to zero or negative. For example, in the state of Victoria, the HRZ Gippsland region generally reported less area under the positive stocks of FFSOC_Attainable_Def for the depth interval 0–0.10 m compared to 0.10–0.30 m depth interval estimates.
Distribution of the soil organic carbon attainable deficit stocks across major agricultural production regions of Australia. The spatial estimates were made for specified two depth intervals: (a) 0–0.10 m; and (b) 0.10–0.30 m.
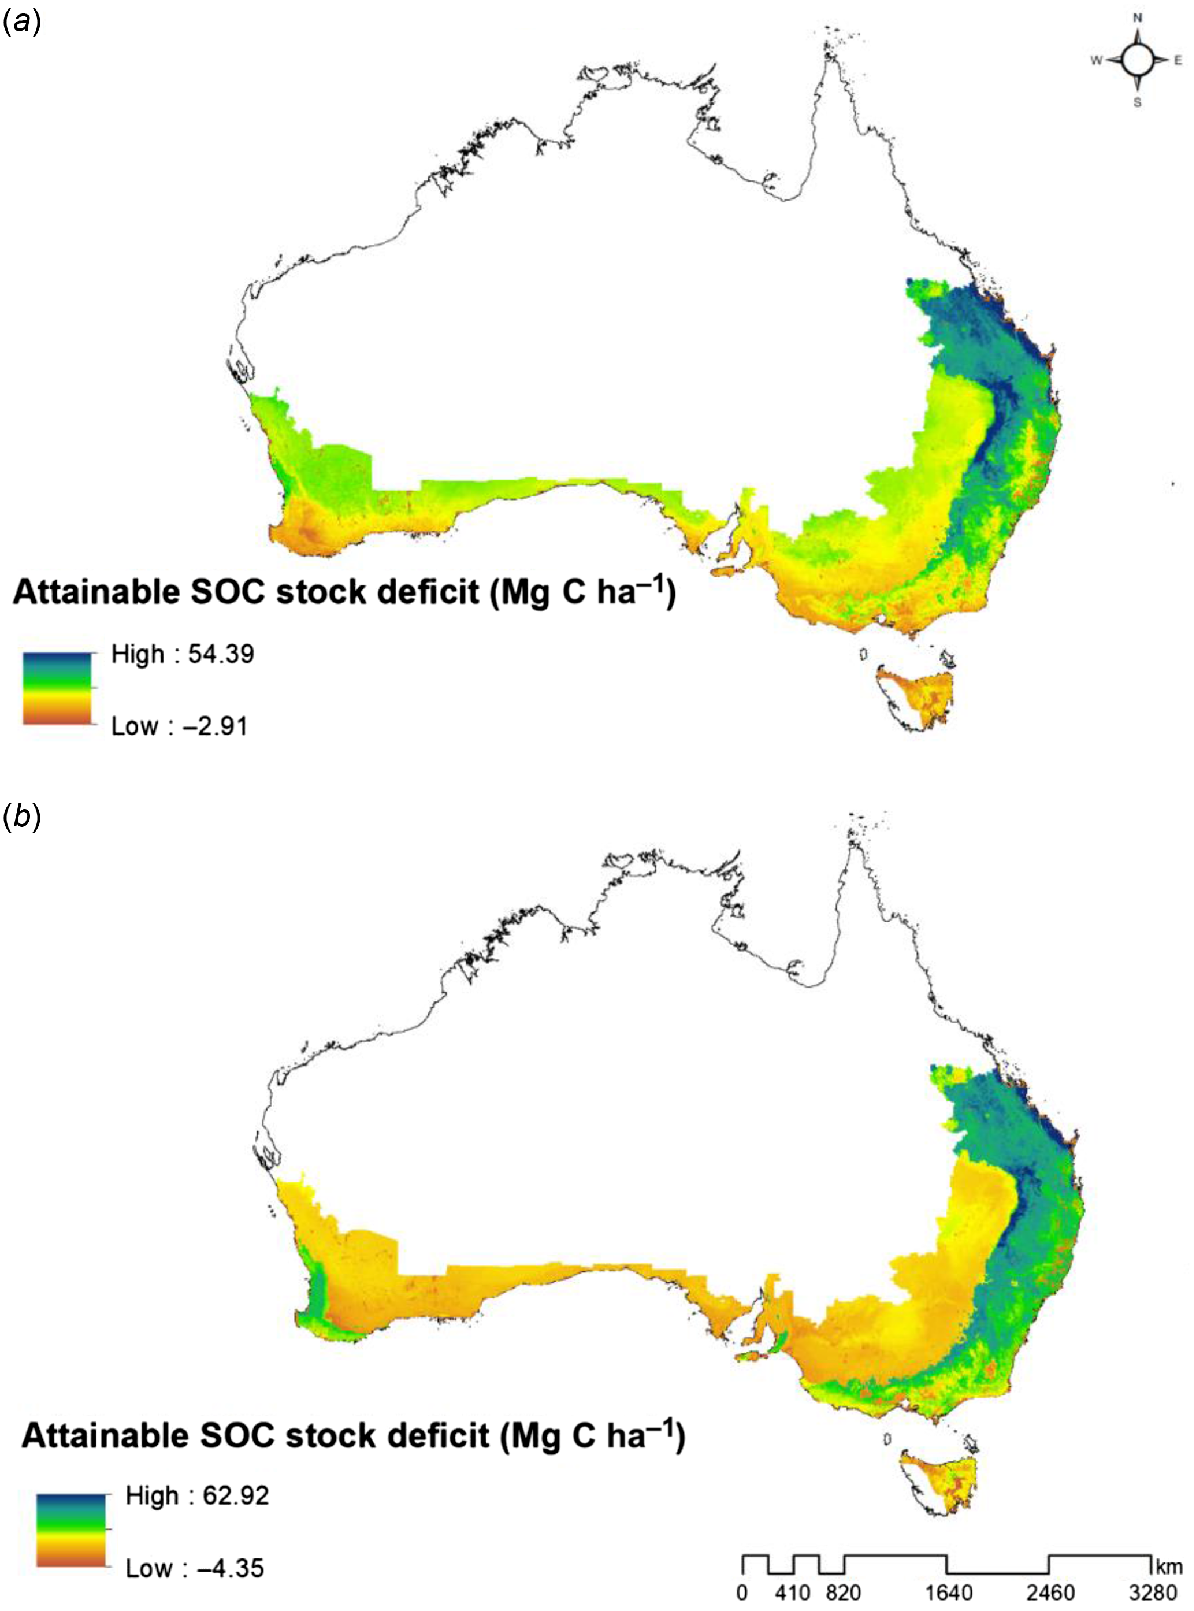
Similarly, in LRZ, the Mallee region reported less area under the positive stocks of FFSOC_Attainable_Def indicating less opportunity to increase the stable form of SOC in the FFSoil. The eastern boundary of Australia, mainly southern Queensland and New South Wales, reported higher positive stock values for the FFSOC_Attainable_Def indicating an opportunity to further enhance the SOC in the FFSoil. The predicted FFSOC_Attainable_Def stocks across Australia revealed an opportunity to increase current FFSOC by 3.47 GT and 3.24 GT for the 0–0.10 m and 0.10–0.30 m depth intervals, respectively. The average estimated positive FFSOC_Attainable_Def stock values were 13.35 Mg C ha−1 and 12.49 Mg C ha−1, respectively, for the 0–0.10 m and 0.10–0.30 m depth intervals. There was also discontinuity of spatial estimated FFSOC_Attainable_Def stock values in the north-south direction in the east of Australia caused by changes in the rainfall gradients of the input covariates.
Discussion
Developing a framework for rapid and cost-effective estimation of FFSOC_Attainable_Def concentrations using IR/PLSR modelling framework
Chemometric models are frequently used to predict various chemical, physical and biological soil properties (Janik et al. 1998; Viscarra Rossel et al. 2006; Stenberg et al. 2010). A range of studies have now demonstrated the ability to predict SOC and its fraction contents from IR spectra using chemometric modelling approaches (Baldock et al. 2013c, 2018). For the SCaRP soil samples used in this study, Baldock et al. (2013c) demonstrated that SOC, SOC fractions, and total nitrogen contents could be predicted using IR spectral data and chemometric modelling. Baldock et al. (2018) extended the use of IR/PLSR estimated SOC contents and SOC fractions to characterise the vulnerability of SOC to subsequent loss in agricultural soils from New Zealand.
Only a few studies (see Baldock et al. 2019) have used a combined IR dataset and chemometric modelling approach, similar to that developed in this study, to derive a unique prediction algorithm for quantifying the FFSOC_Attainable_Def of the FFSoil. Baldock et al. (2019) demonstrated an ability to derive the values of key soil properties identified as drivers of FFSOC_Attainable by Beare et al. (2014) as well as an ability to directly predict measured FFSOC_Attainable and FFSOC_Attainable_Def from the acquired IR spectra. However, neither Baldock et al. (2019) nor the supporting work of Beare et al. (2014) or McNally et al. (2017) examined the potential impacts that rainfall and soil depth or similar drivers of SOC accumulation would have on the derivation of both FFSOC_Attainable and FFSOC_Attainable_Def. Further, these previous studies (Beare et al. 2014; McNally et al. 2017; Baldock et al. 2019) did not define the deficit as FFSOC_Attainable_Def. Instead, the application of a 90th quantile regression to the FFSOC_Actual across a range of soils was assumed to provide a measure of the potential upper limit that FFSOC_Actual could reach. This upper limit of FFSOC_Actual was considered an appropriate value on which to base the calculation of saturation deficit irrespective of soil properties, environmental conditions, or applied management practices that can all influence the amount of carbon captured by plants and added to the soil.
Deriving the soil organic carbon attainable deficit concentrations using broad drivers
A range of environmental factors and soil properties affect the flow of carbon into the soil, how that carbon can be stabilised within the soil matrix, and the fraction that is lost from the soil back to the atmosphere. In Australian dryland agricultural systems, potential dry matter production of crops and pastures is dominantly dictated by rainfall. While an attempt was made to develop different quantile regression models considering soil depth (i.e. 0–0.10 m vs 0.10–0.30 m) and using a broad classification of environmental drivers that affect carbon flows (i.e. LRZ vs HRZ), we acknowledge that, if available, a higher number of measurements could and enable FFSOC_Attainable_Def to be derived based on local properties that govern the inputs and their subsequent biological processing as well the stability of SOC. Although the capacity of soils to store SOC in a stable form is commonly attributed to the FFSoil (clay + silt), there are other properties such as specific surface area, extractable aluminium (pyrophosphate) content of soils, and soil pH that affect the SOC stabilisation capacity (Beare et al. 2014; McNally et al. 2017). In contrast, the emphasis in this study was focused on quantifying the loading of organic carbon within the FFSoil (i.e. the FFSOC_Actual concentration) within soils collected from different depths from sites having different mean annual precipitations.
The framework adopted allowed us to create scalable products on FFSOC_Attainable_Def, from point estimates to spatial estimates using readily available datasets. In contrast to the current study, McNally et al. (2017) developed an empirical model to predict the SOC stabilisation based on the broader soil types (allophanic vs non-allophanic soils) covering topsoils (0–0.15 m) of New Zealand permanent pasture and cropping soils. Our analysis revealed that estimated quantile regression coefficients reported different SOC loadings of the FFSOC mass (y-axis in Fig. 4) and also the rate of stabilisation (slope of the regression respective models, supplied in the supplement Table S2) with change in FFSoil mass after considering the broad rainfall classification and depth intervals. This result demonstrated that performing quantile regression analysis to estimate the FFSOC_Attainable_Def is interlinked to the key drivers that govern the flow of carbon into soil systems. In fact, we found unrealistic values of the FFSOC_Attainable_Def if the values were derived from the global analysis (Fig. 3), due to input datasets consisting of different precipitation gradients and sampling depth intervals. In this study, due to limited measurement dataset, only broad rainfall classification and depth intervals were considered in defining FFSOC_Attainable_Def. We concluded that local analysis to derive FFSOC_Attainable_Def is a more appropriate way forward compared to the use of a single global analysis in future studies.
Are attainable deficit estimates static or dynamic?
The key assumption made in the current analysis is that the upper 90th quantile regression, used to define the FFSOC_Attainable, should be applied separately to groups of soils differentiated based on the magnitude of FFSOC_Actual drivers. The magnitude of carbon input to soil represents an additional driver that was not included in the analyses completed due to a lack of site-specific data. Although the results were strongly influenced by mean annual precipitation, plant productivity and thus carbon inputs to the soil within dryland agricultural regions of Australia are significantly impacted by management practice. Hochman et al. (2016) reported that the average wheat yield in Australia was 1.7 Mg ha−1 (1996–2010), and the average simulated water-limited yield potential was 3.5 Mg ha−1. Their analysis revealed an average wheat yield gap of 1.8 Mg ha−1 representing 51% of the potential yield. If the yield gap can be reduced without altering the harvest index or root/shoot ratios and stubbles are retained the flow of carbon to the soil can be increased. Under such conditions, calculated FFSOC_Attainable_Def values for a given soil depth and mean annual precipitation might change due to increased carbon flow to the soil. Thus, values obtained for FFSOC_Attainable and FFSOC_Attainable_Def should be considered dynamic and continually recalculated as improvements in productivity are realised through the use of improved genetic material and management practices.
The above discussion then leads to the question of what is the appropriate manner to refer to the SOC deficit when values are derived from a range of soils considered to be representative of current agricultural management practices? Do the values derived provide an indication of the potential upper limits of FFSOC_Actual that may be possible for the soils or are they only representative of what can be obtained using previous and current management practices and types of crop/pasture types grown? As a result, we argue that the approach used in this study and previous studies (e.g. Beare et al. 2014; McNally et al. 2017; Six et al. 2002) defines an FFSOC_Actual stock that is attainable (i.e. the FFSOC_Attainable) given the current soil properties, environmental conditions and applied management practices and not a potential upper limit of FFSOC_Attainable_Def. The potential upper limit of FFSOC_Attainable_Def should be considered as conceptual, unknown and undefinable. Thus, when attempting to quantify the FFSOC_Attainable_Def based on FFSOC_Actual values obtained across a range of soils, it should be defined as an attainable deficit rather than a potential deficit.
Identification of spatial drivers of FFSOC_Attainable_Def
Previous work on Australian continental scale spatial modelling of SOC includes mapping of SOC stocks (Viscarra Rossel et al. 2014), and SOC fractions (Viscarra Rossel et al. 2019; Román Dobarco et al. 2022); however, no literature was found on spatial modelling of the FFSOC_Attainable_Def. Therefore, a comparison of the spatial drivers of FFSOC_Attainable_Def found in this study was completed against previously published Australian literature on total SOC and HOC. Similar to the current analysis of FFSOC_Attainable_Def spatial modelling (0–0.10 m and 0.10–0.30 m), Viscarra Rossel et al. (2014) reported that for the Australian cool temperate and temperate-Mediterranean regions rainfall was a key driver of the SOC stocks (0–0.30 m). Viscarra Rossel et al. (2014) used annual cumulative rainfall as a driver of SOC stocks, while in the current analysis, season rainfall was used in addition to cumulative annual rainfall. Further, Viscarra Rossel et al. (2019) identified climate drivers, namely, mean annual temperature, mean annual precipitation, and potential evapotranspiration, as the highest ranking important variables for estimating SOC using a global variable importance analysis for the continental scale mapping of the HOC. Similar climate drivers governed the spatial distribution of FFSOC_Attainable_Def in the current study for both depth intervals (Fig. 7). Román Dobarco et al. (2022), used isometric log-ratio transformation (ilr) for the SOC fractions, namely POC, HOC and ROC, instead of mapping those fractions using individual models. Therefore, direct comparison with the current study is not feasible. However, their two ilr models revealed that radiometric and climate variables were key drivers for the respective models fitted for the considered depth intervals, namely 0-0.05 m, 0.05–0.15 m, and 0.15–0.30 m. Only one radiometric variable was included in the current study when considering the top 15 variables based on VIP ranking. Overall, it can be concluded that key drivers of the FFSOC_Attainable_Def followed a similar pattern to drivers of the SOC and its fraction stocks for the Australian context.
How the current proposed framework differs from the existing approaches used to quantify soil organic carbon storage
As discussed earlier, our approach was based on defining the FFSOC_Attainable_Def associated with the FFSoil. Further, we deployed an empirical approach through the fusion of: (1) measurements of FFSOC_Actual and FFSoil masses; (2) statistical modelling (i.e. quantile and IR/PLSR regression modelling); and (3) spatial upscaling through an ensemble machine learning approach. From the carbon accounting perspective, the total SOC is used to define the carbon storage capacities. This can cause volatility due to residence time of different SOC fractions, particularly labile forms of SOC. On the other hand, the current approach is conservative and focuses on the more stable forms of SOC resulting in less vulnerability and potential volatility. For example, Padarian et al. (2021) used an empirical approach to quantify the SOC storage capacity using total SOC stocks through the development of a machine learning quantile regression model. In contrast in the current analysis, the FFSOC_Attainable_Def was derived using the loading of carbon in the FFSoil.
Implications
Current analysis revealed the successful use of the IR/PLSR models beyond the prediction of concentration of SOC and its component fractions and their vulnerability to loss. In fact, IR/PLSR models developed herein for FFSOC_Attainable_Def can be used along with other IR tools to evaluate the current status of the SOC, its composition, vulnerability and attainable space, adding extra value for the landholder and carbon aggregators. These IR-derived datasets will provide a better assessment of the attainable SOC deficit and aid in the derivation of realistic carbon sequestration targets within future carbon projects.
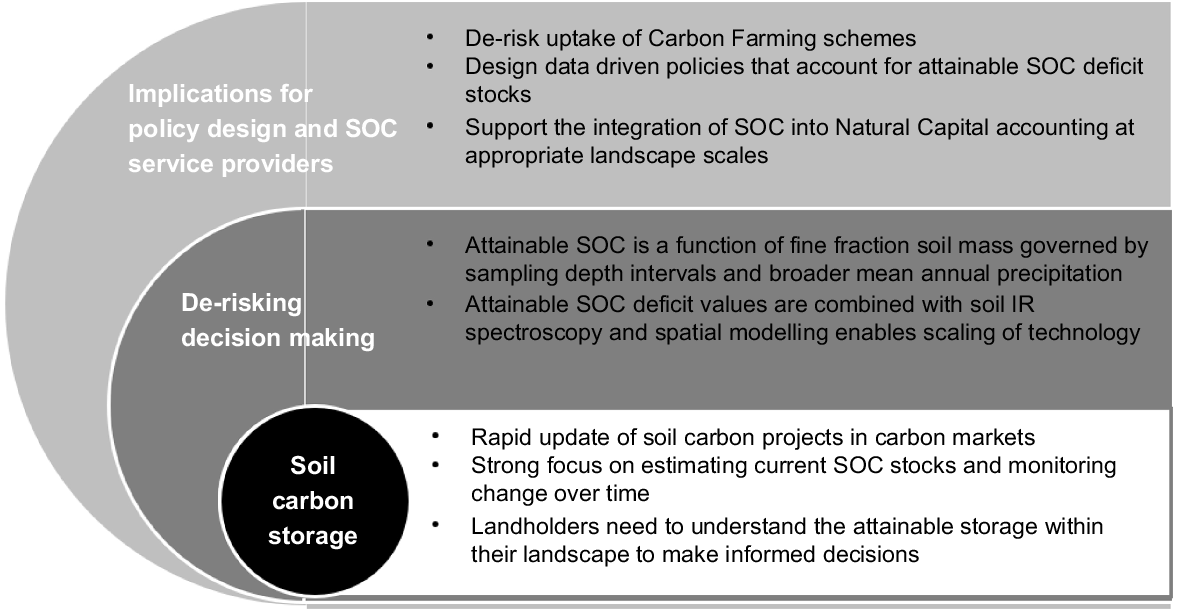
Further, derived spatial estimates and their prediction uncertainties can be used to evaluate the potential of land parcels to increase SOC sequestration in the FFSoil. We have derived the spatial estimates at a resolution of 90 m, which will provide a meaningful insight at the regional scale, but applications are limited to the paddock scale. These derived estimates will provide insight into the attainable mineral-associated SOC that can be further increased. Although these estimates are derived based on the previous and current land management practices, the estimates will provide firsthand information for the aggregators to explore land parcels that have a higher potential to increase SOC, higher ability to retain carbon/permanence through mineral association and minimise the risk of reversal. With the spatialised outputs generated at a 90 m spatial resolution, the outputs could be used as guidance information rather than explicit information. However, the framework developed in the current study could be used to generate project-specific information through a combination of IR/PLSR and spatial modelling using the project specific datasets. For policymakers, these spatial estimates will enable the identification of regions where targeted policies can be implemented when designing SOC projects. For project and policy scale applications, the generated spatial outputs should be used while considering their uncertainties. The graphical summary of the pathways to market and policy directions is depicted in Fig. 9.
Conclusions
The framework developed to evaluate the FFSOC_Attainable_Def used a previously collected dataset generated via the fractionation scheme presented by Baldock et al. (2013a). Continuous update of the derived FFSOC_Attainable_Def values will be required when new datasets covering different or new management practices capable of improving the capture of carbon and its addition to soil become available. The derived FFSOC_Attainable_Def values were based on the previous and current land management practices operating at the time the soils were collected. With improvements to productivity and an emphasis on carbon retention within agricultural systems over the last decade, the FFSOC_Attainable and FFSOC_Attainable_Def values derived for the soils included in this study may require updating through the collection and analysis of new soil samples. Therefore, the analysis framework developed provides a more appropriate mechanism for assessing the potential additional accumulation that is possible within the fine fraction of a soil.
Data availability
Primary input datasets used in the current analysis are not available publicly due to privacy of the individual landholders. Derived spatial outputs are available through CSIRO subjected to terms and conditions set by the CSIRO under a contractual agreement.
Conflicts of interest
SK is an Associate Editor for Soil Research who had no editorial involvement with this manuscript, which was handled independently by other members of the Editorial Board. The authors declare no other conflicts of interest.
Acknowledgements
We thank Andrew Moore (CSIRO Resilience Coordinator) and Michael Battaglia (CSIRO Towards Net Zero Mission) for constrictive feedback at the initial phase of this study. We also thank Brendan Malone (CSIRO Agriculture and Food) for sharing expertise on spectral data modelling.
References
Baldock JA, Skjemstad JO (2000) Role of the soil matrix and minerals in protecting natural organic materials against biological attack. Organic Geochemistry 31, 697-710.
| Crossref | Google Scholar |
Baldock JA, Sanderman J, Macdonald LM, Puccini A, Hawke B, Szarvas S, McGowan J (2013a) Quantifying the allocation of soil organic carbon to biologically significant fractions. Soil Research 51, 561-576.
| Crossref | Google Scholar |
Baldock J, Macdonald L, Sanderman J (2013b) Foreword to ‘soil carbon in Australia’s agricultural lands’. Soil Research 51, i-ii.
| Crossref | Google Scholar |
Baldock JA, Hawke B, Sanderman J, Macdonald LM (2013c) Predicting contents of carbon and its component fractions in Australian soils from diffuse reflectance mid-infrared spectra. Soil Research 51, 577-595.
| Crossref | Google Scholar |
Baldock JA, Beare MH, Curtin D, Hawke B (2018) Stocks, composition and vulnerability to loss of soil organic carbon predicted using mid-infrared spectroscopy. Soil Research 56, 468-480.
| Crossref | Google Scholar |
Baldock JA, McNally SR, Beare MH, Curtin D, Hawke B (2019) Predicting soil carbon saturation deficit and related properties of New Zealand soils using infrared spectroscopy. Soil Research 57, 835-844.
| Crossref | Google Scholar |
Beare MH, McNeill SJ, Curtin D, Parfitt RL, Jones HS, Dodd MB, Sharp J (2014) Estimating the organic carbon stabilisation capacity and saturation deficit of soils: a New Zealand case study. Biogeochemistry 120, 71-87.
| Crossref | Google Scholar |
Berthelin J, Laba M, Lemaire G, Powlson D, Tessier D, Wander M, Baveye PC (2022) Soil carbon sequestration for climate change mitigation: mineralization kinetics of organic inputs as an overlooked limitation. European Journal of Soil Science 73, e13221.
| Crossref | Google Scholar |
Breiman L (2001) Random forests. Machine Learning 45, 5-32.
| Crossref | Google Scholar |
Cotrufo MF, Ranalli MG, Haddix ML, Six J, Lugato E (2019) Soil carbon storage informed by particulate and mineral-associated organic matter. Nature Geoscience 12, 989-994.
| Crossref | Google Scholar |
Dangal SRS, Schwalm C, Cavigelli MA, Gollany HT, Jin VL, Sanderman J (2022) Improving soil carbon estimates by linking conceptual pools against measurable carbon fractions in the DAYCENT model version 4.5. Journal of Advances in Modeling Earth Systems 14, e2021MS002622.
| Crossref | Google Scholar |
Gray JM, Bishop TFA, Wilson BR (2015) Factors controlling soil organic carbon stocks with depth in Eastern Australia. Soil Science Society of America Journal 79, 1741-1751.
| Crossref | Google Scholar |
Gray J, Karunaratne S, Bishop T, Wilson B, Veeragathipillai M (2019) Driving factors of soil organic carbon fractions over New South Wales, Australia. Geoderma 353, 213-226.
| Crossref | Google Scholar |
Hochman Z, Gobbett D, Horan H, Navarro Garcia J (2016) Data rich yield gap analysis of wheat in Australia. Field Crops Research 197, 97-106.
| Crossref | Google Scholar |
Ingram JSI, Fernandes ECM (2001) Managing carbon sequestration in soils: concepts and terminology. Agriculture, Ecosystems & Environment 87, 111-117.
| Crossref | Google Scholar |
Janik LJ, Merry RH, Skjemstad JO (1998) Can mid infrared diffuse reflectance analysis replace soil extractions? Australian Journal of Experimental Agriculture 38, 681-696.
| Crossref | Google Scholar |
Karunaratne SB, Bishop TFA, Lessels JS, Baldock JA, Odeh IOA (2015) A space–time observation system for soil organic carbon. Soil Research 53, 647-661.
| Crossref | Google Scholar |
Koenker R, Portnoy S, Ng PT, Melly B, Zeileis A, Grosjean P, Moler C, Saad Y, Chernozhukov V, Fernandez-Val I, Ripley BD (2023) Package ‘quantreg’. R Foundation for Statistical Computing. Available at https://cran.r-project.org/web/packages/quantreg/quantreg.pdf
Lal R (2004) Soil carbon sequestration to mitigate climate change. Geoderma 123, 1-22.
| Crossref | Google Scholar |
Lal R (2016) Soil health and carbon management. Food and Energy Security 5, 212-222.
| Crossref | Google Scholar |
Lawrence I-KL (1989) A concordance correlation coefficient to evaluate reproducibility. Biometrics 45, 255-268.
| Crossref | Google Scholar |
Lehmann J, Bossio DA, Kögel-Knabner I, Rillig MC (2020) The concept and future prospects of soil health. Nature Reviews Earth & Environment 1, 544-553.
| Crossref | Google Scholar | PubMed |
Liland KH, Mevik B-H, Wehrens R (2022) pls: Partial least squares and principal component regression. R Package Version 2.8–1. Available at https://CRAN.R-project.org/package=pls
Luo Z, Wang E, Sun OJ (2010) Soil carbon change and its responses to agricultural practices in Australian agro-ecosystems: a review and synthesis. Geoderma 155, 211-223.
| Crossref | Google Scholar |
McBratney AB, Mendonça Santos ML, Minasny B (2003) On digital soil mapping. Geoderma 117, 3-52.
| Crossref | Google Scholar |
McNally SR, Beare MH, Curtin D, Meenken ED, Kelliher FM, Calvelo Pereira R, Shen Q, Baldock J (2017) Soil carbon sequestration potential of permanent pasture and continuous cropping soils in New Zealand. Global Change Biology 23, 4544-4555.
| Crossref | Google Scholar | PubMed |
Minasny B, Malone BP, McBratney AB, Angers DA, Arrouays D, Chambers A, Chaplot V, Chen Z-S, Cheng K, Das BS, Field DJ, Gimona A, Hedley CB, Hong SY, Mandal B, Marchant BP, Martin M, McConkey BG, Mulder VL, O’Rourke S, Richer-de-Forges AC, Odeh I, Padarian J, Paustian K, Pan G, Poggio L, Savin I, Stolbovoy V, Stockmann U, Sulaeman Y, Tsui C-C, Vågen T-G, van Wesemael B, Winowiecki L (2017) Soil carbon 4 per mille. Geoderma 292, 59-86.
| Crossref | Google Scholar |
Padarian J, Minasny B, McBratney AB, Smith P (2021) Additional soil organic carbon storage potential in global croplands. SOIL Discussions 2021, 1-15.
| Crossref | Google Scholar |
Paustian K, Collier S, Baldock J, Burgess R, Creque J, DeLonge M, Dungait J, Ellert B, Frank S, Goddard T, Govaerts B, Grundy M, Henning M, Izaurralde RC, Madaras M, McConkey B, Porzig E, Rice C, Searle R, Seavy N, Skalsky R, Mulhern W, Jahn M (2019) Quantifying carbon for agricultural soil management: from the current status toward a global soil information system. Carbon Management 10, 567-587.
| Crossref | Google Scholar |
Poeplau C, Don A, Six J, Kaiser M, Benbi D, Chenu C, Cotrufo MF, Derrien D, Gioacchini P, Grand S, Gregorich E, Griepentrog M, Gunina A, Haddix M, Kuzyakov Y, Kühnel A, Macdonald LM, Soong J, Trigalet S, Vermeire M-L, Rovira P, van Wesemael B, Wiesmeier M, Yeasmin S, Yevdokimov I, Nieder R (2018) Isolating organic carbon fractions with varying turnover rates in temperate agricultural soils – a comprehensive method comparison. Soil Biology and Biochemistry 125, 10-26.
| Crossref | Google Scholar |
Robinson DA, Panagos P, Borrelli P, Jones A, Montanarella L, Tye A, Obst CG (2017) Soil natural capital in europe; a framework for state and change assessment. Scientific Reports 7, 6706.
| Crossref | Google Scholar | PubMed |
Román Dobarco M, Wadoux AMJ-C, Malone B, Minasny B, McBratney AB, Searle R (2022) Mapping soil organic carbon fractions for Australia, their stocks and uncertainty. Biogeosciences Discuss 2022, 1-38.
| Crossref | Google Scholar |
Sanderman J, Hengl T, Fiske GJ (2017) Soil carbon debt of 12,000 years of human land use. Proceedings of the National Academy of Sciences 114, 9575.
| Crossref | Google Scholar |
Six J, Elliott ET, Paustian K (2000) Soil macroaggregate turnover and microaggregate formation: a mechanism for C sequestration under no-tillage agriculture. Soil Biology and Biochemistry 32, 2099-2103.
| Crossref | Google Scholar |
Six J, Conant RT, Paul EA, Paustian K (2002) Stabilization mechanisms of soil organic matter: Implications for C-saturation of soils. Plant and Soil 241, 155-176.
| Crossref | Google Scholar |
Skjemstad JO, Spouncer LR, Cowie B, Swift RS (2004) Calibration of the Rothamsted organic carbon turnover model (RothC ver. 26.3), using measurable soil organic carbon pools. Soil Research 42, 79-88.
| Crossref | Google Scholar |
Stenberg B, Viscarra Rossel RA, Mouazen AM, Wetterlind J (2010) Chapter 5: Visible and near infrared spectroscopy in soil science. In ‘Advances in agronomy’. (Ed. DL Sparks) pp. 163–215. (Academic Press) https://doi.org/10.1016/S0065-2113(10)07005-7
Stewart CE, Paustian K, Conant RT, Plante AF, Six J (2007) Soil carbon saturation: concept, evidence and evaluation. Biogeochemistry 86, 19-31.
| Crossref | Google Scholar |
Stewart CE, Plante AF, Paustian K, Conant RT, Six J (2008) Soil carbon saturation: linking concept and measurable carbon pools. Soil Science Society of America Journal 72, 379-392.
| Crossref | Google Scholar |
Viscarra Rossel RA, Walvoort DJJ, McBratney AB, Janik LJ, Skjemstad JO (2006) Visible, near infrared, mid infrared or combined diffuse reflectance spectroscopy for simultaneous assessment of various soil properties. Geoderma 131, 59-75.
| Crossref | Google Scholar |
Viscarra Rossel RA, Webster R, Bui EN, Baldock JA (2014) Baseline map of organic carbon in Australian soil to support national carbon accounting and monitoring under climate change. Global Change Biology 20, 2953-2970.
| Crossref | Google Scholar | PubMed |
Viscarra Rossel RA, Lee J, Behrens T, Luo Z, Baldock J, Richards A (2019) Continental-scale soil carbon composition and vulnerability modulated by regional environmental controls. Nature Geoscience 12, 547-552.
| Crossref | Google Scholar |
White RE, Davidson B, Lam SK, Chen D (2018) A critique of the paper ‘Soil carbon 4 per mille’ by Minasny et al. (2017). Geoderma 309, 115-117.
| Crossref | Google Scholar |
Wright MN, Ziegler A (2017) ranger: a fast implementation of random forests for high dimensional data in C++ and R. Journal of Statistical Software 77, 1-17.
| Crossref | Google Scholar |