

Fertilisation with P, N and S requires additional Zn for healthy plantation tree growth on low fertility savanna soils
Stan J. Rance A B , David M. Cameron B , Emlyn R. Williams C and Carl R. Gosper A D *
A D *
A
B
C
D
Abstract
Soil nutrient limitations characterise savanna soils globally and are one of several constraints to establishing productive tree plantations and enhancing economic opportunities in tropical regions. Fertilisation offers an approach to overcome soil nutrient limitations to maximise tree growth and health, but requires research on nutrient contents, composition, rates and methods of delivery in the context of soil characteristics.
To determine the optimal contents, rates and methods of application of fertiliser to maximise the growth and health of the plantation timber species Pinus caribaea on low fertility savanna soils.
Factorial field experiments tested growth responses to applications of phosphorus (P), nitrogen (N) and sulfur (S) on three soils near Darwin, Australia. Further experiments tested effects of zinc (Zn), copper (Cu) and potassium (K) application and small-scale variation in soil characteristics on tree performance.
Positive growth responses to P, N and S were recorded, yet unhealthy trees developed, particularly in better-performing treatments. Second phase experiments addressing potential causes of ill health confirmed Zn limitations. Intense spatial soil sampling demonstrated substantial variation in cation exchange capacity and composition over short distances.
Nutrient additions to enhance plantation tree growth will need to encompass minor and trace elements in addition to N, P and S, specifically Zn, and consider the mechanism of application.
Small-scale variability in cation exchange capacity and composition indicates that optimal fertilisation rates will vary spatially, and that soil sampling for site characterisation would be more accurate with replicated dispersed samples.
Keywords: cation exchange capacity, nutrient limitation, Pinus caribaea, plant nutrition, soil limitation, soil variation, tree health, tropical soil.
Introduction
There has been longstanding interest in establishing tree plantations in the northern parts of the Northern Territory of Australia (the area north of 15°S) to satisfy existing and potentially increasing timber demand, as is the case in other savanna regions globally (Kanowski 1997). Initial research concentrated on testing tree species and provenances from other parts of the tropics with potential to tolerate the conditions in the region (Stocker 1972; Cameron 1985), but broad similarities in tree performance across species has led to an increasing focus on climatic, soil and pest limitations on tree growth. Savanna regions are characterised by an extended dry season, low fertility soils with typically limited phosphorus (P) and nitrogen (N), and antagonistic activities of termites and other pests (Pellegrini 2016; Rance et al. 2020).
Generally, the soils of the Northern Territory savanna zone most structurally suitable for plantations or agriculture have low fertility with very low cation exchange capacities. Responses to N, P and potassium (K) have long been known (Stocker 1969). Yet, fertiliser application rates commonly used in agriculture elsewhere could induce imbalances in the low fertility soils, tree growth responses were sensitive to rates, combinations and proportions of fertilisers, and there seemed to be step-wise responses (Rance et al. 2020). Growth responses to P appear ubiquitous, and positive responses to P plus N common (Aldrick and Robinson 1972; Winter and Jones 1977). Significant P × T (T being a combined minor and trace element treatment) and K × T interactions have been recorded (Cameron et al. 1982), as have positive responses to N or the T treatment in the presence of P and negative responses in the absence of P (Cameron et al. 1981). Sulfur (S), either with or separate from T, increased growth in the presence of P + N in glasshouse trials (Rance et al. 1983, 2020). However, trees in the field frequently develop unhealthy new growth near the end of their second or third dry season, more commonly or sooner on fertilised trees than unfertilised trees (Rance et al. 2022). The availability of cations also appears to play an important role in plant growth, mediated through soil pH which in turn can be altered by fertiliser addition (Rance et al. 2020). Zinc (Zn) deficiency was identified as a contributing factor (Rance et al. 1982). This combination of soil limitations is typical of savanna soils globally (Pellegrini 2016), and consistent with a long history of nutrient loss through fire and weathering (Orians and Milewski 2007; Devi Kanniah et al. 2010; Rance et al. 2020).
Despite this growing body of work on tree responses to fertilisation on savanna soils, uncertainty remains over field responses (c.f. glasshouse), the timing of expression of nutrient deficiencies, the optimal rates, formulations, timing and methods of application of nutrients, and the effects of local variation in soils. The general pattern was a response to P, followed by one or more of N, S and K, not necessarily in a consistent order, but some other factor related to soil pH seemed to be influencing nutrient uptake and susceptibility to termite attack. The aim of this study was to examine field responses of N, P and S on three of the soils examined in preliminary glasshouse factorial experiments (Rance et al. 2020). This was a study of threes; testing three levels of N, P and S on three sites (soils). If symptoms of ill health appeared through the factorial experiments, the capacity to initiate second phase experiments testing minor and trace element treatments (e.g. Zn, copper (Cu) and K) and methods of application was built into the experimental program. Renewed interest in establishing agriculture and tree plantations in the north of Australia (Office of Northern Australia 2015) underpins the importance of this research on savanna soil limitations.
Materials and methods
The work described here was centred on Darwin, Northern Territory, Australia. Darwin’s climate is monsoonal with marked wet and dry seasons, where ~90% of the annual rainfall occurs from November to April, and no rain recorded from May to September in most years. The three sites were Three Ways on Melville Island (TW; 11°40′S, 130°42′E on a Red Kandosol (gravelly red earth)), Humpty Doo (HD; 12°33′S, 131°20′E, on a Rudosol (sandy loam)) and Gunn Point (GP; 12°21′S, 131°9′E, a Red Kandosol). The wet season arrived earliest and total rainfall was highest at TW, with HD being the furthest inland and driest. Two sites seemed to be free of Mastotermes darwiniensis Froggatt termites (TW and HD; Fox and Clarke 1972), and were the sites examined by Cameron et al. (1982). Some soil data for the sites are presented in Table 1, showing the general low nutrient content and low cation exchange capacity.
| Site | Depth (cm) | pHA | EC2.5A (μS cm−1) | Org.CB (mg g−1) | Total | CECG (cmol kg−1) | ||||
|---|---|---|---|---|---|---|---|---|---|---|
| NC (mg g−1) | PD (μg g−1) | SE (μg g−1) | ZnF (μg g−1) | |||||||
| TW | 0–10 | 5.1 | 23.4 | 15.9 | 0.64 | 95 | 125 | 3.7 | 3.7 | |
| 10–20 | 5.2 | 16.4 | 14.4 | 0.34 | 82 | 120 | 4.9 | 2.2 | ||
| HD | 0–10 | 5.0 | 26.3 | 21.7 | 1.66 | 280 | 255 | 5.5 | 7.0 | |
| 10–20 | 5.3 | 19.2 | 14.4 | 1.03 | 260 | 240 | 5.4 | 4.8 | ||
| GP | 0–10 | 5.7 | 32.0 | 15.2 | 0.92 | 120 | 175 | nd | 8.4 | |
| 10–20 | 5.3 | 27.0 | 6.5 | 0.48 | 120 | 170 | nd | 8.4 | ||
nd, not determined.
The sites were cleared and root raked to approximately 20–25 cm depth during the dry season to remove stumps and residual roots to minimise resprouting from lignotubers, concentrating woody plant material in windrows off site which were burned. Initial soil cores to 1.5 m across the three sites indicated uniform soil profiles. Weeds that germinated after early wet season storms were mowed and the sites cultivated, and plots pegged. Factorial field experiments tested three levels each of N, P and S, with the 27 treatments replicated twice, at the three sites.
There were few weeds on site at the time of planting and woody weed seedlings were removed by hand. At TW, trees were planted at 1.5 m × 1.5 m spacing (4444 stems ha−1), 49 trees per plot but only the inner 5 × 5 net plot trees were measured and sampled. At GP and HD, trees were planted at 2.1 m × 1.05 m spacing (4535 stems ha−1), 56 trees per plot with 5 × 6 net plot trees. An additional isolation row was planted around the perimeter at each site. This was a much higher planting density than the plantation standard (at that time) of 1111 stems ha−1 but restricted each experiment to 0.6 ha to minimise site heterogeneity and constraining the trees to extract necessary nutrients from limited soil volumes (Richards 1961). The close spacing was expected to allow the trees to rapidly occupy the site and compete with weeds. It was anticipated that responses to P, N or S were likely and would emerge rapidly, but competition between trees for water and light could mask treatment effects after 3 or 4 years.
Pinus caribaea was one of the more successful plantation species tested in the Northern Territory (Craciun 1978), and seedlings of P. caribaea var. hondurensis Barr. & Golf. (Belize provenance) raised in tubes in a nursery were planted into holes made with a motorised soil auger after planting tubes were removed. Planting the 9600 seedlings started at TW with the early onset of the wet season and finished at HD.
Fertiliser was broadcast by hand evenly across each plot at the rates and forms shown in Table 2. To minimise uneven distribution, each plot was divided into 14 or 16 sub-plots and the appropriate amount broadcast to each. The scheduled N1, P1 and S1 fertiliser application rates were near the estimated recommended optimum levels, the N2, P2 and S2 rates higher. However, applications of N as NH4NO3 to TW and HD soils in the glasshouse induced symptoms of ill health (Cameron et al. 1982) so the 0.12- and 0.15-year applications were made at half the rates shown in Table 2. Basal dressings of KCl and a ‘Complete’ minor and trace element fertiliser mixture were not applied to allow symptoms of ill health to appear, and if so, to attempt to relate them to treatments in second phase experiments (described below).
Tall grasses (mainly annual sorghum Sorghum spp., together with Mesosphaerum suaveolens at HD), soon overtopped the trees at GP and HD, and were slashed with a sickle mower during the wet season in the first year to reduce competition, and near the end of the wet season in years 1 and 2. Mowings were retained on site to maintain soil cover and nutrient capital (Cunningham 1963), and to settle to reduce the risk of dry season fires. Feral horses grazed the TW site, maintaining a low grass cover without disturbing the pines.
Heights of all net plot trees were measured 0.15, 0.55, 1.03, 1.54, 2.73 and 3.81 years after planting. Diameters at breast height (DBH, 1.3 m) were also measured at HD at 3.81 years. Foliar samples (10 fascicles of the most recent fully expanded needles from near the top of each net plot tree) were collected around 1.6 years, bulked for each plot and dried at 70°C, and ground to pass a 40 mesh (0.42 mm) sieve for chemical analysis. Samples were analysed for N (microKjeldahl method; Black 1965), P (perchloric acid digest (Chapman and Pratt 1961) by a molybdenum blue colorimetric method (Murphy and Riley 1962)), S (perchloric acid digest (Chapman and Pratt 1961) by a sorbitol turbidimetric method (Verma et al. 1977)) and K (atomic absorption spectroscopy (AAS) on perchloric acid digest). Needles and tips (newly expanded growth flushes on branches before needles had extended) were collected from all three sites around 2.7 and 3.7 years and analysed for N, P, K, S, Ca, Mg, Na, Fe, Mn, Zn, Cu, Al and B by inductively coupled plasma atomic emission spectroscopy (ICP-AES).
Two isolation rows were removed from the HD experiment at 3.7 years for access for a truck-mounted elevating platform (cherry picker) for foliar sampling. Fresh stem biomass (kg) was measured on harvested stems.
We used DBH to estimate diameter at ground level (DGL) (Eqn 1), then used DGL and height (H) to estimate volume as cones (Eqn 2) which was then correlated with stem fresh weight.
where DGL is diameter (m) at ground level, DBH is diameter (m) at 1.3 m, H = height (m) and Vc,GL (m3) is stem volume above ground level.
Based on results of correlations of Vc,GL with stem fresh weight (see Results), we used DBH to estimate stem volumes above 1.3 m as cones (Eqn 3).
where Vc,BH (m3) is stem volume above 1.3 m, DBH is diameter (m) at 1.3 m and H = height (m).
Volumes were summed for the plot and scaled to a per hectare basis, recognising that this ignored the stem below breast height.
Statistical analysis
Factorial analyses of variance were carried out using the statistical package GenStat (VSN International Inc.; https://vsni.co.uk/software/genstat), testing three levels each of N, P and S, the 27 treatments replicated twice and plots allocated randomly in each replication on the three sites in randomised complete block designs, resulting in 22 degrees of freedom for the residual term (Cochran and Cox 1957). Linear regression was used to test whether stem fresh biomass, a commercially important indicator of plantation yield, could be estimated from standard stem dimensions (height and DBH) as combined into Vc,BH.
Second phase experiments
The N, P and S experiments described above were terminated after the 3.81-year measurements. At that time, late in the dry season, termites were killing trees at GP, and trees had become unhealthy at all three sites with symptoms ranging from short needles to fasciation and stem tip die-back, similar to symptoms on other plantation species nearby (Rance et al. 2022). The incidence of affected trees was highest at TW and lowest at HD, although occasionally a tree or two appeared to be healthier than those surrounding. The experiments became test beds for other work.
M. darwiniensis termite activity was noted at GP at 0.94 years, many trees had died by a year later and few were expected to survive, effectively terminating the experiment. Areas with active termites were tagged, and the experiment became a site for termite studies (Paton and Miller 1980; Spragg and Paton 1980).
A bush fire jumped both fire breaks and the site was burnt, the experiment aged 5.52 years. At that stage, trees in the experiment had a near continuous canopy and only a light litter layer, so the fire burned through slowly, removing the litter layer, and only a few trees experienced crown scorch. Needle and tip samples were collected from each net plot tree and bulked for each plot at age 5.91 years, and were analysed for N, P, K, S, Mg, Ca, Na, Zn, Cu, B and Al by ICP-AES. Heights and DBH were measured, and the main treatments reapplied at the 2.88-year rate (Table 2). Each plot was then divided into four subplots of four trees in each plot corner. ZnSO4 (40 g ZnSO4 tree−1, 73.4 kg Zn ha−1) and CuSO4.5H2O (10 g CuSO4.5H2O tree−1, 15.5 kg Cu ha−1) was applied to two four-tree sub-plots in each plot in factorial format. Heights and DBH were measured at age 6.54 and 7.57 years, and DBH only at 8.79 years.
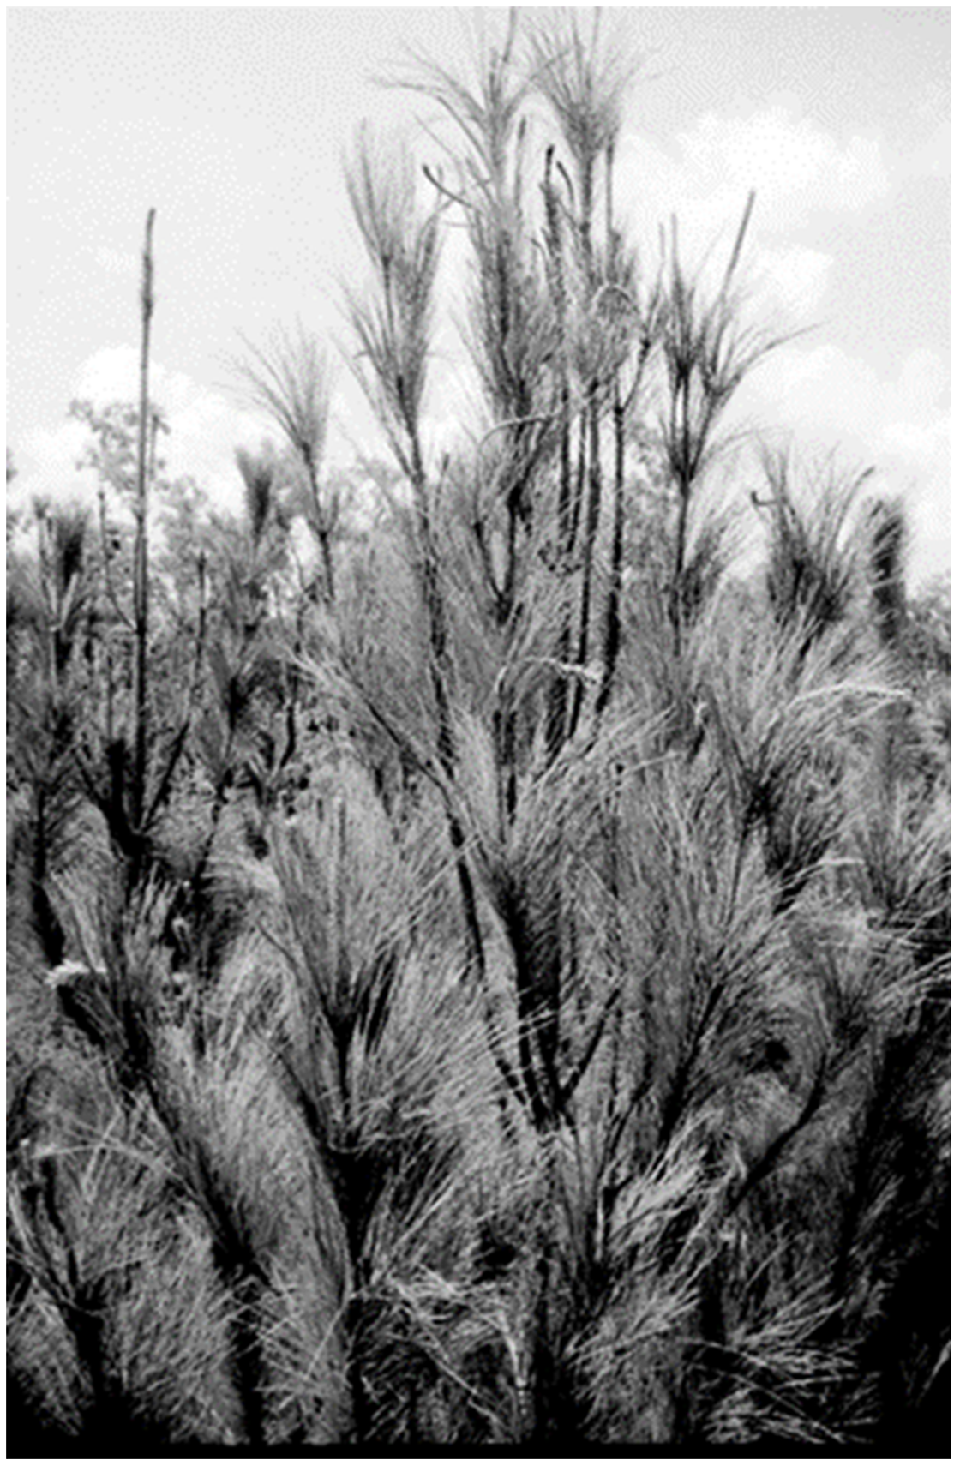
A patch of unhealthy trees, approximately a third of the experiment and extending across N, P and S treatments, was defined from healthier trees by a clear boundary, indicating consistent soil differences without obvious differences of soil colour or texture. Severely unhealthy trees had very short needles, commonly approximately 5 cm long, compared with 15–20 cm on healthy trees, some with no extended needles, premature needle fall, some with fasciation and dead tops (Fig. 1). Stunted tip growth hinted at Zn, Mn or B deficiency.
An unhealthy tree with a dead stem tip and multiple leaders, and uneven needle lengths at Three Ways, some with no extended needles. Photo: S. Rance.
KCl (28 g tree−1) was applied in a ring around two rows of trees in each net plot (2.91 years). Twelve matched trios, ranging from mildly unhealthy to very unhealthy, were selected and measured. One of each trio was sprayed to wet all needles with a commercial 9.8 g Zn chelate L−1 solution, a second matching set had 0.5 L of ZnSO4 solution (10 g ZnSO4 L−1, 9 kg Zn ha−1) applied to the soil surface in a ring around the trees, the third untreated.
At age 5.7 years (6.2 years after clearing the site for plantation establishment), soil cores of 4.8 cm internal diameter by 0–5 cm deep were collected along two transects, the first in the undisturbed native forest adjacent to the experiment, the second between trees along the diagonals of plots, starting in the healthier part of the experiment, through three plots in the badly affected area, and back into the healthier zone. Samples were taken at intervals between 1 and 2 m along the transects, spaced to minimise damage to tree roots. Ten samples were taken in the native forest, nine in the better part of the experiment and 19 among the severely affected trees. Exchangeable cations were leached with 1N NH4Cl (pH 7) solution, shaken and filtered, and cations (Ca, Mg, K, Na, and Mn) were determined by atomic absorption spectroscopy (AAS).
Results
Consistent changes in needle colour and length, crown size and stem diameter growth between treatments were noted, indicating interactions. Treatment effects were most apparent early in the dry season, until fast growing trees entered a dormant phase, allowing slower growing trees to catch up before they too entered a dormant phase, and treatment responses decreased by the end of the dry season. Competing weed growth declined as trees in the close-spaced plots approached canopy cover, and needle colour improved and growth appeared to become more vigorous. Diameters of newly expanded stem tip growth flushes varied from ~0.5 cm in poorer-performing plots to ~0.9 cm in the best-performing plots; subsequent increments were added to these, and trees in better-performing plots tended to have more branches.
At TW there were significant main effect growth responses to N and P applications (P < 0.001, Table 3), along with significant changes of N, P and S concentrations in needles. There was a small response to P or N singly, and a larger response to P + N, and these responses persisted (Fig. 2a). By 2.0 years, the best growth was on plots treated with N + P + S. By 2.3 years, early in the dry season, some trees, mostly in the better-performing plots, were showing signs of ill health.
| Height (m) | Needle (mg g−1) | ||||||||
|---|---|---|---|---|---|---|---|---|---|
| Age (years) | 0.4 | 0.9 | 1.4 | 2.6 | 3.7 | 1.5 | 2.7 | 3.7 | |
| N | |||||||||
| N0 | 0.03 | 0.12 | 0.29 | 1.03 | 1.98 | 6.49 | 5.90 | 6.54 | |
| N1 | 0.05 | 0.17 | 0.47 | 1.47 | 2.44 | 7.44 | 7.52 | 8.14 | |
| N2 | 0.06 | 0.18 | 0.52 | 1.60 | 2.57 | 7.96 | 8.18 | 9.45 | |
| *** | ** | *** | *** | *** | *** | *** | *** | ||
| P | |||||||||
| P0 | 0.04 | 0.12 | 0.31 | 1.10 | 2.05 | 0.45 | 0.48 | 0.64 | |
| P1 | 0.05 | 0.17 | 0.47 | 1.47 | 2.43 | 0.71 | 0.87 | 0.99 | |
| P2 | 0.05 | 0.18 | 0.49 | 1.53 | 2.51 | 0.76 | 0.90 | 1.02 | |
| ns | ** | *** | *** | *** | *** | *** | *** | ||
| S | |||||||||
| S0 | 0.04 | 0.14 | 0.39 | 1.28 | 2.24 | 0.82 | 0.48 | 0.60 | |
| S1 | 0.05 | 0.17 | 0.45 | 1.41 | 2.41 | 0.77 | 0.58 | 0.96 | |
| S2 | 0.04 | 0.16 | 0.44 | 1.41 | 2.34 | 0.84 | 0.60 | 0.94 | |
| ns | ns | ns | ns | ns | * | *** | * | ||
ns, not significantly different.
*P < 0.05; **P < 0.01; ***P < 0.001.
Effects of N, P and S factorial experiment on mean tree heights at (a) Three Ways to illustrate the N and P responses; (b) Humpty Doo; and (c) Gunn Point to illustrate the N × P × S interaction.
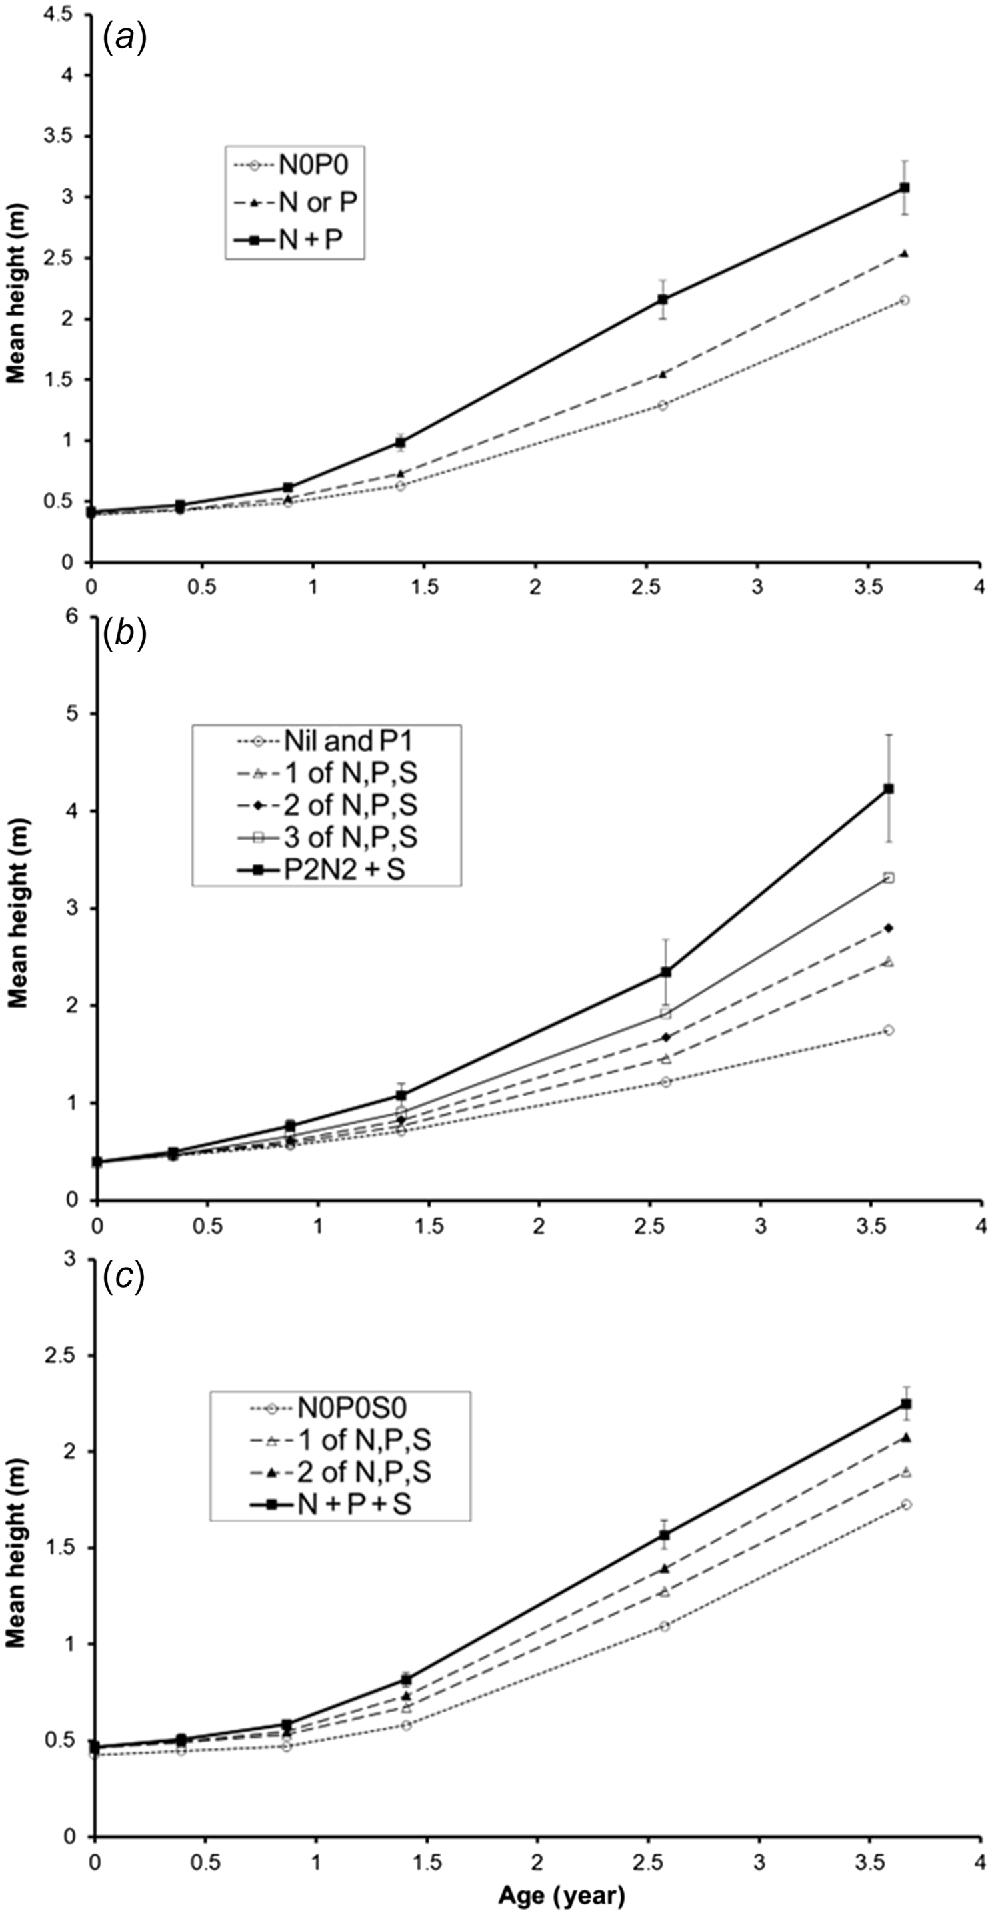
At HD, there were small responses to one of N, P or S by 0.87 years (P < 0.05, Table 4), but little response to higher applications. At later measurements, the response to P was not statistically significant, but P appeared to be necessary for healthy growth, and there were significant changes of N, P and S needle concentrations. At later measurements, heights were increased by applications of one of N, P or S, a larger response to two of N, P or S, a further increase to N + P + S excluding N2P2 treatments, and a further increase to the mean of N2P2S1 and N2P2S2 which were not significantly different (Fig. 2b).
| Height (m) | Needle (mg g−1) | ||||||||
|---|---|---|---|---|---|---|---|---|---|
| Age (years) | 0.3 | 0.9 | 1.4 | 2.6 | 3.67 | 1.6 | 2.7 | 3.6 | |
| N | |||||||||
| N0 | 0.06 | 0.2 | 0.37 | 1.09 | 2.04 | 6.98 | 7.46 | 5.96 | |
| N1 | 0.08 | 0.25 | 0.49 | 1.40 | 2.68 | 7.98 | 8.36 | 6.81 | |
| N2 | 0.08 | 0.26 | 0.50 | 1.48 | 2.86 | 7.89 | 8.27 | 7.29 | |
| * | * | ** | *** | *** | ** | ** | ** | ||
| P | |||||||||
| P0 | 0.07 | 0.21 | 0.41 | 1.21 | 2.35 | 0.59 | 0.67 | 0.57 | |
| P1 | 0.07 | 0.24 | 0.46 | 1.34 | 2.58 | 0.69 | 0.88 | 0.79 | |
| P2 | 0.08 | 0.26 | 0.49 | 1.42 | 2.65 | 0.79 | 0.98 | 0.94 | |
| ns | * | ns | ns | ns | *** | *** | *** | ||
| S | |||||||||
| S0 | 0.07 | 0.2 | 0.39 | 1.07 | 1.92 | 0.51 | 0.26 | 0.37 | |
| S1 | 0.08 | 0.25 | 0.48 | 1.49 | 2.81 | 0.60 | 0.37 | 0.71 | |
| S2 | 0.08 | 0.26 | 0.49 | 1.41 | 2.85 | 0.60 | 0.50 | 0.68 | |
| ns | * | * | *** | *** | *** | *** | *** | ||
ns, not significantly different.
*P < 0.05; **P < 0.01; ***P < 0.001.
At GP, the responses were similar to HD, but heights were only approximately half those at HD (Table 5, Fig. 2c). These responses were repeated at the 1.4-, 2.6- and 3.6–3.7-year measurements. The best height growth at all sites occurred with multiple nutrient additions.
| Height (m) | Needle (mg g−1) | |||||||
|---|---|---|---|---|---|---|---|---|
| Age (years) | 0.4 | 0.9 | 1.4 | 2.6 | 3.7 | 1.6 | 2.6 | |
| N | ||||||||
| N0 | 0.03 | 0.07 | 0.22 | 0.77 | 1.36 | 5.36 | 5.94 | |
| N1 | 0.04 | 0.10 | 0.30 | 0.94 | 1.69 | 6.50 | 6.88 | |
| N2 | 0.04 | 0.10 | 0.32 | 1.12 | 1.79 | 7.21 | 6.87 | |
| ** | * | *** | *** | *** | *** | *** | ||
| P | ||||||||
| P0 | 0.04 | 0.08 | 0.24 | 0.91 | 1.58 | 0.37 | 0.62 | |
| P1 | 0.03 | 0.09 | 0.29 | 0.91 | 1.60 | 0.57 | 1.13 | |
| P2 | 0.04 | 0.11 | 0.31 | 1.01 | 1.66 | 0.64 | 1.14 | |
| ns | * | * | * | * | *** | *** | ||
| S | ||||||||
| S0 | 0.03 | 0.07 | 0.24 | 0.85 | 1.55 | 0.42 | 0.49 | |
| S1 | 0.04 | 0.10 | 0.30 | 0.99 | 1.59 | 0.55 | 0.52 | |
| S2 | 0.04 | 0.10 | 0.29 | 0.99 | 1.70 | 0.53 | 0.51 | |
| ** | * | * | ** | ns | ** | ns | ||
ns, not significantly different.
*P < 0.05; **P < 0.01; ***P < 0.001.
When height increments from the three sites were combined, there were significant responses to N, P and S (Table 6). Most response was to the first application level, with usually negligible additional response from higher application rates. These responses were repeated at later measurements. Rearranging the data presented in Tables 3–5 showed the additive effects were substantial. The addition of one of the main treatments, N1P0S0 or N0P0S2 for instance, increased growth over the N0P0S0 treatment; two of the main treatments, N1P1S0 or N0P2S1 for instance greater again, and the mean of the 16 N + P + S plots much larger than N0P0S0 (Table 7). The general pattern was a response to P applications, mainly on N1or2 plots, a response to N on P1or2 plots but not on P0 plots, and a response to S on N + P plots. The addition of DBH measurements at HD at age 3.74 years to calculate a stem volume (Vc,BH) resulted in an increased spread between treatments (Table 7).
| Application level | Element | |||
|---|---|---|---|---|
| N*** | P*** | S*** | ||
| N0/P0/S0 | 0.289 | 0.316 | 0.316 | |
| N1/P1/S1 | 0.413 | 0.401 | 0.403 | |
| N2/P2/S2 | 0.411 | 0.411 | 0.404 | |
***P < 0.001.
| Three Ways | Humpty Doo | Gunn Point | HD Vc,BH | ||||||||
|---|---|---|---|---|---|---|---|---|---|---|---|
| Age (year) | 1.4 | 2.6 | 3.7 | 1.4 | 2.6 | 3.6 | 1.4 | 2.6 | 3.67 | 3.6 | |
| N0P0S0 | 0.29 | 1.03 | 1.98 | 0.30 | 0.81 | 1.37 | 0.18 | 0.62 | 1.25 | 0.49 | |
| 1 of N, P or S | 0.28 | 1.05 | 1.93 | 0.36 | 1.02 | 1.93 | 0.21 | 0.81 | 1.44 | 1.58 | |
| 2 of N, P or S | 0.46 | 1.44 | 2.49 | 0.44 | 1.31 | 2.46 | 0.27 | 0.93 | 1.62 | 3.52 | |
| N + P + S | 0.59 | 1.74 | 2.66 | 0.55 | 1.64 | 3.23 | 0.35 | 1.10 | 1.78 | 6.53 | |
| Best treatment | N2P2S2 | N2P2S2 | N2P1S1 | N2P2S2 | |||||||
By age 1.5 years after planting, some trees, usually on higher growth plots at TW and GP and becoming more frequent as the dry season progressed, were showing signs of ill health, a slight irregular shortening of needles near the growing tips of some trees. Later in the dry season, trees developed a tufted appearance, needles at the distal end of growth flushes were shorter than those at the proximal end or did not extend at all (Fig. 1). This did not seem to be related to treatments. By age 2.3 years, trees treated with N + P + S had the best needle colour and growth, but trees started to show signs of ill health on new growth at all three sites. By age 2.9 years, late in the dry season, most trees at GP and TW were affected, but at TW an irregular patch of trees, approximately a third of the experiment, had the condition more severely than those at GP, and the condition was present but less severe at HD. This was reflected in mean height increments, best growth at HD, worse growth overall at GP, and the worst growth on the affected patch at TW. Fast growing trees seemed to be more likely to have unhealthy growing tips than slower growing trees. For instance, at TW 28% of N0P0 trees had short needles (<5 cm), little different on N1or2P0 trees (33%), a little lower on N0P1or2 (21%), and higher on N + P trees (43%, P < 0.01).
Needle concentrations of N, P and S tended to respond in tandem with treatments (Tables 3–5), and for the most part concentrations of Ca, Mg, Na, Fe, Mn, Cu, B, and Al were not significantly affected by treatments. At 2.6–2.7 years, mean foliar Zn concentration at TW was 4.6 μg g−1, (3.4 μg g−1 in the poor patch and 5.2 μg g−1 in the better parts), 4.1 μg g−1 at HD and 3.3 μg g−1 at GP (Table 8). Mean needle Al concentration at GP at 3.71 years was 314 μg g−1, a little higher at HD and increased by P applications (P0 431.8 μg g−1, P1 482.8, P2 481.3, P < 0.01), and an N × P interaction at TW (N0 and P0 434 μg g−1, N + P 505 μg g−1, P < 0.05).
| Three Ways | Humpty Doo | Gunn Pt | HD Tips | |||||
|---|---|---|---|---|---|---|---|---|
| Age (year) | 2.73 | 3.71 | 2.70 | 3.64 | 6.02 | 2.64 | 6.02 | |
| Zn | 4.64 | 4.33 | 4.13 | 4.68 | 5.79 | 3.34 | 7.32 | |
| B | na | 17.2 | 16.5 | 15.7 | 35.7 | 14.8 | 38.7 | |
| Cu | 2.26 | 2.43 | 2.27 | 4.22 | 1.52 | 2.14 | 2.15 | |
| Mn | na | 184 | 216 | 271 | 272 | 55 | 129 | |
| Al | 475 | 464 | 388 | 410 | 357 | 314 | 178 | |
na, not analysed.
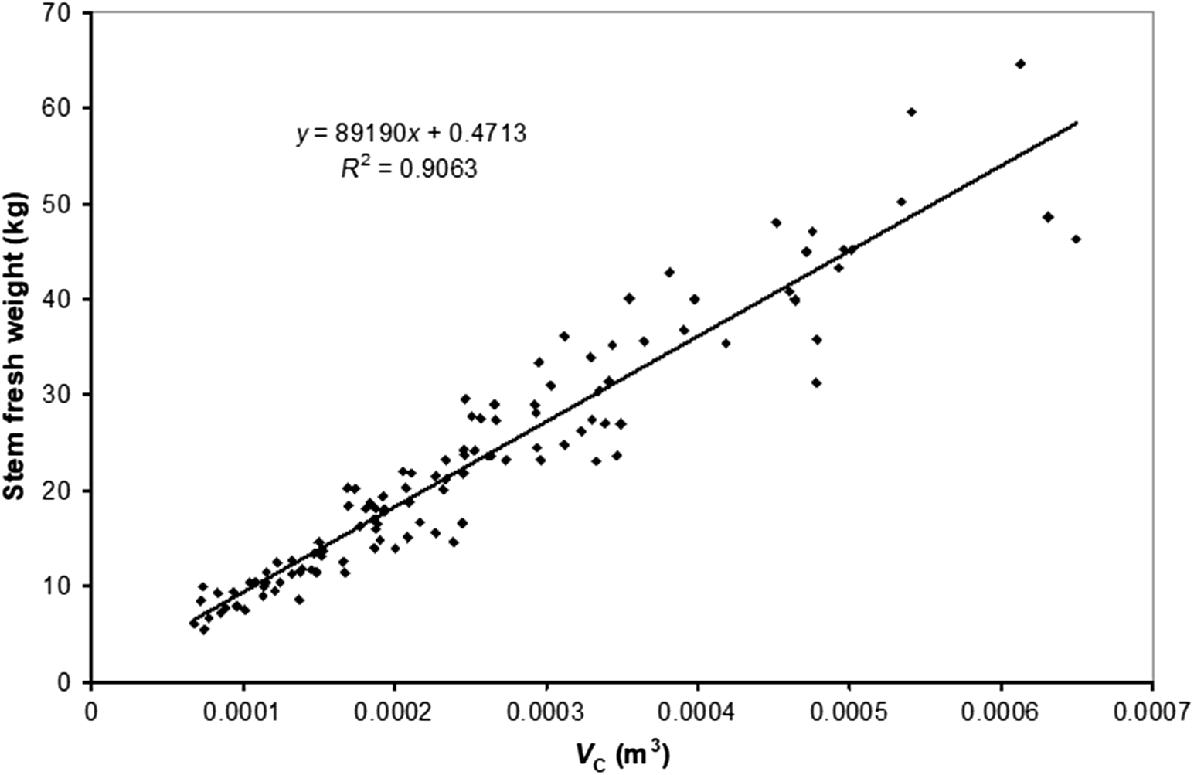
There was a significant relationship between stem volume (Vc,GL) and stem biomass for trees more than 5 m tall (R2 = 0.91, Fig. 3), but the relationship was not precise enough to discriminate between treatments due to variable stem taper, particularly at the base.
Stem fresh biomass estimated by the conical stem volume (Vc,GL) model for trees taller than 5 m.
Second phase experiments
After fire had removed the litter layer at the start of the second phase experiments at HD, interrupting nutrient cycling, responses to factorial N, P and S treatments remained similar to the first phase (Supplementary Tables S1 and S2). The effect of S1 applications was perhaps more pronounced, but with little further growth to S2. The additive effects of the main treatments were substantial.
Responses to K applications at TW increased foliar K concentrations (K0 = 2.5 mg/g, K1 3.2 mg/g, P < 0.001), but there was no significant height increase. Unhealthy trees with Zn chelate sprayed onto the needles improved rapidly in visual health, but there was no apparent response to 9 kg Zn ha−1 applied to the soil surface around the trees within 1 year. Height increments after soil-surface Zn and Cu was applied at HD at 5.91 years were not significantly different by age 6.54 years, but diameter increments were increased by Zn applications (P < 0.01; Table 9), and the response persisted. By age 7.57 years, some trees were over 12 m tall. When expressed as Vc,BH increments from 5.91 to 7.57 years, Zn applications tended to suppress growth on N0P0S0 treatment, had little consistent effect on combinations with one or two of the main treatments, and increased growth in N + P + S combinations (Table 9). There was no significant growth response to Cu applications.
| (A) Zn effects on height and DBH increment | ||||||
|---|---|---|---|---|---|---|
| Height increment (m) | DBH increment (cm) | |||||
| Age (year) | 6.54 | 7.57 | 6.54 | 7.57 | 8.79 | |
| Zn0 | 0.52 | 1.70 | 0.50 | 1.55 | 2.70 | |
| Zn1 | 0.55 | 1.80 | 0.58 | 1.77 | 3.03 | |
| ns | ns | ** | ** | *** | ||
| (B) Zn and Cu effects on mean Vc,BH (m3) from 5.91 to 7.57 years | |||||
|---|---|---|---|---|---|
| Zn0Cu0 | Zn0Cu1 | Zn1Cu0 | Zn1Cu1 | ||
| N0P0S0 | 0.0055 | 0.0055 | 0.0048 | 0.0048 | |
| 1 of N, P or S | 0.0060 | 0.0062 | 0.0085 | 0.0077 | |
| 2 of N, P or S | 0.0078 | 0.0088 | 0.0086 | 0.0073 | |
| N + P + S | 0.0104 | 0.0089 | 0.0121 | 0.0116 | |
ns, not significantly different.
**P < 0.01; ***P < 0.001.
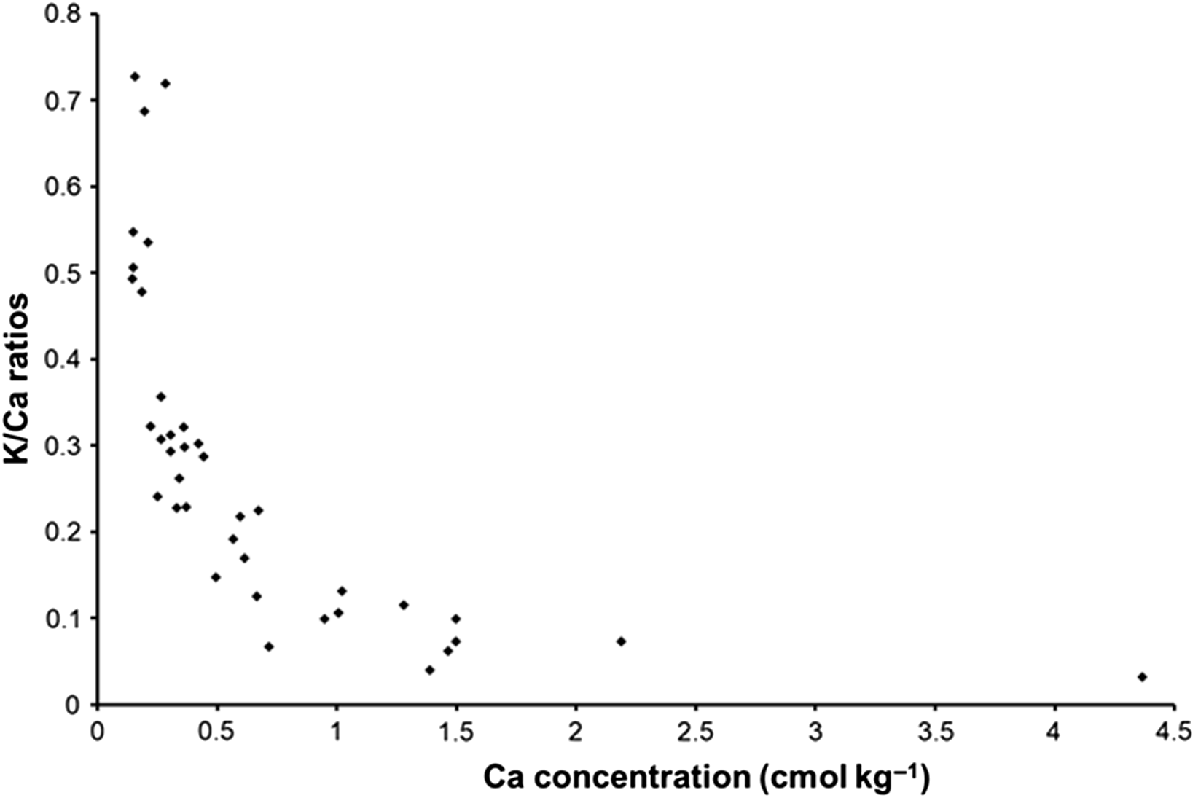
A striking feature of exchangeable cation concentration measurement at TW was the wide range of values over short distances. Soil samples a metre apart had very different cation profiles, both in absolute concentrations and in ratios between cations (Table 10). Concentrations of cations along the transects were examined in relation to land preparation, fertiliser treatment, and tree growth and health. Variation of Ca and Na concentration along the transects was only partly related to applied treatments in plots (S was applied as CaSO4 and P as NaH2PO4.2H2O). Mean exchangeable Mg concentrations were significantly lower on the cleared (now plantation) site than those on the undisturbed forest (P < 0.001), and mean concentrations of Ca, Na and the total of the five concentrations in the poor patch were significantly lower than the undisturbed forest soil (P < 0.01). Mean K and Mn concentrations were not significantly different. High Ca concentrations were associated with low K/Ca ratios, and low Ca concentrations with high K/Ca ratios (Fig. 4).
| Poor-performing plantation soil | Better-performing plantation soil | Undisturbed native forest | |||||
|---|---|---|---|---|---|---|---|
| Mean | Range | Mean | Range | Mean | Range | ||
| Ca | 0.340 | (0.144–1.023) | 1.094 | (0.148–2.187) | 1.041 | (0.343–4.363) | |
| Mg | 0.448 | (0.114–1.003) | 0.263 | (0.114–0.396) | 1.219 | (0.227–1.794) | |
| Mn | 0.018 | (0.005–0.048) | 0.020 | (0.006–0.059) | 0.021 | (0.006–0.046) | |
| K | 0.102 | (0.060–0.205) | 0.098 | (0.048–0.159) | 0.117 | (0.090–1.151) | |
| Na | 0.069 | (0.030–0.114) | 0.093 | (0.062–0.161) | 0.109 | (0.046–0.166) | |
| Total | 0.976 | (0.461–2.226) | 1.568 | (0.513–2.948) | 2.507 | (0.697–6.100) | |
Discussion
N, P and S fertilisation
The combined primary growth response was to P, N and S, and probably in that order, the best growth on N + P + S treatments. The main responses were consistent with other work in the Northern Territory (Cameron et al. 1981, 1982; Rance et al. 1982, 1983), and with preliminary glasshouse experiments (Rance et al., 2020). Indeed, multiple element responses are common across a variety of savanna and grassland ecosystems (Devi Kanniah et al. 2010; Fay et al. 2015), indicating that these responses were widespread. Growth in the field experiments was poorest at GP, yet best in the glasshouse on GP soil where it was not water stressed.
Despite positive growth responses to all main experimental treatments, the emergence of symptoms of ill health, most prominently on better-performing trees, provided strong evidence of further nutrient limitation. Symptoms of ill health started to appear near the tops of stems as the second dry season progressed; indicating uptake of a key element(s) was restricted in the drying soil profile, as was translocation from old growth to new. Accordingly, foliar sampling was standardised to the youngest fully expanded needles near the top of the tree, and newly extended growth flushes (branch tips) before needle extension/formation, collected near the end of the dry season when trees were stressed and conditions stable. Mean height increments increased in response to fertiliser applications when needle N concentrations were less than approximately 7 mg g−1 (Tables 3–5), and when P and S concentrations were less than approximately 0.6 mg g−1. In most cases, the best growth was on the N2P2S2 treatment, although other N + P + S treatments were often not significantly different (Table 7) and could have been more economical.
It was standard practice to measure tree heights to 6 m and DBH on trees >6 m tall as it was anticipated that the two would be correlated, but height appeared to be the least sensitive parameter to examine treatment effects. Weed competition restricted height growth in the first year, and branch growth and the proportion of foxtails (trees with few or no branches) appeared to partly reflect treatment effects and branching affected stem taper. Diameters could be combined with heights for an estimation of stem volume. A diameter low in the stem but above the butt swell would appear the most appropriate. This raised a question of where and when to standardise diameter measurement of plantation P. caribaea trees to assess growth responses as early as possible in the life of a research program, and the associated question about normalising diameters measured at different heights (Rance et al. 2011). A less than threefold increase in height at 3.58 years at HD represented a 13-fold increase in Vc,BH (Table 9), recognising that Vc,BH ignored the stem below 1.3 m.
Addressing causes of tree ill health
Termites (M. darwiniensis) became more numerous and active after clearing (Fox and Clarke 1972), and Mirex baits eliminated an estimated 200 kg of termites in each colony at GP, with minimal exposure to predator species such as ants or aboveground species. A colony at HD at 6.66 years hinted at borderline soil conditions for termites to establish colonies, possibly related to soil pH (Table 1). In the glasshouse, applications of N + P increased growth of P. caribaea var. hondurensis on soil with pH >5.2, but not at lower pH (Rance et al. 2020). The two sites initially free of termites, TW and HD, had surface soil pH ~5.2 (Table 1), while the two with active termites, GP and Howard Springs (Cameron et al. 1981), had soil pH >5.4. This is the range where some elements become more or less available in soil solution, Al more soluble, perhaps to concentrations toxic to the soil microbiome and the gut fauna of termites. Whatever the factors limiting termite occurrence, the risk that fertilisation to improve plantation tree performance may also enhance termite activity needs investigation. Mirex is too toxic to be used as a routine insecticide and termites have an important role in nutrient cycling.
Most of the minor and trace elements analysed were within or near ranges associated with healthy growth (Mengel and Kirkby 1982). Fewer trees at HD displayed acute symptoms of ill health like dead tops and fasciation than TW and GP, indicating that conditions were closer to a critical value. Stunted tip growth was consistent with the observation that concentrations of Zn in the new growth of Zn-deficient Pinus radiata were lower than older foliage and that Zn is relatively immobile (McGrath and Robson 1984). Stunted growth, short needles, yellowing and stem tip death are also consistent with Al toxicity in some species (Foy et al. 1978), and soil pH at the three sites was in the range where changes in pH could influence Al solubility. The sites free of termites, TW and HD, also had the lowest soil pH (Table 1) and highest foliar Al concentrations (Table 8). NaH2PO4.2H2O applications on these soils increased soil pH in the glasshouse, and NH4NO3 and CaSO4 applications reduced pH (Rance et al. 2020), so part of the growth responses could have been related to changes in pH and Al availability.
As a guide, most agricultural species with foliar Zn concentrations of 16–20 μg g−1 were likely to respond to Zn fertiliser applications, those with concentrations of 15 μg g−1 or less were probably Zn deficient (Loneragan et al. 1979; Mengel and Kirkby 1982). Foliar concentrations of Zn less than 10 μg g−1 (Table 8) were consistent with a likely Zn deficiency at all three sites. Needle Zn concentrations in P. caribaea above ~6–7 μg g−1 were associated with short needles and abnormal stem tip growth but trees still maintained reasonable growth; those <4 μg g−1 were less healthy. Foliar applications of Zn chelate at TW improved the appearance and increased growth within weeks of application, confirming a Zn response (Rance et al. 1982). However, the foliar spray resulted in a negligible change in needle Zn concentrations, indicating the response would be transient, but there seemed to be little uptake from 9 kg ZnSO4 ha−1 applied to the soil surface at TW by the following year. This application rate was commonly used in agriculture, so the application rate on the second phase experiment at HD was increased to 73.4 kg ZnSO4 ha−1. This returned a small mean diameter increment increase (P < 0.01) within 0.63 years (Table 9), a larger response a year later. A more careful examination indicated Vc,BH increments were only increased with Zn in N + P + S treatments. In the second year, increments were reduced by 10% in N0P0S0 treatments, increased in N + P + S treatments, intermediate or inconsistent in treatments with one or two of N, P or S. Zn applications at HD indicated that the response was delayed and secondary to other responses. The role of P fertilisation in inducing or enhancing symptoms of Zn deficiency by depressing Zn absorption or diluting available Zn supplies in greater growth (Loneragan et al. 1979), also need to be considered.
A study of grassland sites across six continents identified nutrients other than N and P that were important for plant production, Zn and Fe well represented (Radujković et al. 2021). Unlike other countries, Australia does not appear to have a widespread response to Fe, perhaps related to the lack of large herds of herbivores migrating with the seasons, exporting Fe from the grasslands in haemoglobin and myoglobin. In the short term, foliar sprays seem the most efficient method of Zn application, until nutrient cycling through litterfall is re-established.
The transect soil sampling at TW indicated that clearing and root raking the sites before the trees were planted removed nutrient capital in the tree and shrub fraction off-site, concentrating it in windrows, interrupting internal nutrient cycling from old growth to new, nutrient cycling through litter fall, and exposed surface soil to erosion and further nutrient loss (Leuning et al. 1991; Saur et al. 2000; O’Connell et al. 2004). Site preparation and tree harvesting were recognised as the major mode of nutrient removal from the plantation system (Mendham et al. 2003; O’Connell et al. 2004). A significant reduction of soil Mg concentration (Table 10), and probably in chlorophyll in foliage, indicated a likely response to Mg fertilisation in later years. Clearing trees and shrubs without burning and with minimum soil disturbance, leaving the litter/soil exposed to full sun, removed litter fall from the growth cycle (Cunningham 1963). Unshaded soil experienced higher day temperatures and lower moisture contents, reduced organic C, organic P and total N concentrations, lowered cation exchange capacity, exchangeable K and soil pH within 3 years compared with shaded soil (Cunningham 1963). Shaded soil also contained more N fixing and nitrifying bacteria than exposed soil. Litter removal reduced soil moisture content down to 90 cm and increased water stress in longleaf pine (Ginter et al. 1979), and interrupted nutrient cycling (Stocker 1981; West 1984). Further, repeated harvest residue removal reduced productivity of E. globulus plantations (O’Connell et al. 2003; Mendham et al. 2014).
The variability of cation concentrations across the site must be considered for any soil sampling strategy to assess nutrient stocks for site description (e.g. Table 1), assessing tree performance to experiment treatments and determining optimal fertilisation rates and composition. The mean of the five highest readings of Ca concentration in the poor patch was 0.606 cmol.kg−1 soil (Table 10), and had no overlap with the mean of the five lowest readings (0.169). The sum of the five measured exchangeable cations (Ca, Mg, Mn, K and Na) represented approximately 40% of the cation exchange capacity in the native forest, 31% in the better-performing parts of the experiment and 20% in the poor-performing patch.
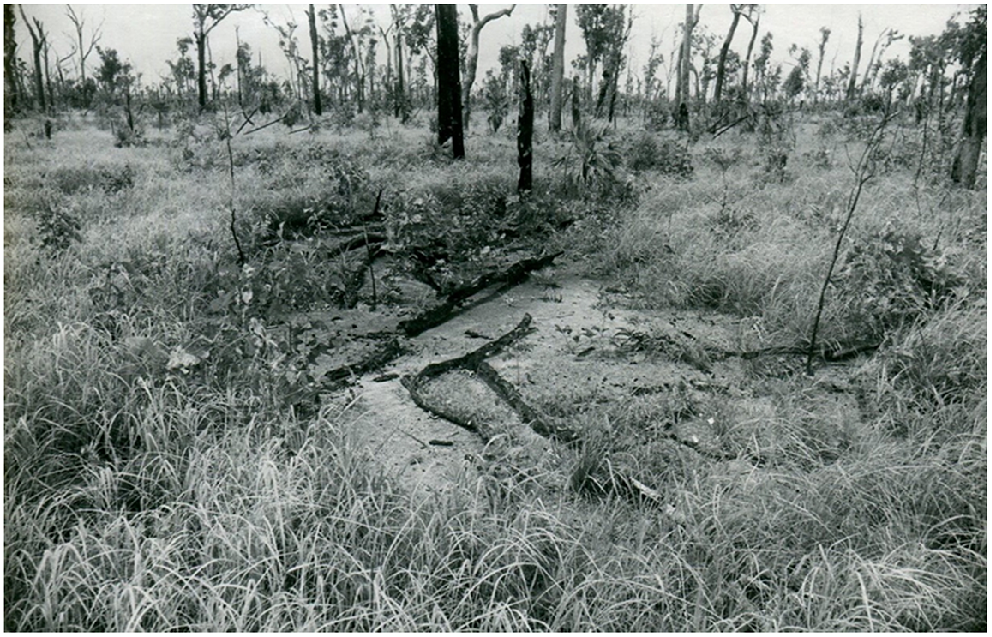
Large variation of soil conditions over small spatial scales has been attributed to historical processes affecting soil development (Phillips and Marion 2004). In our study, the substantial variation in cations at small scales might be echoes of past events such as ash beds from burning large structures like tree stems (Fig. 5), or foraging ants or grass-eating termites concentrating nutrients at nest sites. The K/Ca ratios (Fig. 4) are consistent with a long history of recurrent fires. K is volatilised at 779°C and Zn at 907°C (Latimer and Hildebrand 1956), temperatures experienced in burning wood and likely to be lost to the atmosphere, while Ca is volatilised at 1482°C, so likely to remain in ash beds. In these experiments, most of the wood and crowns in the windrows containing a significant proportion of the site nutrient capital burned during the first 2 days, but some smouldered for more than a week. Much of the site N, P, S, K and Zn, and possibly B nutrient capital would have been volatilised in high-temperature combustion in the first 2 days or lost in the smoke fraction when the windrow smouldered (Raison et al. 1985; Cook 1994; Alves et al. 2011; Pereira et al. 2011; Radujković et al. 2021), leaving refractory cations of Al, Fe, Ca and Mn in the ash bed on the exposed soil surface where they could be washed downhill or down the profile during high-intensity storms in the build-up to the wet season.
Conclusion
The close spacing in these experiments reduced the stands to a near monoculture and revealed the main treatment responses but exposed faster growing trees to environmental stresses. Establishing new crops in savanna regions of northern Australia, including exotic plantation species, are likely to need broad-spectrum fertilising and protection from fire, especially in the establishment phase. Nutrient additions will need to encompass minor and trace elements in addition to N, P and S, specifically Zn, and consider the mechanism of application. Fertiliser application rates will need to be low to minimise induced nutrient deficiencies and site run off, and consider small-scale variation in cation exchange capacity and composition. Changes of soil pH or increased risks of insect attack also need to be considered.
Acknowledgements
We acknowledge the Tiwi and Larrakia traditional owners of country where this work was conducted and their continuing connection to land, sea and community. We pay our respects to them and their cultures and to their elders both past, present and emerging. The close-spaced planting in these experiments was modelled on nutritional research on tropical pines by B.N. Richards in Queensland and by H.D. Waring working with Pinus radiata. We thank Doug Johnson as a link with the Research Advisory Committee for refining the treatments, George Petru who provided templates for statistical analysis using a desktop adding machine, and field staff of the Forest Research Institute, in particular G. Milne, J. Cusack, M. Farmer and P. Lukitsch for weed control, measuring and fertilising, and J. Maggs and C. Martin for laboratory analyses.
References
Alves C, Vicente A, Nunes T, et al. (2011) Summer 2009 wildfires in Portugal: emission of trace gases and aerosol composition. Atmospheric Environment 45, 641-649.
| Google Scholar |
Cameron DM, Rance SJ, Williams ER (1981) Fertilizer responses of Pinus caribaea var. hondurensis on a tropical red earth. Australian Forest Research 11, 35-45.
| Google Scholar |
Cameron DM, Rance SJ, Williams ER (1982) Effects of fertilizers on growth, form and concentration of nutrient in the needles of Pinus caribaea var. hondurensis in the Northern Territory. Australian Forest Research 12, 105-119.
| Google Scholar |
Cook GD (1994) The fate of nutrients during fires in a tropical savanna. Australian Journal of Ecology 19, 359-365.
| Crossref | Google Scholar |
Craciun G (1978) Pinus caribaea provenance testing in the Northern Territory of Australia. Commonwealth Forestry Review 57, 290-292.
| Google Scholar |
Cunningham RK (1963) The effect of clearing a tropical forest soil. Journal of Soil Science 14, 334-345.
| Crossref | Google Scholar |
Devi Kanniah K, Beringer J, Hutley LB (2010) The comparative role of key environmental factors in determining savanna productivity and carbon fluxes: a review, with special reference to northern Australia. Progress in Physical Geography: Earth and Environment 34, 459-490.
| Crossref | Google Scholar |
Fay PA, Prober SM, Harpole WS, et al. (2015) Grassland productivity limited by multiple nutrients. Nature Plants 1, 15080.
| Crossref | Google Scholar |
Fox RE, Clarke NB (1972) The incidence of termites in eucalypts in the Darwin area. Australian Forest Research 5, 29-36.
| Google Scholar |
Foy CD, Chaney RL, White MC (1978) The physiology of metal toxicity in plants. Annual Review of Plant Physiology 29, 511-566.
| Crossref | Google Scholar |
Ginter DL, McLeod KW, Sherrod C, Jr (1979) Water stress in longleaf pine induced by litter removal. Forest Ecology and Management 2, 13-20.
| Crossref | Google Scholar |
Kanowski PJ (1997) Afforestation and plantation forestry. Working Paper No. 6. (Australian National University, Resource Management in Asia-Pacific (RMAP) Program: Canberra) Available at http://hdl.handle.net/1885/40084
Leuning R, Cromer RN, Rance S (1991) Spatial distributions of foliar nitrogen and phosphorus in crowns of Eucalyptus grandis. Oecologia 88, 504-510.
| Crossref | Google Scholar | PubMed |
Loneragan JF, Grove TS, Robson AD, Snowball K (1979) Phosphorus toxicity as a factor in zinc-phosphorus interactions in plants. Soil Science Society of America Journal 43, 966-972.
| Crossref | Google Scholar |
McGrath JF, Robson AD (1984) The influence of zinc supply to seedlings of Pinus radiata D. Don on the internal transport of recently absorbed zinc. Australian Journal of Plant Physiology 11, 165-178.
| Crossref | Google Scholar |
Mendham DS, O’Connell AM, Grove TS, Rance SJ (2003) Residue management effects on soil carbon and nutrient contents and growth of second rotation eucalypts. Forest Ecology and Management 181, 357-372.
| Crossref | Google Scholar |
Mendham DS, Ogden GN, Short T, O’Connell TM, Grove TS, Rance SJ (2014) Repeated harvest residue removal reduces E. globulus productivity in the 3rd rotation in south-western Australia. Forest Ecology and Management 329, 279-286.
| Crossref | Google Scholar |
Murphy J, Riley JP (1962) A modified single solution method for the determination of phosphate in natural waters. Analytica Chimica Acta 27, 31-36.
| Crossref | Google Scholar |
O’Connell AM, Grove TS, Mendham DS, Rance SJ (2003) Changes in soil N status and N supply rates in agricultural land afforested with eucalypts in south-western Australia. Soil Biology and Biochemistry 35, 1527-1536.
| Google Scholar |
O’Connell AM, Grove TS, Mendham DS, Rance SJ (2004) Impact of harvest residue management on soil nitrogen dynamics in Eucalyptus globulus plantations in South Western Australia. Soil Biology and Biochemistry 36, 39-48.
| Crossref | Google Scholar |
Orians GH, Milewski AV (2007) Ecology of Australia: the effects of nutrient-poor soils and intense fires. Biological Reviews 82, 393-423.
| Crossref | Google Scholar | PubMed |
Paton R, Miller LR (1980) Control of Mastotermes darwiniensis Froggat (Isoptera: Mastotermitidae) with Mirex baits. Australian Forest Research 10, 249-258.
| Google Scholar |
Pellegrini AFA (2016) Nutrient limitation in tropical savannas across multiple scales and mechanisms. Ecology 97, 313-324.
| Crossref | Google Scholar | PubMed |
Pereira P, Úbeda X, Martin D, Mataix-Solera J, Guerrero C (2011) Effects of a low severity prescribed fire on water-soluble elements in ash from a cork oak (Quercus suber) forest located in the northeast of the Iberian Peninsula. Environmental Research 111, 237-247.
| Crossref | Google Scholar | PubMed |
Phillips JD, Marion DA (2004) Pedological memory in forest soil development. Forest Ecology and Management 188, 363-380.
| Crossref | Google Scholar |
Radujković D, Verbruggen E, Seabloom EW, et al. (2021) Soil properties as key predictors of global grassland production: have we overlooked micronutrients? Ecology Letters 24, 2713-2725.
| Crossref | Google Scholar | PubMed |
Raison RJ, Khanna PK, Woods PV (1985) Mechanisms of element transfer to the atmosphere during vegetation fires. Canadian Journal of Forest Research 15, 132-140.
| Crossref | Google Scholar |
Rance SJ, Cameron DM, Williams ER (1982) Correction of crown disorders of Pinus caribaea var. hondurensis by application of zinc. Plant and Soil 65, 293-296.
| Crossref | Google Scholar |
Rance SJ, Cameron DM, Williams ER (1983) Nutritional requirements and interactions of Khaya senegalensis on tropical red and yellow earths. Communications in Soil Science and Plant Analysis 14, 167-183.
| Crossref | Google Scholar |
Rance SJ, Mendham DS, Cameron DM, Grove TS (2011) An evaluation of the conical approximation as a generic model for estimating stem volume, biomass and nutrient content in young Eucalyptus plantations. New Forests 43, 109-128.
| Crossref | Google Scholar |
Rance SJ, Cameron DM, Gosper CR, Williams ER (2020) Multiple soil element and pH interactions constrain plant performance on tropical soils with a long history of fire. Soil Research 58, 335-345.
| Crossref | Google Scholar |
Rance SJ, Cameron DM, Gosper CR, Williams ER (2022) Plantation tree growth responses to P, N, K and minor and trace elements on low fertility savanna soils. Soil Research 61, 255-266.
| Crossref | Google Scholar |
Saur E, Nambiar EKS, Fife DN (2000) Foliar nutrient retranslocation in Eucalyptus globulus. Tree Physiology 20, 1105-1112.
| Crossref | Google Scholar | PubMed |
Spragg WT, Paton R (1980) Tracing, trophallaxis and population measurement of colonies of subterranean termites (Isoptera) using a radioactive tracer. Annals of the Entomological Society of America 73, 708-714.
| Crossref | Google Scholar |
Stocker GC (1969) Fertility differences between the surface soils of monsoon and eucalypt forests in the Northern Territory. Australian Forest Research 4, 31-38.
| Google Scholar |
Stocker GC (1981) Regeneration of a north Queensland rain forest following felling and burning. Biotropica 13, 86-92.
| Crossref | Google Scholar |
Verma BC, Swaminathan K, Sud KC (1977) An improved turbidimetric procedure for the determination of sulphate in plants and soils. Talanta 24, 49-50.
| Crossref | Google Scholar | PubMed |
Walkley A, Black IA (1934) An examination of the Degtjareff method for determining soil organic matter, and a proposed modification of the chromic acid titration method. Soil Science 37, 29-38.
| Crossref | Google Scholar |
West PW (1984) Inter-tree competition and small-scale pattern in monoculture of Eucalyptus obliqua L’Herit. Australian Journal of Ecology 9, 405-411.
| Crossref | Google Scholar |
Winter WH, Jones RK (1977) Nutrient responses on a yellow earth soil in northern Cape York Peninsula. Tropical Grasslands 11, 247-255.
| Google Scholar |