

Effects of biobased fertilisers on soil physical, chemical and biological indicators – a one-year incubation study
Lærke Wester-Larsen A , Lars Stoumann Jensen A , Johannes Lund Jensen B C and Dorette Sophie Müller-Stöver A *
A
B
C
Abstract
Soil quality is declining in Europe and globally due to agricultural practices and climate change. The European market for novel biobased fertilisers (BBFs) is growing and the new European Union fertiliser regulation promotes their use. However, knowledge about the effects of many novel BBFs on soil quality is currently very limited. In a one-year laboratory incubation experiment, this study aimed to test the effect on biological (microbial biomass carbon (C)), physical (clay dispersibility and water-holding capacity) and chemical (pH, cation exchange capacity (CEC), total C and C in soil size fractions (<250, 50–250 and >50 μm)) soil quality indicators of 10 BBFs applied at two different rates on two soil types: an Arenosol and a Luvisol. The set-up also included a soil that was subjected to long-term annual application of the compost used in the incubation. The application of BBFs generally improved soil quality, with the compost material improving soil quality most, followed by a plant-based fertiliser and a biogas digestate. The effect of BBF application on CEC, total C and particulate organic matter (POM) was related to the amount of total C added with the BBF. Furthermore, the effect on total C and POM fractions was also related to easily decomposable C added with the BBF. Comparing the single accelerated application with annual application under field conditions indicated that the long-term incubation trial is a reasonable predictor of compost long-term effects in the field. Whether this applies to BBFs with very different properties remains to be shown.
Keywords: carbon size fractions, cation exchange capacity, clay dispersibility, microbial biomass, pH, soil organic matter, total carbon, water-holding capacity.
Highlights
This laboratory study investigated the effects of novel biobased fertilisers on soil quality indicators.
Overall, the application of biobased fertilisers improved soil quality.
Compost improved soil quality most, followed by a plant-based fertiliser and a biogas digestate.
The amount of total and easily degradable carbon added was only related to some positive effects.
Some but not all effects of long-term field application of compost could be predicted in the laboratory.
Introduction
The main focus of European farmers is on primary crop productivity (Schröder et al. 2020) and economic profitability. However, soil also provides a range of highly important services, such as regulating climate, water and air quality and supporting biodiversity (Schröder et al. 2020). The provision of these services depends on the soil’s ability to perform its functions. Soil functions can be linked to soil quality, which is defined by Karlen et al. (1997) as ‘the capacity of a specific kind of soil to function, within natural or managed ecosystem boundaries, to sustain plant and animal productivity, maintain or enhance water and air quality, and support human health and habitation’. Soil quality indicators can be divided into three groups: biological, physical and chemical (Bünemann et al. 2018).
Despite the decline in soil quality in the European Union (EU) (Stolte et al. 2015), European farmers do not invest in improving soil quality because they perceive it to be more costly than technological measures, such as deeper tillage, artificial drainage or increased irrigation, that are implemented to compensate for the effects of soil quality degradation (Schröder et al. 2020). However, soil quality is likely to become even more important in the future due to climate and environmental change. Soil structural stability and water-holding capacity (WHC) may become crucial in future climates experiencing more frequent weather extremes, such as droughts and heavy rainfall (Allan and Soden 2008). In addition, there is an increasing focus on the ability of soils to store carbon (C) and thus mitigate climate change (Moinet et al. 2023).
Soil quality is strongly linked to soil organic matter (SOM) (Amundson et al. 2015). The decline in SOM has been identified as one of the main threats to soil quality in the EU and globally (Amundson et al. 2015; Stolte et al. 2015; EC 2021). The problem of SOM loss from agricultural soils is likely to increase in future as climate change leads to higher soil temperatures, accelerating SOM decomposition by microbes (Ofiti et al. 2021). This, in turn, will lead to increased soil degradation and hasten climate change through C emissions to the atmosphere, forming a feedback loop. Microbes are the main drivers of organic matter (OM) decomposition, and microbial activity is affected by the availability of OM added to soil (Bardgett 2005). Therefore, the microbial biomass will increase following the addition of OM to soil. The addition and decomposition of OM has also been shown to improve soil structure and thus water, oxygen and nutrient availability (Allan and Soden 2008). Moreover, increased SOM could counteract the predicted increase in drought stress caused by climate change (IPCC 2022) by boosting the plant-available water capacity (Jensen et al. 2020). In addition, OM contributes to the soil cation exchange capacity (CEC) (Martinez et al. 2008).
Biobased fertilisers (BBFs) were defined by Wester-Larsen et al. (2022) as ‘materials or products derived from biomaterials (plant, animal or microbial origin, often wastes, residues or side-streams from agriculture, industry or society) with a content of bioavailable plant nutrients suitable to serve as a fertiliser for crops’. Novel BBFs were further defined in Wester-Larsen et al. (2022) as ‘a BBF produced by processes beyond simple biogas digestion of animal manures and simple composting. The processes involved in producing novel BBFs can e.g. be drying, pelletising or mineral extraction’. Biobased fertilisers often contain OM, and as soil quality is related to OM input to the soil, BBFs can be expected to enhance soil quality. However, BBFs may vary greatly in properties, e.g. C:nitrogen (N) ratio and OM degradability, which can be expected to affect soil quality differently. The use of BBFs and organic amendments has also been shown to improve soil quality in long-term field experiments (Zavattaro et al. 2015; Domingo-Olivé et al. 2016; Sandén et al. 2018). However, previous studies focused on less processed products, such as manure and crop residues. The effect of novel BBFs on soil quality is less well known and they have not yet been evaluated in long-term field experiments (Schoumans et al. 2019). Therefore, little is known about the long-term effects of these novel BBFs on soil quality and, due to the nature of long-term field trials, results are unlikely to be available in the near future. Shorter-term laboratory incubation studies could potentially fill this gap; however, studies simulating the long-term application of BBF on soil quality in laboratory conditions are very scarce. Consequently, it is unclear whether laboratory set-ups can mimic such long-term processes.
Therefore the overall aim of the present study was to investigate the effects of selected BBFs on soil quality indicators. The specific objectives of the experiment were, firstly, to investigate how a single application of various BBFs at one-year standard application and accelerated application affects (i) a soil biological indicator (microbial biomass), (ii) soil physical indicators (WHC and clay dispersibility) and (iii) soil chemical indicators (CEC, pH, total C and C in different soil particle-size fractions). The second objective was to compare the effects on soil properties of the long-term application of a specific BBF, a compost material, in a field trial with those obtained after a single accelerated application of the same material in the laboratory incubation.
The following hypotheses were tested: (i) the decomposability of the C added with the BBF has a major effect on several soil quality indicators, with the effects more pronounced for BBFs containing a large amount of easily decomposable C (ED C), and (ii) a single accelerated addition of compost in a laboratory incubation will have similar effects on soil quality indicators to the small annual addition of compost for 17 years in a long-term field trial with the same accumulated input of compost.
Materials and methods
Initial soil properties
All soils used in this experiment were collected from the University of Copenhagen’s experimental farm in Taastrup. A sandy soil was collected from a non-treated area in one of the fields (55°40′28.6″N, 12°17′17.8″E) and was classified as an Arenosol, using the FAO classification system, based on data from Grønning et al. (pers. comm.). A soil with a higher clay content, classified as a Luvisol according to the FAO classification by Peltre et al. (2015), was collected from the field used for the long-term CRUCIAL trial (Gómez-Muñoz et al. 2017). At the time of collection, the trial had been running for 17 years. The soil was collected from a non-fertilised plot, and the FIELD soil for the field–laboratory comparison was collected from an adjacent plot that had been amended annually with the same compost material as that used in the laboratory incubation (BVC) at a rate supplying a moderate amount of N for the crop. Soils were sampled from the 0–30 cm layer and stored in moist field-like conditions and at ambient temperatures for 5 months until the start of incubation. The properties of the three soils used in the experiment are shown in Table 1.
| Arenosol | Luvisol | Luvisol FIELD | ||
|---|---|---|---|---|
| N (%) A | 0.15 ± <0.01 | 0.14 ± <0.01 | 0.34 ± 0.01 | |
| C (%) A | 1.67 ± 0.02 | 1.23 ± 0.02 | 3.10 ± 0.16 | |
| C:N | 10.9 | 9.0 | 9.0 | |
| pH CaCl2 | 6.17 ± 0.03 | 6.35 ± <0.01 | 6.65 ± 0.07 | |
| WHC (% of dry mass) | 37.1 ± 0.5 | 33.5 ± 1.2 | 40.7 ± 1.3 | |
| Clay <0.002 mm (%) B | 9.2 | 18.4 | 20.9 | |
| Silt 0.002–0.02 mm (%) B | 7.5 | 14.0 | 15.3 | |
| Fine sand 0.02–0.2 mm (%) B | 42.4 | 37.0 | 33.8 | |
| Coarse sand 0.2–2 mm (%) B | 38.5 | 28.6 | 25.6 |
Biobased fertilisers
Ten BBFs produced from different waste and side streams of agricultural, urban or industrial origin were included in this study. The 10 BBFs were selected because they represented the variety of commercially available BBFs at the time of acquisition in terms of the raw materials and processing technologies used. All the BBFs were available on the European or regional/national market at the time the study was conducted. A description of the raw materials, processing technologies used and properties of the BBFs is provided in Table 2. Briefly, the BBFs were derived from animal by-products, poultry manure, digestate, compost or plant origin, and varied greatly in pH (4.7–8.6), dry matter content (3.8–94% of fresh weight (FW)), total N content (1.5–14.2% of FW), inorganic N fraction (1–68% of total N), ED C (11–99% of total C) and C:N ratio (2.6–9.4). Further details can be found in Wester-Larsen et al. (2022).
| BBF | Group | Raw material | Technology | pH | N (% of FW) | NH4+-N (% of total N) | NO3−-N (% of total N) | DM (g kg−1 of FW) | C (% of FW) | ED C (% of total C) | C/N | |
|---|---|---|---|---|---|---|---|---|---|---|---|---|
| BA6 | Plant-based | Plant-based residues (wheat and maize) | Fermentation and distillation | 4.85 | 5.57 | 1.4 | <0.1 | 907 | 43.6 | 60 | 7.8 | |
| BIO | Animal by-product | Meat and bone meal, apatite, vinasse, poultry manure, and potassium sulfate | Pelletising | 5.69 | 7.39 | 3.5 | <0.1 | 941 | 35.9 | 62 | 4.9 | |
| BVC | Compost | Municipal organic food waste | Anaerobic digestion and composting | 8.56 | 1.57 | 8.1 | <0.1 | 557 | 14.7 | 11 | 9.4 | |
| ECO | Animal by-product | Blood and feather meal | Pelletising | 5.48 | 11.6 | 2.7 | <0.1 | 892 | 45.3 | 67 | 3.9 | |
| FEK | Poultry manure | Poultry manure | Drying and processing (extrusion process) | 6.43 | 3.94 | 20 | <0.1 | 901 | 34.7 | 46 | 8.8 | |
| MO13 | Animal by-product | Feather meal | Pelletising | 5.07 | 14.2 | 1.0 | <0.1 | 927 | 49.0 | 48 | 3.5 | |
| OG2 | Animal by-product | Horn meal (pig bristles) | Hydrolysis | 5.29 | 13.9 | 1.0 | <0.1 | 940 | 48.3 | 45 | 3.5 | |
| PAL | Plant-based | Fermented biochar and high-quality clay and rock flour | Pyrolysis and fermentation ‘Terra Preta’ | 5.55 | 4.89 | 19 | 0.1 | 907 | 38.8 | 35 | 7.9 | |
| PCW | Plant-based | Potato cell water | Evaporation | 4.70 | 1.53 | 15 | 1.1 | 339 | 11.2 | 99 | 7.3 | |
| SDG | Digestate | Agro and food waste + seaweed | Digestion | 8.40 | 0.41 | 68 | <0.1 | 38 | 1.08 | 65 | 2.6 |
Properties of the 10 BBFs included pH (1:5 in Milli-Q water), total N, NH4+-N, NO3−-N, dry matter (DM) content, total C, ED C (see materials and methods ‘Total C and easily decomposable C’) and C:N ratio. The N and C are reported as % of FW. Values are means, N = 2, except for C and N of liquid BBFs where N = 5 and pH where N = 3. All the BBFs are presented with their acronyms (three letters/numbers). Full product names and manufacturers are shown in the Supplementary material (Table S1). Data were derived from Wester-Larsen et al. (2022); calculation of ED C was based on data from Agostini et al. (unpublished).
All 10 BBFs were applied to the Arenosol, while four of them (BVC, OG2, PAL and SDG) were applied to the Luvisol (Table 1). For both soils, a negative (no amendment) and a positive control (MIN, standard ammonium-nitrate-sulfate, NS 27–4, Yara Ltd.) were included. Prior to their application, all BBFs and the MIN were homogenised. To do this, the dry BBFs were carefully crushed, but not pulverised, using a mortar until they could pass through a 2-mm sieve. The BBFs with a high fibre content that could not be crushed with the mortar were cut with scissors and passed through a 2-mm sieve. The compost (BVC) was homogenised using a blender for approximately 1 min. The two liquid BBFs (PCW and SDG) were dried at 50°C to reach a moisture content of 44% and 77%, respectively, in order not to exceed the WHC of the incubated soil with the planned application rate. Prior to application, NH4+-N lost as NH3 during the drying was added as (NH4)2SO4 in solid powder form to the partially dried BBFs.
Incubation setup
One week before the start of the experiment, the soil was sieved to 4 mm in moist field-like conditions. Batches of the sieved Arenosol and Luvisol were air dried to a moisture content of 28% and 25% of WHC, respectively. These batches were used for the treatments receiving liquid BBFs to avoid moisture contents exceeding 60% of WHC (see materials and methods ‘Water-holding capacity’) after BBF application. For the treatments with dry BBFs, the soil was not air dried. Soil equivalent to 600 ± 0.1 g dry weight was transferred to 1-L round plastic containers. The BBFs were added based on total N content in amounts corresponding to an approximate average of Danish fertilisation norms for typical arable crops, which ranges within 125–200 kg N ha−1. This corresponded to an application of 0.137 g N kg−1 soil (standard application rate), equivalent to 164 kg N ha−1 to a depth of 10 cm with an average bulk density of 1.2 g cm−3. The accelerated application was 20 times this amount, i.e. 2.74 g N kg−1 soil. An additional treatment with a single accelerated application was set up to be compared to a soil that had been subjected to 17 years of annual application of the same compost product (BVC) as used in the incubation study. This treatment with BVC thus received 17 times the annual application rate, i.e. 2.33 g N kg−1 soil, on the Luvisol. Thus, comparable amounts of C and N were added to the FIELD soil and in the 17 years accelerated treatment. Both the FIELD soil and the accelerated treatment were incubated under the same conditions. The MIN reference was applied at the same total N rates as the BBFs.
After application of the BBFs or the reference mineral fertiliser, the soil was thoroughly mixed and then compacted to achieve bulk densities of 1.20 g cm−3 for the Arenosol, 1.24 g cm−3 for the Luvisol and 1.15 g cm−3 for the Luvisol FIELD soil. Bulk densities differed due to differences in the clay and OM content of the soils (Table 1) (Keller and Håkansson 2010). Milli-Q water was then added to the soil to achieve a water content of 60% WHC (see materials and methods ‘Water-holding capacity’), taking into account the water content of the added BBF. The containers were covered with a piece of black plastic with ventilation holes to minimise evaporation and germination of seeds. The headspace was 0.5 L.
Three replicates of each treatment were prepared. Moreover, the incubation set-up was prepared with three identical batches due to destructive sampling after 2 weeks of incubation (batch 1), after 4 months of incubation (batch 2) and after 1 year of incubation (batch 3). The incubation temperature was a room temperature of 22.5 ± 3°C. The water content was checked by weighing and adjusted throughout the experiment so that the samples did not lose more than 5 g of water (corresponding to 3.7%, 4.2% and 3.4% of the total water content in the sample for the Arenosol, Luvisol and Luvisol FIELD, respectively). The WHC was measured after 14 and 120 days of incubation. The water content of the samples was then adjusted according to any changes in WHC that occurred during the incubation period.
Overview of assessed indicators
Table 3 provides an overview of the soil quality indicators assessed at different time points during the incubation period.
| Before BBF application A | 14 days after application | 120 days after application | 365 days after application | ||
|---|---|---|---|---|---|
| Total C | X | X | |||
| C fractions | X | X | |||
| CEC | X | X | |||
| pH | X | X | X | X | |
| Water-holding capacity | X | X | X | X | |
| Clay dispersibility | X | ||||
| Microbial biomass | X | X | X |
Microbial biomass
Soil microbial biomass C (SMB-C) was determined by the direct chloroform extraction method first proposed by Gregorich et al. (1990) and further developed, tested and compared with the traditional chloroform fumigation-extraction by Setia et al. (2012). Fresh soil equivalent to 5 g dry weight was transferred to 50-mL Falcon tubes. Two subsamples were prepared: one as a non-fumigated control and one for fumigation. Soil-free blanks with and without CHCl3 were also included. Of freshly prepared 0.5 M K2SO4, 20 mL was added to each Falcon tube and 0.5 mL of ethanol-free CHCl3 was added to one of the Falcon tubes. The samples were shaken for 1 h in an end-over-end shaker. The extracts were then filtered into new Falcon tubes through Whatman no. 42 filter paper. The extracts were bubbled with air for 30 min to ensure removal of all CHCl3. Samples were stored at −18°C until analysis for total organic C (TOC) (Shimadzu TOC-Vcpn, Kyoto, Japan). The SMB-C was calculated using a conversion factor of 0.45 (Joergensen 1996).
Extreme outlier values in the dataset were removed and the assessment of outliers was based on the relative difference between replicates. Single replicates (due to the loss of samples) with a very high SMB-C value, compared with the other time points, were also removed. Moreover, replicates for which the non-fumigated sample had a higher concentration of TOC compared with the fumigated sample were removed from the dataset.
Clay dispersibility
Clay dispersibility was determined on fresh samples after 1 year of incubation using the procedure described in Jensen et al. (2019) and based on the method proposed by Pojasok and Kay (1990). The fresh soil was gently crumbled by hand so it could pass through an 8-mm sieve. A soil sample equivalent to 10 g dry weight of soil was transferred to a plastic tube and artificial rainwater was added to obtain a soil-to-water ratio of 1:8. The tube was shaken in an end-over-end shaker (Stuart Tube Rotator model SB3) for 2 min at 40 rpm and 25 cm diameter rotation. After shaking, the suspension was left to settle for 230 min. Then 60 mL of the solution containing ≤2 μm particles was siphoned off and transferred to a beaker. While stirring the solution, two analytical replicate subsamples of 10 mL each were transferred to pre-weighed glass vials. All water in the glass vials was removed by drying at 105°C and the weight was recorded again. Any OM was then removed by igniting the glass vials with ≤2 μm particles for 3 h at 550°C in a muffle furnace. After ignition, the glass vials were cooled in a desiccator and weighed. The OM estimated from loss-on-ignition was subtracted from the weight of particles ≤2 μm to obtain the amount of dispersed clay. The sediment in the tube was corrected for particles >2 mm by sieving. Particles >2 mm and the total OM content were subtracted from the total soil weight to express the results as g dispersed clay kg−1 mineral soil without stones.
Water-holding capacity
The WHC was determined on air-dry soil using a modified ISO 14238 method. Briefly, open plastic cylinders with a mesh in the bottom were two-thirds filled with soil and left overnight in a container with water to saturate the soil from the bottom. The tubes with soil were left to drain on a water-saturated sand bath for 1 day and then the weight of the central part of the soil column was recorded before and after drying at 105°C. The WHC was measured on the soil samples prior to incubation and a water content of 60% of WHC was assumed to be biologically optimal and used in the incubation set-up. As the WHC of the soil may change due to BBF addition and further during the incubation period, the water content in the incubations was adjusted according to the measured changes in WHC after 14 and 120 days of incubation.
pH
Soil pH was measured on air-dry soil with the addition of 0.01 M CaCl2 solution at a soil-to-solution ratio of 1:5 (ISO 10390).
Cation exchange capacity
The CEC was determined by the neutral ammonium acetate method. Of air-dry soil, 10 g was transferred to 50-mL Falcon tubes and 30 mL of 1 M ammonium acetate (pH 7) was added. The sample was shaken briefly and then left overnight at 5°C. The next day the sample was filtered through Whatman no. 5 filter paper into Erlenmeyer flasks using a vacuum pump. A volume of 30 mL of 1 M ammonium acetate (pH 7) was then added four times to the soil on the filter paper. Afterwards the soil was rinsed with four separate additions of 20 mL of 96% ethanol. The NH4+-N in the soil was then extracted by adding a volume of 20 mL of 1 M KCl to the soil four times, collecting the extract and transferring it to a volumetric flask, and adjusting the final volume to 100 mL with 1 M KCl. The extract was kept at −18°C until analysis of NH4+-N.
Total C and easily decomposable C
Total C was determined by Dumas combustion using an elemental analyser (CNS vario Macro Cube, Elementar). The amount of ED C in the BBFs (Table 2) was calculated as the fraction of respired C relative to total C from data on CO2-C emissions (Agostini et al. unpublished) and the BBF total C content (Table 2). The CO2-C was quantified by trapping respired CO2-C in 0.1 M NaOH at five time points during 84 days of BBF incubation (Agostini et al., unpubl. data).
Carbon in soil particle size fractionation
Soil C particle size fractionation was performed using procedures based on Amelung and Zech (1999). Air-dry soil (20 ± 0.05 g) was transferred to a beaker and 100 mL of Milli-Q water was added at a soil-to-water ratio of 1:5. The soil aggregates were disintegrated by sonication at 450 J mL−1 using a probe-type sonicator. During sonication, the temperature did not exceed 60°C to avoid loss of C. The dispersed samples were sieved at 250 and 50 μm, leaving three size fractions: >250, 50–250 and <50 μm. The fractions were dried at 60°C, their weight was recorded and they were ball-milled for total C analysis by Dumas combustion. The recovery of sample mass was in the range of 103 ± 7% and the recovery of C was 99 ± 16%. The fraction smaller than 50 μm was regarded as mineral-associated organic matter (MAOM) (Lavallee et al. 2020), while the fraction larger than 50 μm was regarded as particulate organic matter (POM) (Lavallee et al. 2020) and further divided into large POM of >250 μm (POMlarge) and small POM of 50–250 μm (POMsmall).
Statistics
All graphs were produced in SigmaPlot 14.00 (Systat Software, Inc.). All statistical analyses were performed in R version 4.1.2 (R Core Team) using the packages readxl, tidyverse and emmeans. Data were visually assessed with diagnostic plots to check the homogeneity of variance. In the event of heterogeneity of variance, the data were log10 transformed. The dataset was divided into two according to the two soil types included in the experiments, except for correlations between soil quality indicators.
To detect differences between treatments for the soil quality indicators (SMB-C, clay dispersibility, WHC, pH, CEC, total C and the three C fractions) on the different sampling dates, linear models were used. In these models, BBF was included as a categorical factor. The interactions among BBF, application rate and batch were included as fixed effects. Comparisons of Bonferroni-adjusted pairs of estimated marginal means were used to assess the differences between treatments. The Bonferroni-adjusted significance levels used were calculated based on the number of comparisons made, and were 0.05/5 = 0.01 for the Luvisol dataset and 0.05/11 = 0.0045 for the Arenosol dataset.
To test for changes in C fractions during the incubation period, linear models were used. Interactions between the treatments and batches were included. Comparisons of Tukey-adjusted pairs of estimated marginal means were used to assess the differences in measurements between the two time points (batches). A minimum significance of P < 0.05 was applied.
To assess the effect of applied total and ED C on the soil quality indicators (SMB-C, clay dispersibility, WHC, pH, CEC, total C and the three C fractions), linear regression models for each soil and each batch were used. A minimum significance of P < 0.05 was applied and correlations with coefficients less than or equal to |0.1| were not included. To assess the correlations between the measured soil quality indicators (SMB-C, clay dispersibility, WHC, pH, CEC, total C and the three C fractions), linear regression models including both soils at the accelerated application rate were used. A minimum significance of P < 0.05 was applied and correlations with coefficients less than or equal to |0.1| were not included.
To compare the experimental set-up with the long-term field trial soil (Luvisol FIELD) for the soil quality indicators (SMB-C, clay dispersibility, WHC, pH, CEC, total C and the three C fractions), linear models were used. Interactions between the treatments and batches were included. Comparisons of Tukey-adjusted pairs of estimated marginal means were used to assess the differences between accelerated application and long-term field application treatments and the negative control. A minimum significance of P < 0.05 was applied.
Results
Biological soil quality
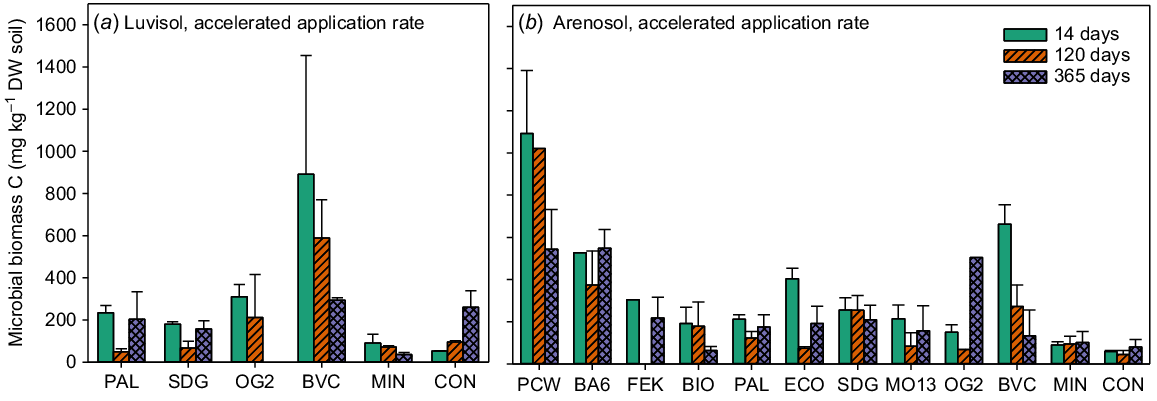
The results for SMB-C were inconsistent and did not reveal very clear trends. Due to the high variability and many missing values (materials and methods ‘Microbial biomass’), statistics were not performed for the SMB-C data. Only the results for the accelerated application are shown in Fig. 1 as the treatments did not differentiate from the negative control at the standard application rate (see Fig. S1 in the Supplementary material). Overall, there was a trend showing an increase in SMB-C after the addition of BBFs compared with the negative control in the Arenosol (Fig. 1b), while in the Luvisol, this was mainly visible on the first sampling date. There were also no clear differences between the BBFs, but the potato cell water (PCW) and plant-based BBF (BA6) treatments had a high SMB-C compared with the other treatments in the Arenosol (Fig. 1b), and the addition of compost (BVC) resulted in a relatively high SMB-C in the first part of the experiment in both soils (Fig. 1a and b).
Microbial biomass C (mg kg dry soil−1). Luvisol accelerated application rate (a) and Arenosol accelerated application rate (b). Values are means ± SE for samples taken at three time points during the incubation period: 14, 120 and 365 days after the start of incubation. BA6, BIO, BVC, ECO, FEK, MO13, OG2, PAL and SDG are biobased fertilisers, MIN is a reference mineral fertiliser and CON is the negative control. N = 1 for OG2 120 days, PCW 120 days and OG2 365 days (b). N = 2 for MIN 14 days, SDG 14 days and OG2 120 days (a) and MO13 14 days, SDG 14 days, ECO 120 days, PAL 120 days, SDG 120 days, BVC 365 days and ECO 365 days (b). For all others, N = 3.
Soil physical quality
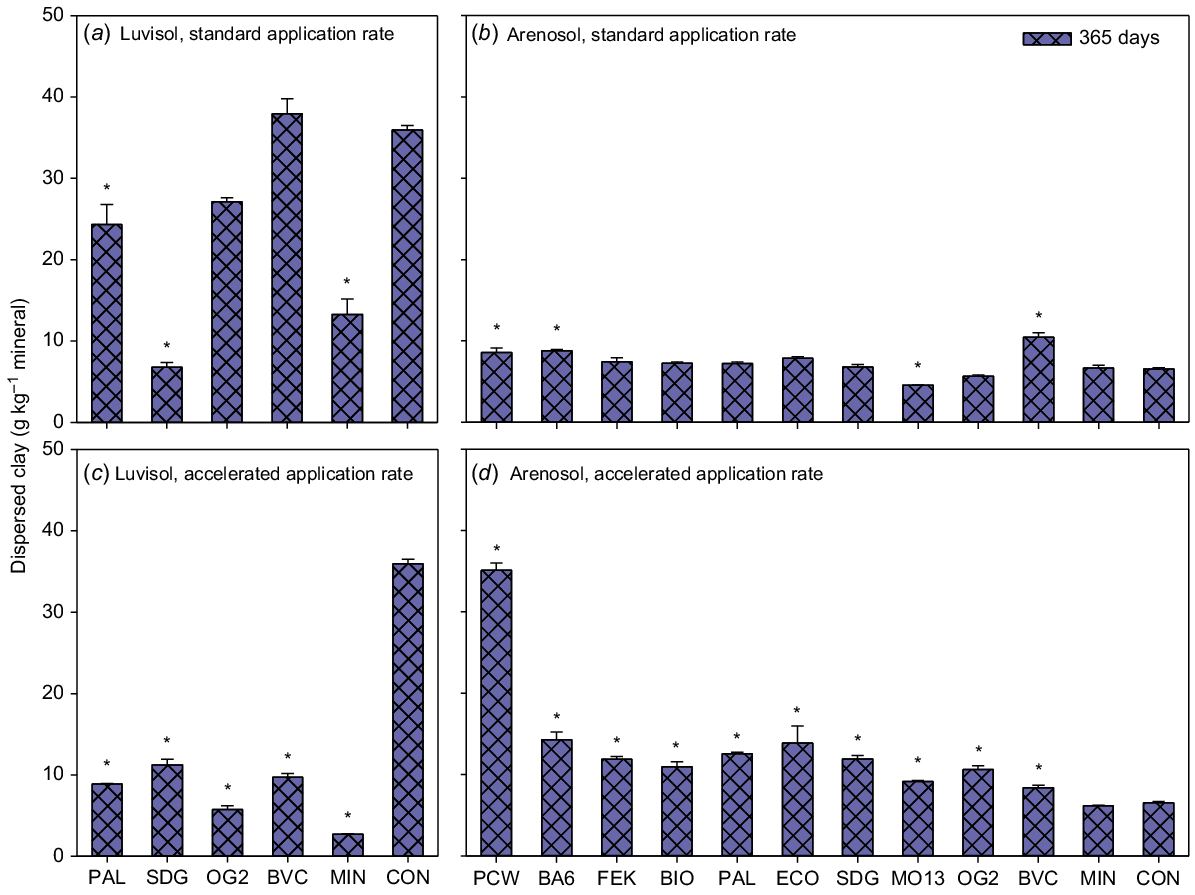
The negative control treatment with the Luvisol had much higher clay dispersibility than its Arenosol counterpart (Fig. 2). For the Luvisol, the plant-based BBF (PAL) and digestate (SDG) treatments resulted in significantly lower clay dispersibility, and thus increased soil structural stability, at both standard and accelerated application rates, compared with the negative control (Fig. 2a and c). Furthermore, the animal-based BBF (OG2) and compost (BVC) treatments significantly reduced clay dispersibility compared with the negative control at the accelerated application rate (Fig. 2c). The mineral reference (MIN) treatment also reduced clay dispersibility significantly compared with the negative control at both application rates (Fig. 2a and c). For the Arenosol, only one animal-based treatment (MO13) had significantly lower clay dispersibility compared with the negative control at the standard application rate (Fig. 2b). For all other treatments, clay dispersibility was either increased or unchanged compared with the negative control (Fig. 2b and d).
Clay dispersibility (g clay kg minerals−1). Luvisol standard application rate (a), Arenosol standard application rate (b), Luvisol accelerated application rate (c) and Arenosol accelerated application rate (d). Values are means ± SE for samples taken out 365 days after the start of incubation. BA6, BIO, BVC, ECO, FEK, MO13, OG2, PAL and SDG are biobased fertilisers, MIN is a reference mineral fertiliser and CON is the negative control. Asterisks indicate significant differences between CON and treatments. N = 2 for OG2 (a), for all others N = 3.
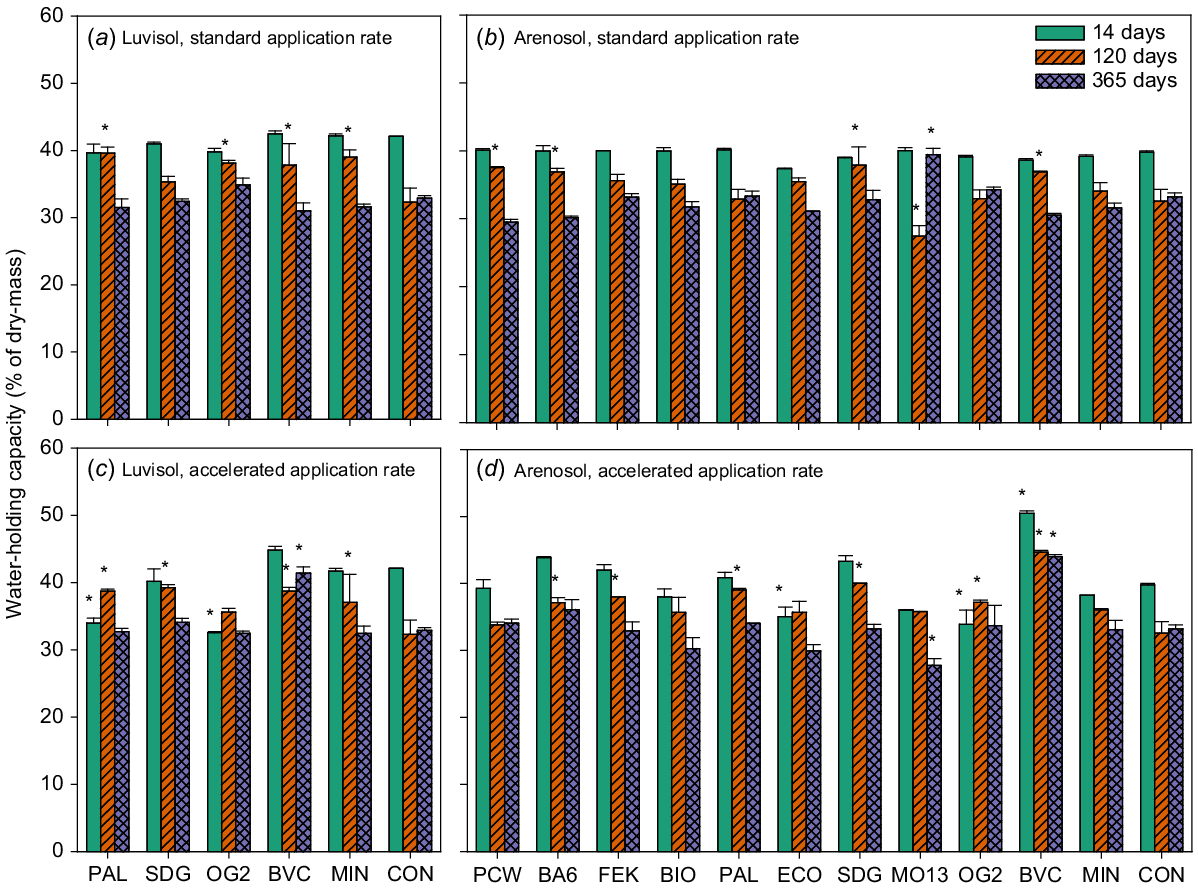
The accelerated application of the compost (BVC) significantly increased WHC compared with the negative control for both soils at all time points, except after 14 days for the Luvisol (Fig. 3c and d, Tables S2 and S3). For the Arenosol, after 365 days the lower rate application of one animal-based BBF (MO13) significantly increased WHC compared with the negative control (Table S2); however, after 120 days the WHC was very low for MO13 compared with the negative control (Fig. 3b). The accelerated application of MO13 on the Arenosol after 365 days significantly decreased WHC compared with the negative control (Fig. 3d, Table S2).
Water-holding capacity (% of dry mass). Luvisol standard application rate (a), Arenosol standard application rate (b), Luvisol accelerated application rate (c) and Arenosol accelerated application rate (d). Values are means ± SE for samples taken at three time points during the incubation period: 14, 120 and 365 days after the start of incubation. BA6, BIO, BVC, ECO, FEK, MO13, OG2, PAL and SDG are biobased fertilisers, MIN is a reference mineral fertiliser and CON is the negative control. Asterisks indicate significant differences between CON and treatments for each time point. N = 1 for MIN 14 days (d), for all others N = 2.
Soil chemical quality
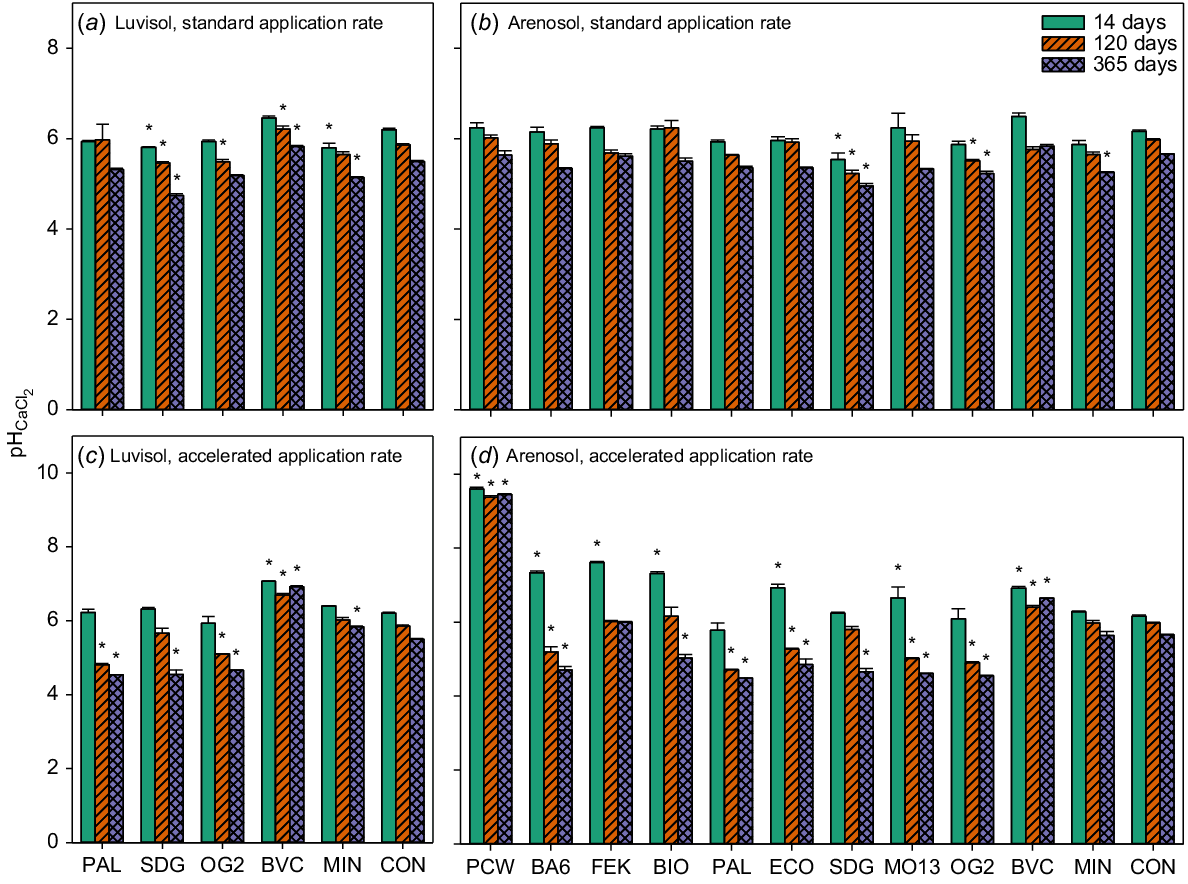
The accelerated applications of the potato cell water (PCW) and compost (BVC) were the only treatments that increased pH after 365 days of application compared with the negative controls (Fig. 4c and d). For the accelerated application of all other BBF treatments, except the poultry manure-based BBF (FEK), the pH after 365 days was significantly lower than for the negative control for both soils (Fig. 4c and d, Tables S2 and S3). For the standard rate application of the digestate (SDG) and one animal-based BBF (OG2), the pH after 365 days was significantly lower than for the negative control for both soils (Fig. 4a and b, Tables S2 and S3).
pH 1:5 CaCl2. Luvisol standard application rate (a), Arenosol standard application rate (b), Luvisol accelerated application rate (c) and Arenosol accelerated application rate (d). Values are means ± SE for samples taken at three time points during the incubation period: 14, 120 and 365 days after the start of incubation. BA6, BIO, BVC, ECO, FEK, MO13, OG2, PAL and SDG are biobased fertilisers, MIN is a reference mineral fertiliser and CON is the negative control. Note the different scales on the vertical axes. Asterisks indicate significant differences between CON and treatments for each time point. N = 3.
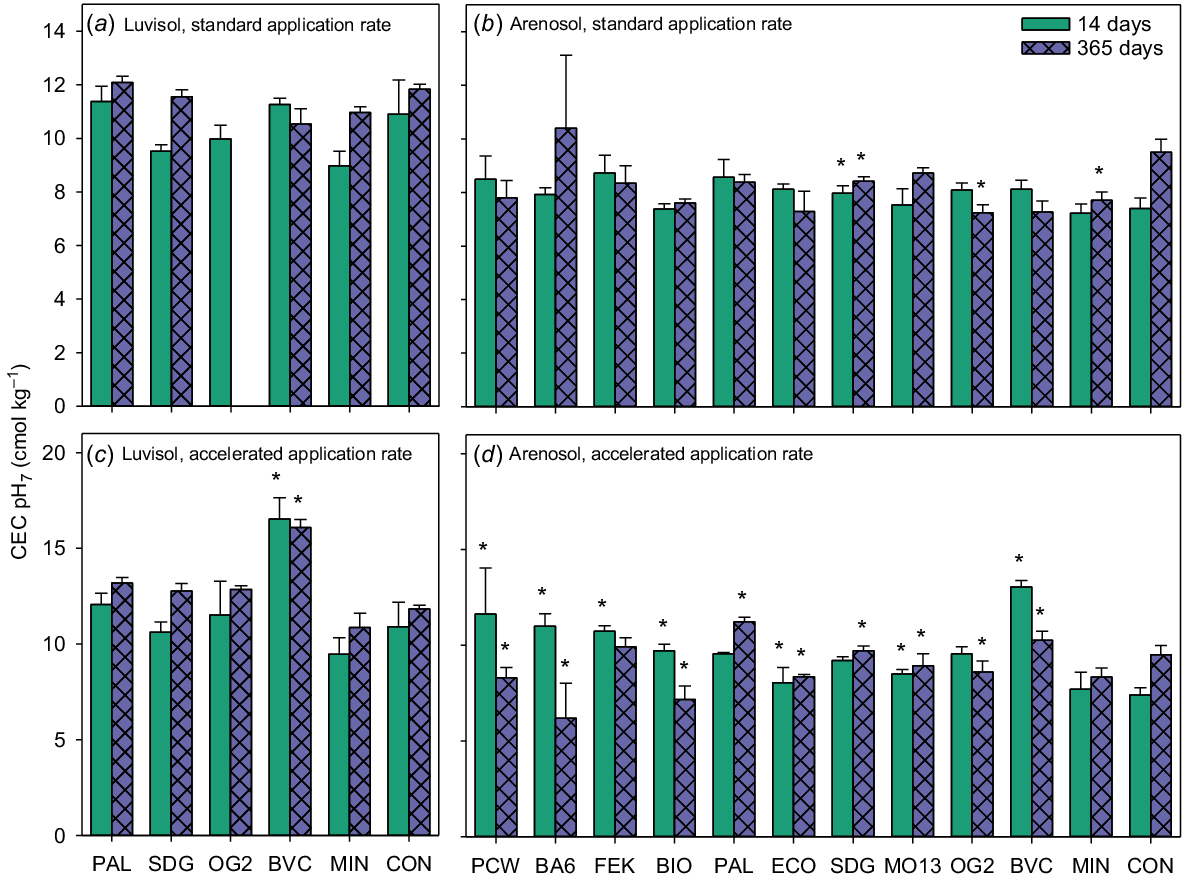
The standard application treatments did not change CEC compared with the negative control for any of the soils (Fig. 5a and b). The accelerated application treatments of potato cell water (PCW), plant-based (BA6) and compost (BVC) treatments significantly increased CEC after 14 days compared with the negative control (Fig. 5c and d, Tables S2 and S3). However, only the accelerated BVC treatment on the Luvisol still showed a significantly higher CEC after 365 days compared with the negative control (Fig. 5c, Table S3), while the accelerated rate BA6 treatment on the Arenosol had a significantly lower CEC compared with the negative control after 365 days (Fig. 5d, Table S2).
Cation exchange capacity at pH 7 (cmol kg−1). Luvisol standard application rate (a), Arenosol standard application rate (b), Luvisol accelerated application rate (c) and Arenosol accelerated application rate (d). Values are means ± SE. for samples taken at two time points during the incubation period: 14 and 365 days after the start of incubation. BA6, BIO, BVC, ECO, FEK, MO13, OG2, PAL and SDG are biobased fertilisers, MIN is a reference mineral fertiliser and CON is the negative control. Note the different scales on the vertical axes. Asterisks indicate significant differences between CON and treatments for each time point. N = 2 for CON (b and d), for all others N = 3.
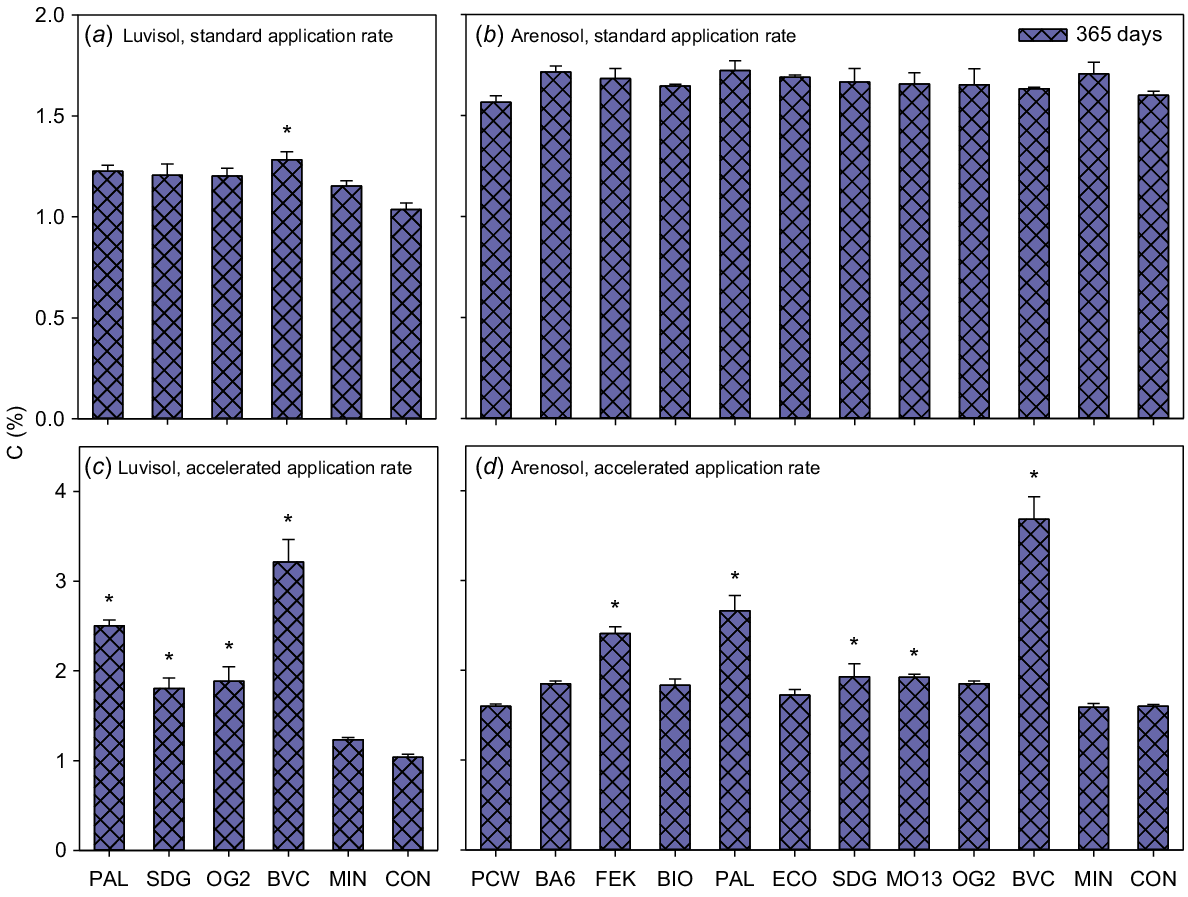
The initial total C content was 1.2% and 1.7% for the Luvisol and Arenosol, respectively (Table 1), and it decreased in the negative controls by 16% and 4% during 365 days of incubation for the Luvisol and Arenosol, respectively. For the Luvisol, all accelerated rate application BBF treatments and the compost (BVC) standard application treatment significantly increased total C content compared with the negative control (Fig. 6a and c, Tables S2 and S3). For the Arenosol, accelerated rate application of the poultry manure-based BBF (FEK), plant-based BBF (PAL), animal-based BBF (MO13), digestate (SDG) and compost (BVC) treatments significantly increased total C content compared with the negative control (Fig. 6b and d, Table S2).
Total C (%). Luvisol standard application rate (a), Arenosol standard application rate (b), Luvisol accelerated application rate (c) and Arenosol accelerated application rate (d). Values are means ± SE for samples taken 365 days after the start of incubation. BA6, BIO, BVC, ECO, FEK, MO13, OG2, PAL and SDG are biobased fertilisers, MIN is a reference mineral fertiliser and CON is the negative control. Asterisks indicate significant differences between CON and the treatments. Note the different scales on the vertical axes. N = 3.
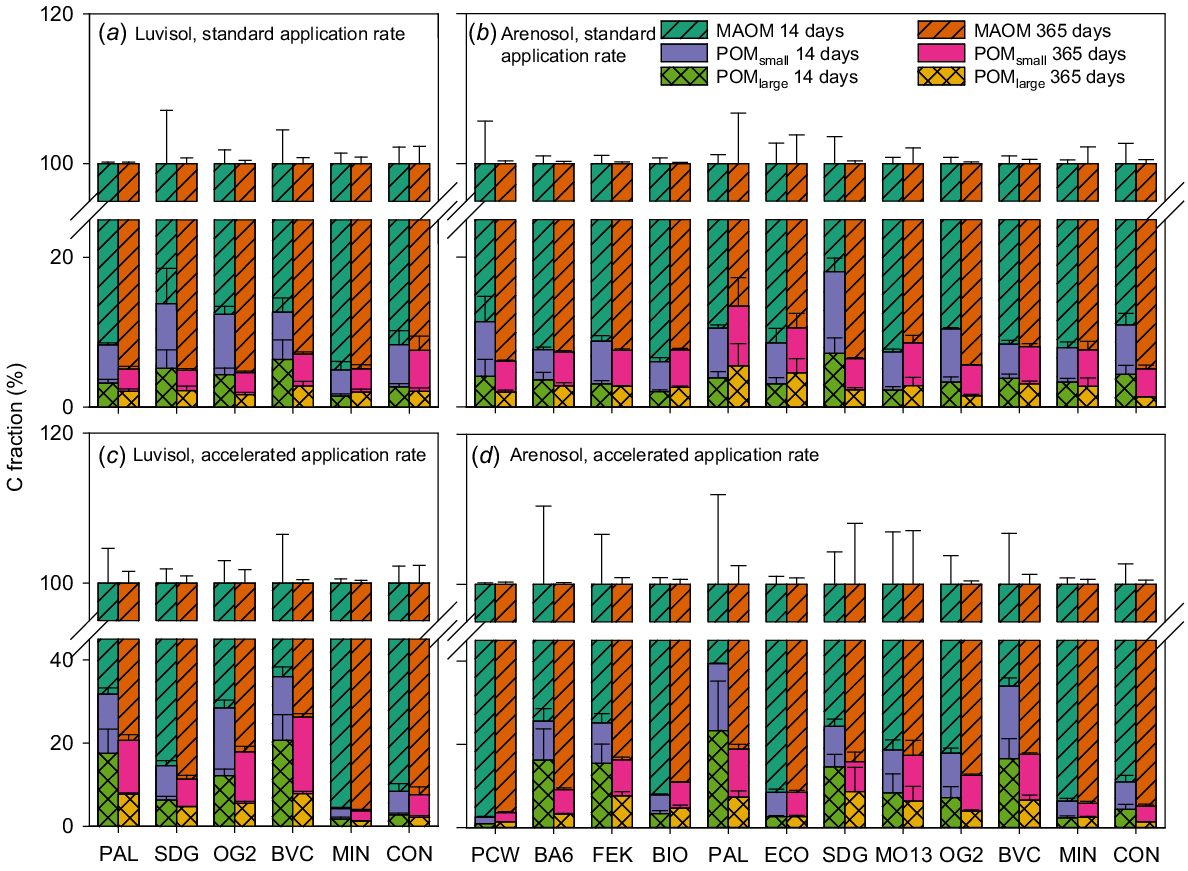
The MAOM fraction was by far the largest of the three C fractions for both soils and all treatments (Fig. 7). During the incubation period, the POMlarge fraction decreased significantly and the MAOM fraction increased significantly for the accelerated application of all BBFs, except the digestate (SDG) on the Luvisol (Fig. 7c, Table S4). For the Arenosol, the same tendency was observed during the incubation period for all BBFs at the accelerated application rate, except for potato cell water (PCW) and the two animal-based BBFs, BIO and ECO (Fig. 7d). However, only the accelerated application of the digestate (SDG) and the plant-based BBFs BA6 and PAL showed a significant decrease in the POMlarge fraction and only BA6, PAL and the compost (BVC) demonstrated a significant increase in the MAOM fraction (Table S4). Generally, the C fractions did not change significantly during the incubation period for the standard application rate (Fig. 7a and b, Table S4). However, the standard application rate of the digestate (SDG) led to a significant decrease in POM and a significant increase in MAOM in both soils (Table S4).
POMlarge (C fraction >250 μm (%)), POMsmall (C fraction 50–250 μm (%)) and MAOM (C fraction <50 μm (%)). Luvisol standard application rate (a), Arenosol standard application rate (b) Luvisol accelerated application rate (c) and Arenosol accelerated application rate (d). Values are means ± SE for samples taken at two time points during the incubation period: 14 and 365 days after start of incubation. BA6, BIO, BVC, ECO, FEK, MO13, OG2, PAL and SDG are biobased fertilisers, MIN is a reference mineral fertiliser and CON is the negative control. Note the break in the vertical axes. N = 3.
Correlations between soil quality indicators and C input
Total C content correlated significantly with WHC, CEC and the two POM C fractions (Table 4), but the correlations were rather weak. Only three strongly significant correlations were found: between clay dispersibility and CEC (−0.87), WHC and CEC (0.73) and POMlarge and POMsmall (0.96).
| WHC | pH | CEC | Total C | POMlarge | POMsmall | MAOM | ||
|---|---|---|---|---|---|---|---|---|
| Clay dispersibility | −0.87 | −0.57 | ||||||
| WHC | – | 0.73 | 0.58 | 0.14 | ||||
| pH | 0.10 | – | ||||||
| CEC | 0.17 | – | 0.18 | 0.30 | ||||
| Total C | 0.10 | 0.11 | – | 0.13 | 0.10 | |||
| POMlarge | 0.53 | – | 0.96 | |||||
| POMsmall | 0.48 | 0.54 | – | |||||
| MAOM | – |
Only significant (P < 0.05) correlations with coefficients ≥|0.1| are included.
For both soils, the applied ED C and total C correlated significantly with total C and POMlarge 365 days after the start of incubation (Table 5). For both soils, total C correlated significantly with POMsmall 365 days after the start of incubation. Moreover, for the Arenosol, the applied ED C was significantly correlated with POMsmall 365 days after the start of incubation. For the Luvisol, total C applied was significantly correlated with CEC 365 days after the start of incubation. All correlation coefficients were rather weak (0.1–0.3), except for correlations with total C (0.6–0.9).
| Applied | Soil | Clay dispersibility | WHC | pH | CEC | Total C | POMlarge | POMsmall | MAOM | |
|---|---|---|---|---|---|---|---|---|---|---|
| ED C | Luvisol | 0.73 | 0.14 | |||||||
| Arenosol | 0.60 | 0.19 | 0.16 | |||||||
| Total C | Luvisol | 0.32 | 0.90 | 0.17 | 0.10 | |||||
| Arenosol | 0.80 | 0.22 | 0.19 |
Only significant (P < 0.05) correlations are included.
Implication of soil type
The effect of applying the different BBFs was the same for the biological and chemical soil quality indicators regardless of soil type. However, the BBFs had different effects on the two soil types for the two physical soil quality indicators. The BBFs had a structure-improving effect on the Luvisol, with the application of BBFs decreasing clay dispersibility, while BBFs increased clay dispersibility in the Arenosol compared with the negative control. In contrast, the BBFs generally increased WHC more in the Arenosol than in the Luvisol.
Comparison of laboratory accelerated application with annual field application
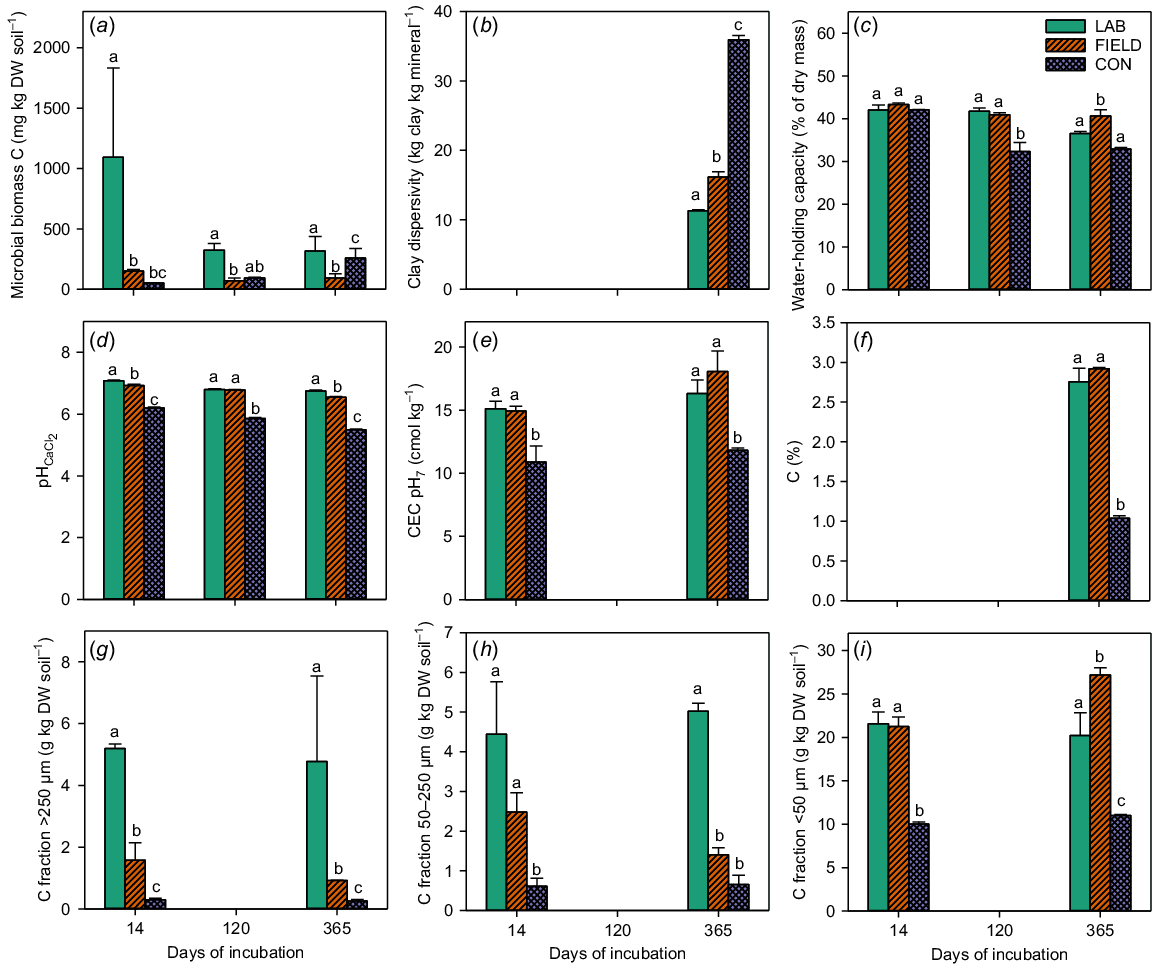
The laboratory incubation experiment was generally able to mimic real long-term effects of annual compost (BVC) applications on WHC, pH, CEC and total C (Fig. 8c–f). This was evident from the lack of significant differences between the field (FIELD – soil from a real long-term field experiment with BVC application for 17 years) and the LAB (one time accelerated application of BVC corresponding to 17 years of annual application), although this was not consistently significant for WHC and pH (Fig. 8). For the MAOM fraction, the experimental set-up could partly mimic the real long-term application of BVC (Fig. 8i). However, for microbial biomass, clay dispersibility and the two POM C fractions (Fig. 8a, b, g and h), the experimental set-up overestimated the effect of BVC application and was therefore not able to mimic the real long-term application of BVC.
Microbial biomass C (mg kg dry soil−1) (a), clay dispersibility (g clay kg minerals−1) (b), water-holding capacity (% of dry mass) (c), pH 1:5 CaCl2 (d), cation exchange capacity at pH 7 (cmol kg−1) (e), total C (%) (f), C fraction >250 μm (g kg dry soil−1) (g), C fraction 50–250 μm (g kg dry soil−1) (h) and C fraction <50 μm (g kg dry soil−1) (i). Values are means ± SE for samples taken at three time points during the incubation period. FIELD is soil from real life long-term field experiment with BVC application for 17 years, LAB is the one time accelerated application of BVC corresponding to 17 years of annual application and CON is the negative control. Note the different scales on the vertical axes. N = 2 for FIELD 14 days, LAB 120 days and CON 120 days (a) and all samples (c). For all others, N = 3. Lower case letters indicate significant differences between treatments within each incubation time point.
Discussion
Overall, the application of BBFs improved soil quality indicators. As hypothesised, soil quality was also influenced by the decomposability of C added with the BBFs, but this was far from the only factor influencing their effects on soil quality indicators. Contrary to expectations, total applied C and applied ED C were equally good predictors of effects on soil quality (Table 5). A strong correlation between SMB-C and added ED C was anticipated, but this could not be assessed due to the high variability in SMB-C data. In contrast, CEC was predicted more effectively by total C application than by ED C application, in agreement with earlier findings concerning relationships between soil total organic C and CEC (Brady and Weil 2014). Furthermore, C application appeared to be far from the only factor controlling the effects of BBF application on soil quality, as most soil quality indicators did not correlate with either total C application or application of ED C (Table 5).
Soil biological quality
In general, SMB-C was low in the negative control samples compared with previous findings for agricultural soils (Bhattacharyya et al. 2003; Cai et al. 2016). This was probably due to the soil being stored before the start of the incubation. Compared with a freshly sampled soil from the same field, the SMB-C for the negative control was 40% lower after 14 days of incubation for the Arenosol (Fig. S2 in the Supplementary material).
Cai et al. (2016) found an increase in SMB-C of 46–196% after 32 years of manure application compared with a non-fertilised control and mineral fertiliser application. In this study, the decrease/increase in SMB-C compared with the negative control was in the range of −65% to +11% and −27% to +85% for the Luvisol and Arenosol, respectively, after 365 days at the accelerated application rate. Pezzolla et al. (2013) also found increases in SMB-C after the addition of organic amendments to two different soils, with the highest SMB-C after 12 and 20 days from measurements on days 0, 5, 12, 20, 30 and 45. This is in agreement with the results of the present study, where SMB-C showed the highest increase compared with the negative control after 14 days of application, with values declining after 120 and 365 days of application, indicating higher initial decomposition rates of the added organic materials.
The plant-based BBFs, PCW and BA6, increased SMB-C most, which may be related to the high amounts of easily degradable C in them. However, the compost BVC also caused a relatively high increase in SMB-C compared with the negative control, despite BVC containing the lowest amount of easily degradable C. This may be related to the BVC containing microbes from the composting process, unlike most of the other BBFs that have been sterilised and therefore do not contain living microbes.
Soil physical quality
In a meta-analysis of 251 European long-term field experiments, soil physical quality was improved by the application of organic fertilisers and amendments (Sandén et al. 2018). However, in the present study, the effects varied depending on soil type, BBF and quality indicator.
All accelerated applications and some standard applications of BBFs and the mineral reference (MIN) treatment decreased clay dispersibility in the Luvisol, and thus increased soil structural stability, compared with the negative control (Fig. 2). The mineral fertiliser (MIN) treatment had not been expected to improve soil structural stability and no explanation for this could be found. The negative control treatment of the Arenosol had much lower clay dispersibility than its Luvisol counterpart. This could be explained by the high clay/carbon ratio of 15 for the Luvisol compared with 5.5 for the Arenosol (Table 1), as well as the difference in clay content per se (Schjønning et al. 2012).
The effect on clay dispersibility of the high BBF application on the Arenosol showed the opposite to what had been expected, with most BBFs significantly increasing the amount of dispersible clay (Fig. 2d). The samples were combusted at 550°C to remove all OM, leaving only the clay, as it was suspected that a high amount of OM in the suspension could have caused the clay dispersibility to become higher in the BBF treatment samples, compared with the negative control for the Arenosol. However, the combustion step did not change the difference between the treatments and the negative control. The numerical differences between the treatments and the negative control for the Arenosol were not very large, except for the potato cell water (PCW). When comparing clay dispersibility with soil pH, clay dispersibility increased with rising pH for the standard application rate on the Arenosol (Fig. S3b in the supplementary material). However, for the accelerated application rate there was no general correlation, although the accelerated application of the potato cell water (PCW) resulted in a marked increase in both pH and clay dispersibility compared with the other treatments (Fig. S3a). This increase in pH and the associated increase in the net negative charge of the clay particles may explain the increase in clay dispersibility following accelerated application of PCW (Chorom et al. 1994).
While there was an effect of the accelerated application rate on clay dispersibility for all BBFs, at least in the Luvisol, only the accelerated application rate of the compost (BVC) significantly increased WHC compared with the negative control for both soils after 365 days (Fig. 3c and d). In a long-term field trial, Gómez-Muñoz et al. (2017) measured volumetric water content near saturation and found that all organic amendments, except human urine, increased soil water content compared with the negative control after 11 years of application. In accordance with our study, high amounts of added compost resulted in a significantly higher water content than in all other treatments. The WHC generally increased more in the Arenosol compared to the Luvisol. This might be due to the OM addition with the BBFs contributing more to the WHC in the Arenosol, which has a lower clay content than the Luvisol.
Soil chemical quality
The compost (BVC) increased soil pH compared with the negative control (Fig. 4d), in agreement with some previous studies (D’Hose et al. 2014; Sandén et al. 2018). On the Arenosol, the accelerated application of PCW, which is a potato cell water-based fertiliser, also increased soil pH significantly compared with the negative control (Fig. 4d). The PCW had a low pH of 4.7 (Table 2), so the high pH caused by its application must be related to decomposition products. The exact chemical composition of PCW was not analysed, but it may have contained organic acids that led to this pH increase when oxidised (Yan et al. 1996; Zwijnenberg et al. 2002). The pH increase caused by the application of BVC and PCW would be beneficial in agricultural practices and humid climates where regular lime addition is common practice, e.g. in Denmark (Borggard and Elberling 2013). Except for BVC and PCW, BBF application decreased the pH of both soils compared with the negative control. This contrasts with the findings of Sandén et al. (2018), who found no change in soil pH after application of farmyard manure, slurry or crop residues, or of Lin et al. (2016), who performed a meta-analysis and even found that poultry manure increased soil pH. The decrease in soil pH after the application of BBFs could be caused by the decomposition of the high amounts of easily degradable C added with the BBFs (Alvarenga et al. 2017).
The application of BBFs did not have a pronounced or very consistent effect on soil CEC. In a meta-analysis, Lin et al. (2016) found that poultry manure increased soil CEC compared with mineral fertiliser. In the present study, the poultry manure-based BBF, FEK, also increased CEC, although not significantly so. Only a significant correlation between total added C and CEC for the Luvisol was found, which suggests that CEC was related more to other C pools than the ED C pool. Previous studies also found a relationship between soil total C and CEC (Sinoga et al. 2012; da Costa et al. 2020).
van der Bom et al. (2019) found a 10–32% increase in total soil C content after 21 years of slurry application of 11–22 tons C ha−1 year−1. In the present study, the annual rate of C application ranged within 0.4–1.4 tons C ha−1. The results of van der Bom et al. (2019) are lower than the findings in the present study where the increase in total soil C content was higher, albeit more variable, ranging within 0–68% for BBFs applied at the accelerated rate corresponding to 20 years of application, despite lower annual C input in the present study. This could be attributed to the incubation lasting for just 1 year. Therefore the decomposition of OM was probably lower compared with 20 years of decomposition of the same total amount of OM added in smaller quantities per year. The greatest increase in total C was for BVC on the Luvisol, with a 68% increase, whereas the potato cell water (PCW) application did not lead to an increase in total C content. This is consistent with the PCW almost exclusively containing ED C and the compost containing the least amount of ED C due to stabilisation of the C during composting (Gutser et al. 2005) (Table 2). Sandén et al. (2018) also found the greatest increase in SOC after compost addition, compared with the increase from farmyard manure and slurry, which led to lower and similar increases in SOC.
Most BBF treatments showed an increase in MAOM and a decrease in one or both of the POM fractions from 14 to 365 days after application, although not significantly so for all of them (Fig. 7). This indicates that a stabilisation of C took place during the 365 days of incubation. However, the negative control of the Arenosol showed a non-significant decrease in POM and an increase in MAOM, which was greater than all standard application rate treatments, except the digestate (SDG) and half of the accelerated application treatments. Nevertheless, all the treatments that significantly decreased the POM fractions and increased the MAOM fraction demonstrated larger changes than the negative control. For the potato cell water (PCW) and animal-based BBF (BIO) there was a non-significant decrease in MAOM, implying either that stable soil C was lost through priming or that very small POM, <50 μm, was added with the BBFs. Both of these BBFs contained high proportions of ED C (Table 2), which could indicate that C may have been lost through priming. Moreover, no density fractionation was performed due to a large number of samples, therefore it is also plausible that small POM may have ended up in the MAOM fraction at the first sampling date (Lavallee et al. 2020).
Comparison of laboratory accelerated application with annual field application
One could expect that these laboratory incubation results might not reflect the conditions in field conditions. Therefore, the results obtained in the laboratory setup with accelerated application of the compost (BVC) were compared to a long-term annual application of BVC.
The SMB-C was significantly higher for the single accelerated rate application at all time points compared with the long-term annual application of the compost (BVC) (Fig. 8a), suggesting that BVC application initially increased SMB-C, but that this effect did not last long. This could be related to the decomposition of ED C, which is supported by the higher amount of POM C in the accelerated application sample compared with the FIELD sample (Fig. 8g and h). Comparing the effect of BVC application on SMB-C with the effect of other BBFs (Fig. 1), some BBFs had longer-lasting effects on SMB-C during the incubation period, e.g. the digestate (SDG) and the plant-based BA6 and PAL. This suggests that the differences identified between FIELD and LAB were specific for BVC and would not necessarily be observed with other BBFs.
Soil structural stability was significantly higher in the incubation study than in the long-term field trial (Fig. 8b). This could be due to the lack of tillage after application of BVC in the incubation study compared with the soil sampled from the long-term experiment, which was subjected to tillage after BVC application in all 17 years (Schröder et al. 2016). Thus, it cannot be assumed that the increase in soil structural stability found in the present study would be as great if the BBFs were applied every year at a normal fertiliser rate in the field. The WHC was initially similar for the field and the laboratory sample, but significantly differed from each other after 365 days of incubation (Fig. 8c). This suggests that the effect on WHC of long-term application of BVC was mimicked by the single accelerated application, although the effect of the single accelerated BVC application on WHC was slightly underestimated 365 days after the start of the incubation compared with the soil receiving an annual application for several years.
When comparing the pH of the accelerated application of compost (BVC) samples with the soil from the long-term annual field application, the accelerated samples were slightly, but significantly higher (Fig. 8d). This may suggest that annual long-term compost application will lead to a slightly smaller increase in soil pH than the single accelerated application, although the results were in the same range as those for the untreated control soil.
The accelerated application resulted in the same levels as those obtained after long-term application of BVC in the field for CEC and total C (Fig. 8e and f). The lack of difference in total C between the FIELD soil and accelerated samples could be because the C in BVC was very stable and therefore not greatly degraded, as the C content would otherwise be expected to be higher in the accelerated laboratory sample than in the FIELD soil. The latter assumption is more in line with the results for the C fractions that suggest that the C was decomposed to a greater extent in the FIELD sample than in the accelerated application sample after 365 days (Fig. 8g and h). The two POM fractions contained significantly more C for the accelerated application sample compared with the FIELD sample. However, the two POM fractions decreased and the MAOM fraction increased during the incubation period for the FIELD sample, suggesting that some C transformation also occurred in the FIELD soil.
In conclusion, pH and the soil quality indicators that depend on stable C (CEC, WHC and total C) were mimicked quite well by the accelerated application, in contrast to soil quality indicators related more to microbial activity and soil management. This may be specific to BVC, which contains a high proportion of stable C. It cannot be assumed with any certainty that the results of the comparison between the one-time accelerated application and the long-term annual application are valid for the other BBFs. As the other studied BBFs contained a higher proportion of easily degradable C, the process of C stabilisation may take longer than for BVC. In addition, more C may be lost through respiration from application of the BBFs containing a higher proportion of easily degradable C.
Conclusions
Overall, the BBFs improved soil quality, although the effects were not significant in most cases. Some BBFs, however, produced a decrease in pH, which would be perceived as negative in agricultural environments with acidic soils. Generally, the compost (BVC) improved the soil quality indicators most, particularly WHC, total C and CEC. The plant-based BBF (PAL) and the digestate (SDG) treatments also improved soil quality to a greater extent than the other BBFs. The effect of application of the BBFs on the soil quality indicators depended on both the decomposability of the C and the total C added with the different BBFs for some, but not all, of these indicators. Their impact was expected to depend more on the decomposability of the added C than on the total C added, but this could not be confirmed. The different soil types tested in this study did not influence the effect that the application of BBFs had on biological and chemical soil quality indicators. However, soil type did affect the impact on soil physical quality indicators, with an improvement in soil structural stability for the Luvisol but not the Arenosol. In contrast, WHC was improved more for the Arenosol than the Luvisol. The effects on soil quality indicators of a single accelerated application of the compost (BVC) in a laboratory incubation compared with a standard annual application in a long-term field trial indicated that the laboratory incubation could mimic long-term yearly field application for WHC, pH, CEC and total C. However, it is unclear whether this applies to BBFs containing less stable carbon than BVC. Thus, future research on the effects on soil quality of BBFs in long-term field trials is highly relevant.
Data availability
All data presented in this paper are openly available online in ERDA, the repository of the University of Copenhagen: https://doi.org/10.17894/ucph.f4ed5a3a-af63-4253-99f5-ba0cbd2f31dc.
Conflicts of interest
The authors declare that they have no financial or personal competing interests.
Declaration of funding
This study received funding from the European Union’s Horizon 2020 research and innovation programme under grant agreement no. 818309 (LEX4BIO). This output only reflects the authors’ views and the European Union cannot be held responsible for any use that may be made of the information contained herein. The funding source had no involvement in the study apart from providing financial support.
Author contributions
Lærke Wester-Larsen: conceptualisation, data curation, formal analysis, investigation, methodology, visualisation, writing – original draft preparation. Lars Stoumann Jensen: conceptualisation, funding acquisition, methodology, project administration, supervision, writing – review and editing. Johannes Lund Jensen: supervision, writing – review and editing. Dorette Sophie Müller-Stöver: conceptualisation, methodology, supervision, writing – review and editing.
Acknowledgements
Thanks to Beatriz Gómez Muñoz, Elinor Franziska Boos, Klara Cecilia Gunnarsen and Lars Munkholm for their guidance on methods. Thanks to Anita Schjødt Sandager, Gosha Sylvester, Ida Roos Friis, Jannie Jessen, Kim Møller Johansen, Lena Asta Byrgesen, Line Overgaard Bering, Maria Eide and Stig T. Rasmussen for their assistance in the laboratory and with the analysis of samples. Thanks to Helle Sørensen of the Data Science Lab in the Department of Mathematical Sciences for providing guidance on statistical analysis. Thanks to the BBF manufacturers for providing samples for this study (Agrana, AKV, Biovækst, Daka, Ecolan Oy, Fertikal, MeMon, Palaterra Betriebs- und Beteiligungsgesellschaft mbH, Solrød biogas and YARA).
References
Allan RP, Soden BJ (2008) Atmospheric warming and the amplification of precipitation extremes. Science 321, 1481-1484.
| Crossref | Google Scholar | PubMed |
Alvarenga P, Palma P, Mourinha C, Farto M, Dôres J, Patanita M, Cunha-Queda C, Natal-da-Luz T, Renaud M, Sousa JP (2017) Recycling organic wastes to agricultural land as a way to improve its quality: a field study to evaluate benefits and risks. Waste Management 61, 582-592.
| Crossref | Google Scholar | PubMed |
Amelung W, Zech W (1999) Minimisation of organic matter disruption during particle-size fractionation of grassland epipedons. Geoderma 92, 73-85.
| Crossref | Google Scholar |
Amundson R, Berhe AA, Hopmans JW, Olson C, Sztein AE, Sparks DL (2015) Soil and human security in the 21st century. Science 348, 1261071.
| Crossref | Google Scholar | PubMed |
Bhattacharyya P, Chakrabarti K, Chakraborty A (2003) Effect of MSW compost on microbiological and biochemical soil quality indicators. Compost Science & Utilization 11, 220-227.
| Crossref | Google Scholar |
Bünemann EK, Bongiorno G, Bai ZG, Creamer RE, De Deyn G, de Goede R, Fleskens L, Geissen V, Kuyper TW, Mäder P, Pulleman M, Sukkel W, van Groenigen JW, Brussaard L (2018) Soil quality - a critical review. Soil Biology and Biochemistry 120, 105-125.
| Crossref | Google Scholar |
Cai A, Xu H, Shao X, Zhu P, Zhang W, Xu M, Murphy DV (2016) Carbon and nitrogen mineralization in relation to soil particle-size fractions after 32 years of chemical and manure application in a continuous maize cropping system. PLoS ONE 11, e0152521.
| Crossref | Google Scholar | PubMed |
Chorom M, Rengasamy P, Murray RS (1994) Clay dispersion as influenced by pH and net particle charge of sodic soils. Soil Research 32, 1243-1252.
| Crossref | Google Scholar |
da Costa ACS, de Souza IG, Canton LC, Gil LG, Figueiredo R (2020) Contribution of the chemical and mineralogical properties of sandy-loam tropical soils to the cation exchange capacity. Revista Brasileira De Ciência Do Solo 44, e0200019.
| Crossref | Google Scholar |
D’Hose T, Cougnon M, De Vliegher A, Vandecasteele B, Viaene N, Cornelis W, Van Bockstaele E, Reheul D (2014) The positive relationship between soil quality and crop production: A case study on the effect of farm compost application. Applied Soil Ecology 75, 189-198.
| Crossref | Google Scholar |
Domingo-Olivé F, Bosch-Serra ÀD, Yague MR, Poch RM, Boixadera J (2016) Long term application of dairy cattle manure and pig slurry to winter cereals improves soil quality. Nutrient Cycling in Agroecosystems 104, 39-51.
| Crossref | Google Scholar |
Gómez-Muñoz B, Magid J, Jensen LS (2017) Nitrogen turnover, crop use efficiency and soil fertility in a long-term field experiment amended with different qualities of urban and agricultural waste. Agriculture Ecosystems & Environment 240, 300-313.
| Crossref | Google Scholar |
Gregorich EG, Wen G, Voroney RP, Kachanoski RG (1990) Calibration of a rapid direct chloroform extraction method for measuring soil microbial biomass C. Soil Biology and Biochemistry 22, 1009-1011.
| Crossref | Google Scholar |
Gutser R, Ebertseder T, Weber A, Schraml M, Schmidhalter U (2005) Short-term and residual availability of nitrogen after long-term application of organic fertilizers on arable land. Journal of Plant Nutrition and Soil Science 168, 439-446.
| Crossref | Google Scholar |
IPCC (2022) Summary for policymakers. In ‘Climate Change 2022: impacts, adaptation, and vulnerability’. (Eds DC Roberts, H-O Pörtner, ES Poloczanska, K Mintenbeck, M Tignor, A Alegría, M Craig, S Langsdorf, S Löschke, V Möller, A Okem). (Cambridge University Press: Cambridge, UK and New York, NY, USA)
Jensen JL, Schjønning P, Watts CW, Christensen BT, Peltre C, Munkholm LJ (2019) Relating soil C and organic matter fractions to soil structural stability. Geoderma 337, 834-843.
| Crossref | Google Scholar |
Jensen JL, Schjønning P, Watts CW, Christensen BT, Munkholm LJ (2020) Short-term changes in soil pore size distribution: Impact of land use. Soil and Tillage Research 199, 104597.
| Crossref | Google Scholar | PubMed |
Joergensen RG (1996) The fumigation-extraction method to estimate soil microbial biomass: Calibration of the kEC value. Soil Biology and Biochemistry 28, 25-31.
| Crossref | Google Scholar |
Karlen DL, Mausbach MJ, Doran JW, Cline RG, Harris RF, Schuman GE (1997) Soil quality: a concept, definition, and framework for evaluation. Soil Science Society of America Journal 61, 4-10.
| Crossref | Google Scholar |
Keller T, Håkansson I (2010) Estimation of reference bulk density from soil particle size distribution and soil organic matter content. Geoderma 154, 398-406.
| Crossref | Google Scholar |
Lavallee JM, Soong JL, Francesca Cotrufo M (2020) Conceptualizing soil organic matter into particulate and mineral-associated forms to address global change in the 21st century. Global Change Biology 26, 261-273.
| Crossref | Google Scholar | PubMed |
Lin Y, van Santen E, Watts D (2016) The effect of poultry litter application on agricultural production: a meta-analysis of crop yield, nutrient uptake and soil fertility. 28th Annual Conference Proceedings, Annual Conference on Applied Statistics in Agriculture, Kansas State Univeristy Libraries, New Praries Press. Available at https://www.researchgate.net/publication/324132239
Martinez E, Fuentes JP, Acevedo E (2008) Soil organic carbon and soil properties. Revista De La Ciencia Del Suelo Y Nutricion Vegetal 8, 68-96.
| Google Scholar |
Moinet GYK, Renske H, van Vuuren DP, Giller KE (2023) Carbon for soils, not soils for carbon. Global Change Biology 29, 2384-2398.
| Crossref | Google Scholar | PubMed |
Ofiti NOE, Zosso CU, Soong JL, Solly EF, Torn MS, Wiesenberg GLB, Schmidt MWI (2021) Warming promotes loss of subsoil carbon through accelerated degradation of plant-derived organic matter. Soil Biology and Biochemistry 156, 108185.
| Crossref | Google Scholar |
Peltre C, Nyord T, Bruun S, Jensen LS, Magid J (2015) Repeated soil application of organic waste amendments reduces draught force and fuel consumption for soil tillage. Agriculture, Ecosystems & Environment 211, 94-101.
| Crossref | Google Scholar |
Pezzolla D, Said-Pullicino D, Raggi L, Albertini E, Gigliotti G (2013) Short-term variations in labile organic C and microbial biomass activity and structure after organic amendment of arable soils. Soil Science 178, 474-485.
| Crossref | Google Scholar |
Pojasok T, Kay BD (1990) Assesment of a combination of wet sieving and turbidimetry to characterize the structural stability of moist aggregates. Canadian Journal of Soil Science 70, 33-42.
| Crossref | Google Scholar |
Sandén T, Spiegel H, Stuger HP, Schlatter N, Haslmayr HP, Zavattaro L, Grignani C, Bechini L, D’Hose T, Molendijk L, Pecio A, Jarosz Z, Guzman G, Vanderlinden K, Giraldez JV, Mallast J, Ten Berge H (2018) European long-term field experiments: knowledge gained about alternative management practices. Soil Use and Management 34, 167-176.
| Crossref | Google Scholar |
Schjønning P, de Jonge LW, Munkholm LJ, Moldrup P, Christensen BT, Olesen JE (2012) Clay dispersibility and soil friability—testing the soil clay-to-carbon saturation concept. Vadose Zone Journal 11, vzj2011.0067.
| Crossref | Google Scholar |
Schoumans OF, Ehlert PAI, Hanegraaf MC, Römkens PFAM, Pustjens AM, de Koeijer TJ, de Boer HC, Nienhuis C, Kortstee H, Smit AB (2019) Development of a conceptual framwork to evaluate organic fertilizers: assessment on soil quality and agronomic, environmental and economic aspects. Wageningen University and Research: Wageningen, The Netherlands.
Schröder JJ, Schulte RPO, Creamer RE, Delgado A, van Leeuwen J, Lehtinen T, Rutgers M, Spiegel H, Staes J, Toth G, Wall DP (2016) The elusive role of soil quality in nutrient cycling: a review. Soil Use and Management 32, 476-486.
| Crossref | Google Scholar |
Schröder JJ, Ten Berge HFM, Bampa F, Creamer RE, Giraldez-Cervera JV, Henriksen CB, Olesen JE, Rutgers M, Sandén T, Spiegel H (2020) Multi-functional land use is not self-evident for european farmers: a critical review. Frontiers in Environmental Science 8, 575466.
| Crossref | Google Scholar |
Setia R, Verma SL, Marschner P (2012) Measuring microbial biomass carbon by direct extraction – comparison with chloroform fumigation-extraction. European Journal of Soil Biology 53, 103-106.
| Crossref | Google Scholar |
Sinoga JDR, Pariente S, Diaz AR, Murillo JFM (2012) Variability of relationships between soil organic carbon and some soil properties in Mediterranean rangelands under different climatic conditions (South of Spain). Catena 94, 17-25.
| Crossref | Google Scholar |
van der Bom F, Magid J, Jensen LS (2019) Long-term fertilisation strategies and form affect nutrient budgets and soil test values, soil carbon retention and crop yield resilience. Plant and Soil 434, 47-64.
| Crossref | Google Scholar |
Wester-Larsen L, Müller-Stöver DS, Salo T, Jensen LS (2022) Potential ammonia volatilization from 39 different novel biobased fertilizers on the European market – A laboratory study using 5 European soils. Journal of Environmental Management 323, 116249.
| Crossref | Google Scholar | PubMed |
Yan F, Schubert S, Mengel K (1996) Soil pH increase due to biological decarboxylation of organic anions. Soil Biology and Biochemistry 28, 617-624.
| Crossref | Google Scholar |
Zavattaro L, Costamagna C, Grignani C, Bechini L, Spiegel A, Lehtinen T, Guzman G, Kruger J, D’Hose T, Pecio A, van Evert FK, ten Berge HFM (2015) Long-term effects of best management practices on crop yield and nitrogen surplus. Italian Journal of Agronomy 10, 47-50.
| Crossref | Google Scholar |
Zwijnenberg HJ, Kemperman AJB, Boerrigter ME, Lotz M, Dijksterhuis JF, Poulsen PE, Koops G-H (2002) Native protein recovery from potato fruit juice by ultrafiltration. Desalination 144, 331-334.
| Crossref | Google Scholar |