

Variable-rate nitrogen fertilisation to improve silage maize yield and crude protein using APSIM modelling
Iris Vogeler A B * , Christof Kluß B and Friedhelm Taube B
A
B
Abstract
Precision nitrogen (N) fertilisation, which considers variability in both near-future soil N supply and crop N demand, enables reductions in fertiliser use at the field level, while maintaining high yields and high crude protein (CP) content, and minimising N losses.
To determine optimum N fertilisation rates for silage maize (Zea mays) based on variability in soil organic carbon (SOC) and plant available water (PAW) of a 20-ha field, a simulation study using the APSIM model was set up.
APSIM was initially tested under Northern European conditions using measurements of biomass, CP and N leaching losses. The model was subsequently applied to determine optimal N rates, taking into account variability in SOC and PAW through different fertilisation scenarios. Model outputs were then used to calculate the required N rates to achieve a target CP of 6.6%, which is the critical value for maximising yield.
Compared to a blanket N application across the field, variable N rate application generally increased the proportion of the field achieving the target CP and reduced overall field-scale N leaching.
Process-based models like APSIM offer a valuable tool for determining optimal N fertilisation rates based on variability in soil properties. However, field testing is essential to validate the effectiveness of this approach under real conditions.
The simulations highlight that in sandy soils with high mineralisation potential due to past high organic matter inputs, N fertilisation should be avoided to meet the requirements of given environmental standards for water protection in the European Union.
Keywords: field-scale impacts, nitrate leaching, Northern Europe, plant available water, precision fertilisation, soil organic carbon, spatial variability.
Introduction
Maize (Zea mays L.) is now one of the most widely cultivated crops in central and north-western Europe, driven by its high yields, economic value and the diverse uses of its harvested products, including human nutrition, livestock feed and biogas production. Maize has a high nitrogen (N) use efficiency and the lowest N requirements per ton of dry matter (DM) of all relevant crops in Northern Europe (Greef et al. 1999). Despite its advantages, maize production systems are often linked to high N surpluses, with post-harvest soil mineral N levels reaching 100 kg N ha−1 (Schröder et al. 1998). This is partly due to maize’s ability to tolerate high slurry application rates without compromising yield or quality (Schröder et al. 2000; Nevens and Reheul 2005), combined with the fact that slurry often releases substantial amounts of N in autumn, when maize uptake is minimal (Pommel et al. 2006; Wachendorf et al. 2006). These elevated levels of soil mineral N in autumn present a significant risk for N leaching under Northern European conditions, particularly on sandy soils combined with excess rainfall during the autumn months (Nevens and Reheul 2005). This is further exacerbated by a low N uptake in spring due to the late time of sowing (around late April) and the slow early development of the crop and root system in north-western Europe (Schröder et al. 1998).
The extent of N leaching can often be reduced substantially by appropriate fertiliser application regimes. Precision fertilisation, which accounts for the spatial N supply by the soil, is a potential tool for reducing N losses. Many studies have used plant N concentrations, either via chlorophyll meter technology or remote sensing, to infer the spatial N supply by the soil. Linked with the critical N curve, the information can be used to adjust N fertilisation rates (Herrmann and Taube 2004). An alternative is to include the spatial potential mineralisation rate of the soil, which is closely related to soil organic carbon (SOC). The latter often shows high variability within fields. For example, Nannen et al. (2011) reported variations in SOC of 4.2–7.7% in a field in northern Germany with a sandy soil. High SOC contents are often associated with high post-harvest soil N and subsequent N leaching losses, as shown by Kayser et al. (2011) in a maize silage experiment on a sandy soil with 6.8% SOC and a high mineralisation potential. The authors concluded that fields with high SOC need improved management when used to cultivate maize silage. Compliance with various EU Directives – including the Nitrates Directive, the Water Framework Directive and the Marine Strategy Framework Directive – requires a significant reduction in nutrient losses from agricultural land in order to protect surface water, groundwater and marine environments from nutrient pollution. Eutrophication of enclosed coastal waters (e.g. Baltic Sea, North Sea and Mediterranean Sea), which is largely due to land-based nutrient discharges, is of special concern for several countries in Europe. Apart from reduced N inputs, the use of under-sown ryegrass in the maize crop, or the inclusion of ley pastures in the cropping cycle are useful measures to reduce N leaching losses (Komainda et al. 2018; Gollner et al. 2020; Kühling et al. 2023).
Deterministic models are increasingly being used to aid farm management and inform policy making and compliance, including the optimisation of fertilisers to improve crop productivity and environmental impacts (Manschadi et al. 2021). The Agricultural Production Systems sIMulator (APSIM) modelling framework has been widely used worldwide to simulate different crop performance and management effects on environmental impacts. The APSIM-Maize model was originally validated against datasets from tropical and sub-tropical Australia, semi-arid Kenya and USA. Only a few studies have used APSIM for simulating maize under European conditions (Knörzer et al. 2011; Manschadi et al. 2021), and even less for maize silage under Northern European conditions (Morel et al. 2020; Alderkamp et al. 2022; Kumar et al. 2022). These modelling studies have indicated several shortcomings of the APSIM-Maize model, including the radiation use efficiency at higher latitudes and residual N affects from previous crops, especially leys. Thus, before the APSIM model can be used to aid strategic fertilisation based on soil properties, such as the organic matter content, further testing of the APSIM-Maize model is required.
The objectives of this paper were to first test the APSIM-Maize model regarding silage biomass, crude protein (CP) and N leaching based on two different N fertilisation strategies and different experiments carried out in Central/Northern Europe. The model was then used to simulate and investigate the effect of variable rate N application to maize based on the soil organic matter content and plant available water (PAW) content of the soil. For this, the model was run for three contrasting climatic years, with range of annual rainfall of 734–1067 mm and of average annual temperature of 8.2–9.3°C.
Materials and methods
Experimental sites and methods
To test the reliability of the APSIM-Maize model for Northern European conditions, we used data from four different field experiments, located either in northern Germany or Denmark. These experiments were chosen to evaluate various aspects of the model, including the dynamics of biomass accumulation and N uptake and dilution during crop development, breeding progress as well as N leaching losses as dependent on N fertilisation rates. The experiments were carried out during 1997–2021, with measurements including temporal biomass development, final silage yield maize and CP, N leaching and one experiment with cultivars released in different years. A summary of the various sites and experimental set-ups is provided in Table 1, and a short description of the four experiments is provided below.
| Location | Location | Year | RF (mm) | Temp (°C) | Soil type | OC (%) | PAW (mm) | Pre-crop | N fert | N rate (kg ha−1) | |
|---|---|---|---|---|---|---|---|---|---|---|---|
| Ostenfeld | 54.19°N 9.48°E | 2015 and 2016 | 847 (1007; 766)* | 8.9 (9.7; 9.6)* | Loamy sand/sandy loam; gleyic podzol | 1.20 | 80 | Winter wheat and sorghum | Mineral N | 180 | |
| Ostenfeld | 54.19°N 9.48°E | 2012 and 2013 | 847 (836; 764)* | 8.9 (8.7; 8.7)* | Loamy sand/sandy loam; gleyic podzol | 1.20 | 80 | Winter wheat and maize | Mineral N | 0 and 180 | |
| Karkendamm | 53.85°N 9.85°E | 1997–1999 | 866 (786; 1098; 712)* | 8.6 (9.2; 8.6; 9.2)* | Sandy sand; gleyic podzol | 3.49 | 50 | Maize | ±Slurry and ±Mineral N | 0–250 | |
| Agerskov | 55.06°N 9.13°E | 2021 | 1080 (932)* | 8.7 (15.1)* | Coarse sandy; humic cambisol | 2.00 | 50 | Maize | ±Slurry and mineral N | 0–225 | |
| Tinglev | 54.98°N 9.19°E | 2021 | 758 (932)* | 8.5 (14.8)* | Coarse sandy; humic cambisol | 1.74 | 50 | Spring barley | ±Slurry and mineral N | 0–250 |
*Values for the experimental years.
In this experiment, 10 different hybrids, which were certified during 1971–2012, were grown in field plots at the experimental farm ‘Ostenfeld’ over two consecutive years: 2015 and 2016. The farm is located in the Eastern Upland part of Schleswig-Holstein, northern Germany (54°19′N, 9°48′E). This experiment was included here to test if the APSIM model can capture the observed yield increases over time due to changes in climatic conditions and breeding progress (Taube et al. 2020). This was needed, as the experiments included for the testing were from a wide time period, spanning 1997–2022. Only two of the 10 hybrids were used here: ‘Mutin’ (released 1980) and ‘LG30224’ (released 2012). The maize was sown on 11 May 2015 and on 9 May 2016, and harvested at silage maturity on 26 October 2015 and 26 September 2016. The N fertiliser was applied at a rate of 180 kg N ha−1. The CP was determined by near-infrared spectroscopy [NIRS; NIR-Systems 5000 monochromator (Perstrop Analytical Inc., Silver Spring, MD, USA)] according to Volkers et al. (2003). Further experimental details can be found in Taube et al. (2020).
This experiment involved two different treatments: a maize crop with no N fertilisation and a maize catch-crop system that received N fertiliser at a rate of 180 kg ha−1. The catch crop was rye (Secale cereale L. cv. ‘Protector’), which was sown after the harvest of maize. The experiment was conducted over two different years, with maize sown in April 2012 and 2013 and harvested in October 2012 and 2013. Different hybrids, from different maturity groups were used, but only ‘Suleyka’, a hybrid from the early maturity group was used here. Prior to the experiment, the site was cropped with winter wheat (Triticum aestivum L.) and maize, with no organic fertiliser applied for more than 10 years. Further details are provided in Komainda et al. (2018). Nitrate (NO3-N) leaching was measured by suction cups installed at a depth of 0.75 m and at an angle of 60° to minimise preferential flow. The NO3-N leaching was calculated by interpolating measured N concentrations to obtain daily concentrations, and then multiplying these by the amount of drainage water calculated by a climatic water balance model, using weather and soil data gathered from the experimental site, with evapotranspiration calculated according to Wendling (1995). The CP was determined by NIRS as described above.
These experiments were carried out at the research farm ‘Karkendamm’, located in the Geest region of Schleswig-Holstein, northern Germany. The soil is classified as a highly permeable, gleyic podzol. Experiments with increasing N fertilisation rates were carried out over a period of three years: 1997–1999. The maize hybrid ‘Naxos’, released in 1987 was used. The pre-crop in 1996 was also silage maize, with cattle slurry applied at a rate of 40 m3 ha−1. Different treatments, with different rates and combinations of mineral N and organic N (cattle slurry) were set up continuously over the 3-year period. Cattle slurry was applied at rate of nil, 20 m3 ha−1 (targeting 50 kg N ha−1) or 40 m3 ha−1 (targeting 100 kg N ha−1) and to each of these, mineral N fertiliser was applied in separate treatments at rates of 0, 50, 100 and 150 kg N ha−1. This resulted in a total of 12 treatments, with four replicates per treatment. Slurry was applied at the end of April, and mineral N was applied in two splits, with the first in mid-May and the second in mid-June. To measure NO3-N leaching, suction cups were installed at a depth of 60 cm, and the amount of drainage was calculated as described above. The CP content of the silage biomass was determined using NIRS. Further experimental details are provided in Büchter et al. (2003).
The data from Agerskov and Tinglev, Denmark, are from national maize field trials, carried out in 2021. The soils at both sites are coarse sand, classified as JB1 according to the Danish Soil Classification. The maize crops were sown in late April and the maize for silage was harvested at silage maturity in early October (BBCH stage ~8.5). Ryegrass (Lolium perenne L.) was under-sown at the end of June as a catch crop on both sites. The pre-crop was maize at Agerskov and spring barley at Tinglev. In total, 14 different N fertilisation treatments were set up, with different amounts of N applied in form of slurry and mineral N fertiliser, and with slurry applied at different times of the year. Additionally, a start application with mineral fertiliser of 22 kg N ha−1 was applied at sowing. Of these 14 different treatments, seven were used for the simulation study (Table 2). The operational management is provided in the Supplementary materials (Table S1).
The CP was determined by NIRS at a commercial feed-testing laboratory (Eurofins Steins Laboratorium, Denmark). The N yield of the silage maize (or N in the aboveground DM) was calculated by dividing the CP by 6.25 (to provide the N content), and multiplying the biomass with the N content. The NO3-N leaching was measured by suction cups installed at a depth of 0.75 m, with drainage calculated using the water balance model EVACROP (Olesen and Heidmann 1990).
APSIM model set-up
The simulations were performed using the APSIM modelling framework, ver. 7.10 (www.apsim.info). Modules that are particularly relevant include SoilN to simulate soil carbon (C) and N transformations, the APSIM-SoilWat model for simulating the water movement, and the crop models APSIM-Maize, APSIM-Barley and APSIM-weed (for simulating under-sown ryegrass). A series of manager scripts were used to describe the crop management, including sowing, the application of fertiliser, ploughing and harvesting for silage, which was done at Code Stage 8.4–8.5 to match experimental harvest days with simulations. For simulating maize, the APSIM-Maize model with the cultivar ‘early’ was used. A few adaptations regarding phenological development were made, similar to those determined by Alderkamp et al. (2022) for north-western Europe conditions. To increase the CP in accordance with measurement ranges from Denmark and the literature, the target stem N concentration and structural N concentrations at some of the phenological stages were increased (see Table S2). For spring barley, the cultivar ‘Oxford’ was used, with slight adaptations for Danish cultivars (Vogeler et al. 2023). In the SoilN module, the optimal temperature for soil organic matter mineralisation was set to 20°C. For all other model parameters default values were used.
For the experimental sites, APSIM simulations were set up according to the management such as sowing, tillage and fertilisation timings, including slurry application using manager scripts. Daily meteorological data were obtained from the nearest available weather station (Table 1), and soil profiles were created in APSIM based on available soil information, ensuring the provided PAW values for the various sites (Table 1).
To investigate the effect of variable rate N application based on different soil characteristics, namely SOC and its effect on PAW, APSIM simulations were set up based on the experiments carried out in Agerskov. Based on measurements of a 20-ha field, the SOC was varied in the range of 0.75–5.75% in the topsoil, and these were put into eight categories with intervals ranging within 0.5–1% SOC (Table S3). Three different scenarios were set up, with either the SOC varying over the entire soil depth (Scenario A), the SOC only varying in the topsoil (Scenario B) and including the effect of SOC on PAW of the soil (Scenario C). For this, the PAW was increased by 10 mm per 100 mm of soil depth for each 1% increase in SOC, based on measurements from coarse-textured soils (Bagnall et al. 2022). Apart from differences in SOC, different N fertilisation rates were set up (0, 45, 90, 135, 180, 225 and 270 kg N ha−1) and applied as slurry. These simulations were set up for three contrasting climatic years (2014, 2016 and 2021), based on meteorological stations in southern Denmark. The year 2014 was wet and warm with an annual RF of 1067 mm and average annual temperature (T) of 9.3°C; 2016 was colder and drier with 734 mm RF and T of 8.7°C, and 2021 had RF of 932 mm and T of 8.2°C. Additionally, the very dry year of 2018 was simulated (RF of 610 mm), but simulation results showed CP concentrations of the silage maize of up to 30% at the highest SOC content and the highest N rate. Maximum CP values of silage maize have been reported as about 10% in the Nordic Field Trial System (https://nfts.dlbr.dk/). Thus, it is concluded that for such dry years with annual RF of only 600 mm and relative warm conditions with an average of 9°C, the model needs to be refined. All simulations were set up with a spin-up period of 1 year, and to capture N leaching the simulations ended at the end of March in the following year.
Statistical evaluation and data analysis
The performance of APSIM was assessed using common statistical indexes (Moriasi et al. 2007), including the coefficient of determination (R2), the Nash–Sutcliffe efficiency score (NSE), the root mean square error (RMSE), the relative RMSE and percent bias (PBIAS). The NSE score compares the predicted mean square error with the variance of the observations. A positive NSE indicates that the model has more predictive power than applying the mean of the observed values. The RMSE is an indication for the absolute error between the observed and simulated numbers. The RMSE values can extend from zero to infinity, but when they approach zero, the residual estimation error is decreased. For PBIAS the optimal value is 0, a positive value indicates that the model tends to underestimates the measured values whereas a negative value indicates an overestimation.
For the APSIM modelling for variable rate N applications, second-order polynomial functions were fitted to the APSIM simulated biomass, biomass N, CP and N leaching (denoted as Y) as a function of the N fertilisation rate (Nr; kg ha−1):
where a, b and c are fitting parameters. The fitting was done separately for the various SOC categories, years and scenarios, with fitted parameter values for the various treatments provided in the Supplementary Table S4.
To calculate the amount of slurry N required for the various areas in the field to achieve a target CP (CPT), the equation was solved using the following:
To estimate the amount of slurry N to be applied to various areas of the field, such that the annual average N concentrations in the drainage water remain below the critical drinking water standard of 11.3 mg NO3-N L−1, Eqn 1 was solved using using the following:
With the constraint that the field scale N leaching (NleachFS; kg ha−1) is at or below the critical N load (Ncrit; kg ha−1):
where Nleachi (kg ha−1) is the N leaching from the various areas with different SOC contents, and Ai is the proportional respective area. The Ncrit depends on the annual drainage amount (D; mm), where DWS is the critical drinking water standard and can be calculated using the following:
Results
Modelling of experimental sites
The adaptations related to phenological development (Alderkamp et al. 2022) resulted in accurate predictions of silage harvest dates across the experimental sites, with differences of only 1–3 days between the predicted and actual harvests. To capture the observed breeding progress of maize hybrids with a lower radiation interception and radiation use efficiency (RUE) of older compared with newer hybrids (Taube et al. 2020), the RUE was adapted for the various experiments. For the experiment carried out in Karkendamm during 1997–1999 with a hybrid released in 1987, RUE was set to 1.6 g MJ−1, whereas for the other experiments RUE was set to 2.0 g MJ−1.
The APSIM model generally provided good predictions of biomass development for the two cultivars, LG30224 and Mutin, across both years (Fig. 1). This indicates that the differences between the hybrids, attributable to breeding progress, can be captured through adjustments to RUE. While the initial drop in CP was too high, the final values at silage harvest were predicted well by the model.
Measured (symbols) and predicted (lines) temporal silage biomass development (a and b) and crude protein content (c and d) for two different cultivars: LG30224 (black symbols and lines) and Mutin (grey symbols and lines) grown in two different years (2015 (a and c) and 2016 (b and d)) in Ostenfeld, Germany. The cultivar LG30224 was released in 2012, and Mutin in 1980.

APSIM predicted temporal development of the silage biomass for the two different treatments, with and without N fertilisation, and also well predicted this for the two different years (Fig. 2). Similarly to the other experiment, the drop in CP was too early, but final CP values at harvest of the silage were well predicted for both fertilisation levels and years.
Measured (symbols) and predicted (lines) temporal silage biomass development (a and b) and crude protein content (c and d) without N fertilisation (grey symbols and lines) and with N fertilisation of 180 kg N ha−1 (black symbols and lines) grown in two different years (2012 (a and c) and 2013 (b and d)) in Ostenfeld, Germany.

Measured and predicted biomass at silage maturity over the wide range of N application rates, with slurry N of 0, 50 and 100 kg N, in combination with mineral N fertilisation at rates of 0–150 kg N ha−1 agreed reasonably well, with R2 of 0.83 and RMSE of 1.7 t ha−1 (Fig. 3). The discrepancy is partly due to the large variability between replicates, with large standard deviations. The CP was not well simulated by APSIM, with R2 of 0.12 and PBIAS of −6.9%, indicating model overestimation.
Measured and APSIM predicted (a) silage biomass at harvest and (b) crude protein (CP) of silage biomass in Karkendamm, either without slurry (Manure_0), slurry application of 20 m3 ha−1 (targeting 50 kg N ha−1) or 40 m3 ha−1 (targeting 100 kg N ha−1), and mineral N fertiliser at rates ranging within 0–150 kg N ha−1 year−1. Also shown are standard deviations. The experiments were done in 1997, 1998 and 1999.

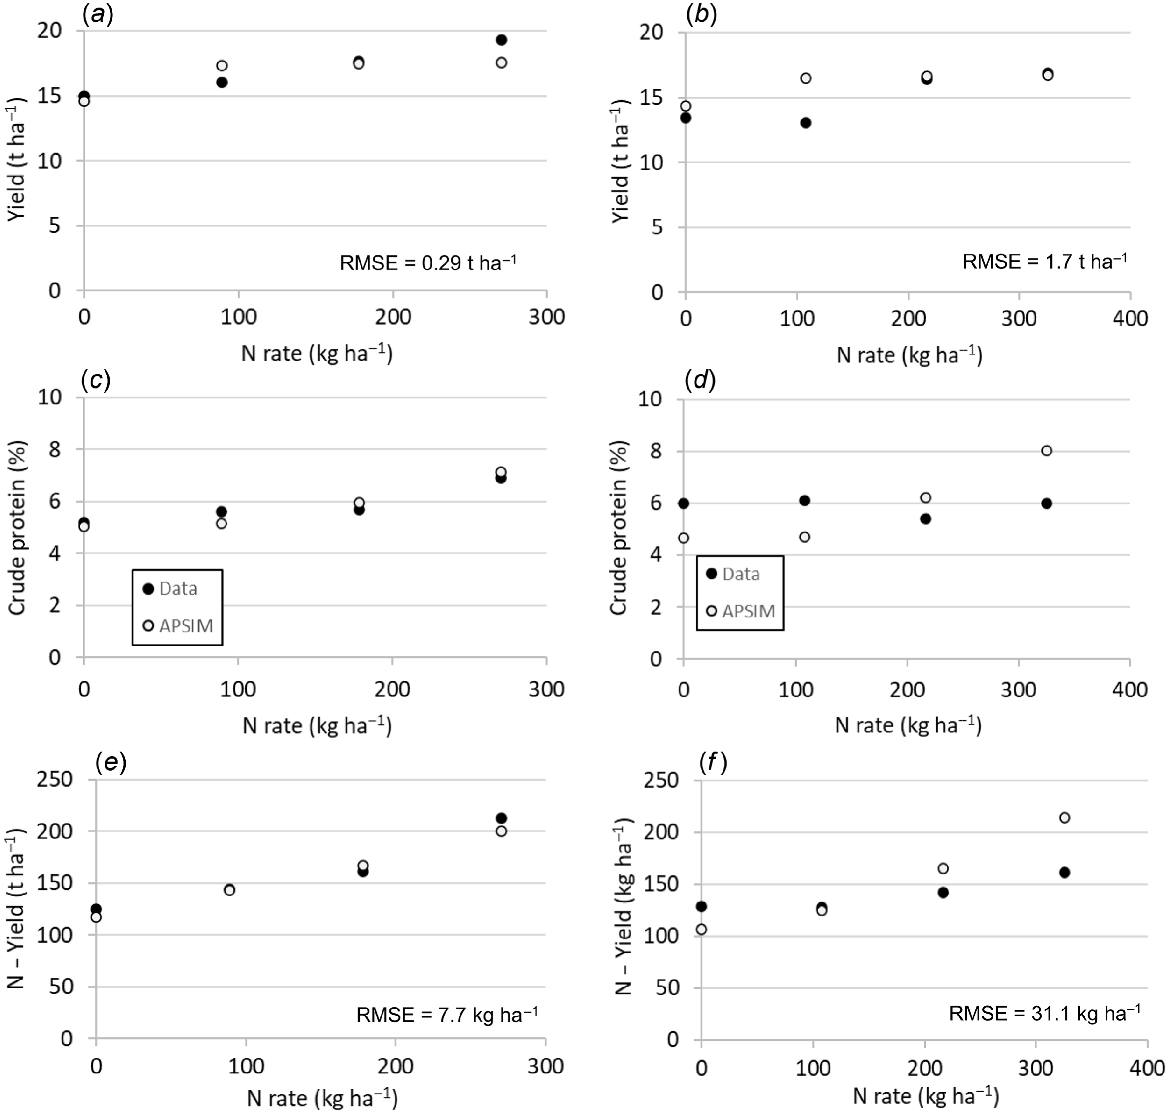
At Agerskov silage yield was well predicted, apart from a slight underprediction at the highest fertilisation of 270 kg N ha−1 (Fig. 4) and RMSE of 290 kg DM ha−1. The N yield and CP for the various N fertilisation rates were also well predicted, with RMSE of N yield of 7.7 kg N ha−1. Yields at Tinglev for the different fertilisation rates were also well predicted, with the higher RMSE of 1765 kg DM ha−1 being due to the low measurement at the intermediate fertilisation rate of 108 kg N ha−1. Measurements showed no response of the fertilisation rate on N-yield at Tinglev, while APSIM predicted increasing N uptake with increasing N fertilisation rate, resulting in a higher RMSE of 7.7 kg N ha−1. This lack of response was also reflected in the CP, with almost no response measured, whereas APSIM predicted an increase from 4.7% without N fertilisation to 8% at a N rate of 150 kg ha−1.
The pattern for temporal N leaching from the various N treatments, with slurry applied at rates of 0, 50 and 100 kg N ha−1 and mineral N ranging within 0–150 kg N ha−1 was generally well predicted by APSIM, as shown for two contrasting treatments in Fig. 5. In some treatments, the temporal N leaching was not well captured by the model, which resulted in poor model performance regarding cumulative annual N leaching amounts, with R2 of 0.4, RMSE of 15.6 kg N ha−1 and relative RMSE of 0.7. The model agreement was better when considering the entire experimental period and the cumulative N leaching over 3 years, with R2 of 0.81, RMSE of 15 kg N ha−1 and relative RMSE of 0.25 (Fig. 6).
Measured and APSIM predicted cumulative N leaching under silage maize in Karkendamm with (a) receiving no slurry and mineral N fertiliser at a rate of 50 kg N ha−1 year−1 and (b) receiving slurry with 100 kg N ha−1 year−1 and mineral N fertiliser at a rate of 150 kg N ha−1 year−1.

Measured and APSIM predicted cumulative N leaching under silage maize in Karkendamm, either without slurry (Manure_0), slurry application of 20 m3 ha−1 (targeting 50 kg N ha−1) or 40 m3 ha−1 (targeting 100 kg N ha−1), and mineral N fertiliser at rates ranging within 0–150 kg N ha−1 year−1. Also shown are standard deviations.

Cumulative N leaching for all N fertilisation rates was higher at Agerskov than at Tinglev, apart from the treatment without N fertilisation (Fig. 7). This could be the effect of the pre-crop, which was maize in Agerskov and spring barley in Tinglev. Other reasons could be the higher rainfall at Agerskov, and/or the higher SOC, which would increase N mineralisation.
Measured (solid lines) and predicted (broken lines) cumulative N leaching in Agerskov (a and b) and Tinglev (c and d), depending either on the N fertilisation rate (with 1 N equal to 178 kg N ha−1 in Agerskov and 217 kg N ha−1 in Tinglev) or the time of slurry application.

Cumulative and temporal N leaching in Agerskov was very well predicted for the different N rates, apart from the 1.5N, where measurements showed N leaching equivalent to the amount of N applied via slurry and mineral N (Fig. 7a). In contrast, APSIM predicted that some of the applied N at this high rate is taken up by the plants, as is also the case for the other N rate treatments. The effect of timing of slurry application on N leaching was not as well predicted (Fig. 7b). While measurements showed lower leaching from slurry application in June compared with the other timings, the model predicted about the same leaching for all application dates. Similarly to the measurements, the model predicted a delayed leaching for slurry application in May and June, but less pronounced.
The N leaching from Tinglev was similarly well predicted for the various N rates (Fig. 7c), apart from an earlier start of N leaching from the highest N rate compared to measurements. As for Agerskov, the temporal pattern of N leaching for the different application dates was not well captured by the model (Fig. 7d).
For comparison of measured and predicted cumulative N leaching across both sites, N application rates and slurry application timing showed good prediction, with R2 of 0.76 and RMSE of 33.9 kg N ha−1 (Fig. 8). Separating the data for N rates only increases R2 to 0.92, with a similar RMSE of 38.2 kg N ha−1, and further separation for slurry application timing only showed a low R2 of 0.26 but a low RMSE of 24.7 kg N ha−1.

Over the entire datasets (all four experiments) the prediction of silage biomass was good, with R2 of 0.77, RMSE of 1.6 t ha−1 and NSE of 0.7 (Fig. 9a). Across all datasets, the CP was not well described with R2 of 0.2, RMSE of 1.2 and NSE of 0.1 (Fig. 9b). This discrepancy is largely due to the general overestimation of CP in the Karkendamm experiment, performed during 1997–1999 and using a cultivar released in 1987. Newer cultivars possessing the so-called stay-green trait exhibit higher N uptake after silking, as demonstrated by Mueller and Vyn (2016) in comparisons between older hybrids (released up to 1990) and more recent ones. Excluding the Karkendamm data for CP revealed a much better model performance, with R2 of 0.51, RMSE of 1 and NSE of 0.5. Cumulative N leaching was also well predicted with R2 of 0.89, NSE of 0.8 and RMSE of 21.9 kg ha−1 (Fig. 9c).

APSIM simulations for variable rate N application
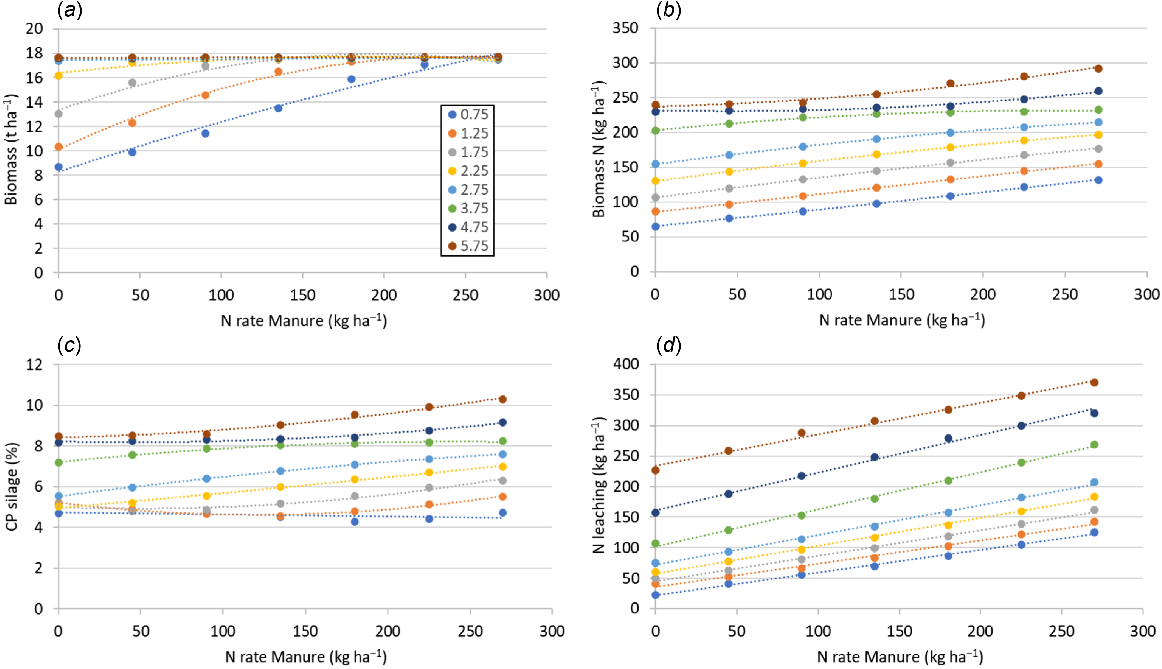
Among the simulations for Agerskov for 2021, Scenario A showed an increase in silage biomass, biomass N and CP with increased slurry-N application, as well as with increasing SOC (Fig. 10). For biomass, the effect of slurry-N rate diminished at SOC of 3% for the simulations done with increase in SOC only, but continued to increase when PAW was adjusted in accordance with SOC (Table S1). Increasing rates of slurry-N fertilisation and SOC also increased N leaching.
APSIM-simulated maize silage yield, crude protein (CP) and N leaching based on the SOC in the topsoil and the N fertilisation rate for Scenario A (a–c) with differences in SOC over the entire soil profile, and Scenario C (d–f) with differences in SOC in the topsoil only and according changes in PAW. Simulations were done for 2021.
These various simulations outputs (biomass yield, biomass N, CP and N leaching) were fitted to the second-order polynomial equation (Eqn 1), separately for the three years and three different scenarios. Fitting results are provided in the Table S3.
To determine the effect of variable rate N application with the aim of achieving a target silage maize CP of 6.6% (Struck and Reinsch 2019), the parameter values obtained for CP were used in Eqn 2 to determine the required N rate dependent on SOC and PAW (different scenarios). This was again done separately for the three different years. To avoid excessive N application at low SOC, with low mineralisation rates, the maximum N rate was set to 270 kg N ha−1.
The effects of variable-rate N application were compared to those of a uniform blanket application of 200 kg N ha−1, with respect to biomass yield, biomass N content, CP and N leaching at the field scale, based on SOC measurements across a 20-ha field. In 2014, variable N rate application based on variations in SOC over the entire soil depth (Scenario A) increased the proportion of the field with a CP ≥6.6 from 20% (uniform application) to 50% of the field with very similar silage biomass and N leaching (Table 3). When only the SOC in the topsoil across the field was varied (Scenario B) the proportion increased from 30% to 50% of the field. However, this was achieved through an increase in field-scale N application rate, and slightly increased N leaching. When both SOC and PAW were varied across the field (Scenario C), the field-scale N application rate was decreased with the same yield and similar leaching compared with the uniform application rate. In 2016, variable rate fertilisation decreased the field-scale N rate in all scenarios by almost 20% with no effect on biomass yield and increases in the proportion of the field with a CP with ≥6.6%, and a reduction in N leaching (Table 4). In 2021, similar results were obtained with a decrease in field-scale N fertiliser rate, similar or increased biomass, increases in CP and decreases in N leaching compared with the uniform application rate (Table 5).
| % field | Variable N rate | Uniform N rate | |||||||||||
|---|---|---|---|---|---|---|---|---|---|---|---|---|---|
| N rate | Biomass | N yield | CP | N leach | N rate | Biomass | N yield | CP | N leach | ||||
| 2014, Scenario A | 0.75 | 10 | 270 | 16.7 | 128 | 5.2 | 112 | 200 | 15.6 | 108 | 3.3 | 93 | |
| 1.25 | 15 | 270 | 16.2 | 147 | 5.4 | 142 | 200 | 16.7 | 128 | 3.9 | 118 | ||
| 1.75 | 25 | 270 | 16.2 | 160 | 6.0 | 172 | 200 | 16.6 | 143 | 5.3 | 146 | ||
| 2.25 | 20 | 251 | 16.4 | 172 | 6.6 | 215 | 200 | 16.5 | 160 | 5.7 | 190 | ||
| 2.75 | 10 | 191 | 16.4 | 176 | 6.6 | 227 | 200 | 16.4 | 178 | 5.9 | 232 | ||
| 3.75 | 10 | 53 | 16.4 | 173 | 6.6 | 204 | 200 | 16.4 | 218 | 8.3 | 266 | ||
| 4.75 | 5 | 0 | 16.3 | 196 | 7.5 | 233 | 200 | 16.3 | 258 | 9.9 | 318 | ||
| 5.75 | 5 | 0 | 16.4 | 236 | 9.0 | 285 | 200 | 16.4 | 298 | 11.4 | 372 | ||
| Field scale | 210 | 16.3 | 166 | 50%* | 188 | 200 | 16.4 | 165 | 20%* | 186 | |||
| 2014, Scenario B | 0.75 | 10 | 270 | 16.3 | 140 | 5.5 | 154 | 200 | 16.4 | 120 | 4.7 | 123 | |
| 1.25 | 15 | 270 | 16.2 | 150 | 5.5 | 181 | 200 | 16.7 | 133 | 5.0 | 144 | ||
| 1.75 | 25 | 270 | 16.2 | 162 | 6.1 | 201 | 200 | 16.6 | 145 | 5.5 | 164 | ||
| 2.25 | 20 | 264 | 16.3 | 172 | 6.6 | 214 | 200 | 16.4 | 158 | 6.0 | 184 | ||
| 2.75 | 10 | 204 | 16.4 | 172 | 6.6 | 207 | 200 | 16.4 | 171 | 6.6 | 205 | ||
| 3.75 | 10 | 110 | 16.4 | 174 | 6.6 | 203 | 200 | 16.4 | 200 | 7.6 | 242 | ||
| 4.75 | 5 | 13 | 16.4 | 173 | 6.6 | 197 | 200 | 16.4 | 231 | 8.8 | 277 | ||
| 5.75 | 5 | 0 | 16.4 | 199 | 7.6 | 228 | 200 | 16.4 | 261 | 10.0 | 314 | ||
| Field scale | 220 | 16.3 | 162 | 50%* | 198 | 200 | 16.5 | 162 | 30%* | 186 | |||
| 2014, Scenario C | 0.75 | 10 | 270 | 14.6 | 97 | 4.1 | 195 | 200 | 13.5 | 88 | 4.1 | 153 | |
| 1.25 | 15 | 270 | 16.1 | 133 | 5.2 | 193 | 200 | 16.2 | 118 | 4.6 | 156 | ||
| 1.75 | 25 | 270 | 16.1 | 154 | 5.8 | 206 | 200 | 16.5 | 139 | 5.3 | 166 | ||
| 2.25 | 20 | 194 | 16.5 | 173 | 6.6 | 187 | 200 | 16.5 | 174 | 6.7 | 189 | ||
| 2.75 | 10 | 131 | 16.7 | 182 | 6.6 | 171 | 200 | 16.7 | 206 | 7.5 | 195 | ||
| 3.75 | 10 | 14 | 17.5 | 185 | 6.6 | 157 | 200 | 17.5 | 266 | 9.5 | 218 | ||
| 4.75 | 5 | 0 | 18.6 | 225 | 7.5 | 177 | 200 | 18.6 | 317 | 10.6 | 240 | ||
| 5.75 | 5 | 0 | 19.4 | 267 | 8.6 | 202 | 200 | 19.4 | 361 | 11.7 | 263 | ||
| Field scale | 189 | 16.5 | 164 | 50%* | 189 | 200 | 16.5 | 177 | 50%* | 185 | |||
For the variable rate application, the N rate was calculated for achieving a target CP of 6.6%, for the uniform N application a rate of 200 kg N ha−1 was used. * Indicates the percentage of the field for which the target CP of 6.6% was achieved. Bold data show field scale aggregated data.
| % field | Variable N rate | Uniform N rate | |||||||||||
|---|---|---|---|---|---|---|---|---|---|---|---|---|---|
| N rate | Biomass | N yield | CP | N leach | N rate | Biomass | N yield | CP | N leach | ||||
| 2016, Scenario A | 0.75 | 10 | 270 | 14.0 | 121 | 5.5 | 74 | 200 | 13.9 | 105 | 3.5 | 61 | |
| 1.25 | 15 | 270 | 14.0 | 141 | 6.4 | 100 | 200 | 14.1 | 124 | 4.2 | 83 | ||
| 1.75 | 25 | 227 | 14.2 | 150 | 6.6 | 120 | 200 | 14.3 | 142 | 5.9 | 111 | ||
| 2.25 | 20 | 155 | 14.1 | 149 | 6.6 | 120 | 200 | 14.1 | 161 | 7.0 | 138 | ||
| 2.75 | 10 | 89 | 14.1 | 150 | 6.6 | 115 | 200 | 14.1 | 179 | 7.5 | 168 | ||
| 3.75 | 10 | 0 | 14.1 | 159 | 7.2 | 115 | 200 | 14.1 | 218 | 9.1 | 214 | ||
| 4.75 | 5 | 0 | 14.1 | 193 | 8.6 | 161 | 200 | 14.1 | 257 | 11.3 | 245 | ||
| 5.75 | 5 | 0 | 14.1 | 232 | 10.3 | 201 | 200 | 14.1 | 296 | 13.0 | 284 | ||
| Field scale | 164 | 14.1 | 153 | 75%* | 118 | 200 | 14.1 | 164 | 50%* | 139 | |||
| 2016, Scenario B | 0.75 | 10 | 270 | 14.0 | 132 | 5.8 | 128 | 200 | 14.1 | 116 | 5.0 | 97 | |
| 1.25 | 15 | 247 | 14.1 | 142 | 6.6 | 130 | 200 | 14.2 | 130 | 5.9 | 110 | ||
| 1.75 | 25 | 216 | 14.2 | 149 | 6.6 | 129 | 200 | 14.2 | 145 | 6.4 | 123 | ||
| 2.25 | 20 | 165 | 14.2 | 149 | 6.6 | 122 | 200 | 14.2 | 159 | 7.0 | 137 | ||
| 2.75 | 10 | 113 | 14.0 | 150 | 6.6 | 115 | 200 | 14.0 | 173 | 7.6 | 153 | ||
| 3.75 | 10 | 0 | 14.1 | 146 | 6.6 | 92 | 200 | 14.1 | 202 | 8.7 | 181 | ||
| 4.75 | 5 | 0 | 14.1 | 170 | 7.6 | 125 | 200 | 14.1 | 232 | 10.2 | 208 | ||
| 5.75 | 5 | 0 | 14.1 | 197 | 8.7 | 156 | 200 | 14.1 | 262 | 11.6 | 240 | ||
| Field scale | 162 | 14.1 | 149 | 90%* | 124 | 200 | 14.2 | 161 | 50%* | 140 | |||
| 2016, Scenario C | 0.75 | 10 | 270 | 12.7 | 101 | 4.6 | 155 | 200 | 12.5 | 91 | 4.4 | 117 | |
| 1.25 | 15 | 270 | 13.7 | 141 | 6.3 | 149 | 200 | 13.8 | 125 | 5.5 | 115 | ||
| 1.75 | 25 | 216 | 14.2 | 149 | 6.6 | 129 | 200 | 14.2 | 145 | 6.4 | 123 | ||
| 2.25 | 20 | 158 | 14.5 | 153 | 6.6 | 115 | 200 | 14.5 | 165 | 7.1 | 132 | ||
| 2.75 | 10 | 100 | 14.9 | 160 | 6.6 | 99 | 200 | 15.0 | 193 | 8.0 | 136 | ||
| 3.75 | 10 | 0 | 16.1 | 168 | 6.6 | 81 | 200 | 16.1 | 253 | 9.7 | 146 | ||
| 4.75 | 5 | 0 | 16.8 | 211 | 7.8 | 104 | 200 | 16.8 | 304 | 11.3 | 162 | ||
| 5.75 | 5 | 0 | 17.4 | 254 | 9.1 | 120 | 200 | 17.4 | 350 | 12.5 | 176 | ||
| Field scale | 163 | 14.6 | 155 | 75%* | 123 | 200 | 14.6 | 174 | 50%* | 131 | |||
For the variable rate application, the N rate was calculated for achieving a target CP of 6.6%, for the uniform N application a rate of 200 kg N ha−1 was used. * Indicates the percentage of the field for which the target CP of 6.6% was achieved. Bold data show field scale aggregated data.
| % field | Variable N rate | Uniform N rate | |||||||||||
|---|---|---|---|---|---|---|---|---|---|---|---|---|---|
| N rate | Biomass | N yield | CP | N leach | N rate | Biomass | N yield | CP | N leach | ||||
| 2021, Scenario A | 0.75 | 10 | 270 | 22.3 | 132 | 4.7 | 122 | 200 | 18.2 | 115 | 4.7 | 96 | |
| 1.25 | 15 | 270 | 19.8 | 156 | 5.1 | 138 | 200 | 18.7 | 138 | 5.0 | 112 | ||
| 1.75 | 25 | 270 | 18.8 | 179 | 6.1 | 158 | 200 | 18.8 | 161 | 5.7 | 129 | ||
| 2.25 | 20 | 215 | 17.7 | 186 | 6.6 | 155 | 200 | 17.7 | 182 | 6.5 | 148 | ||
| 2.75 | 10 | 124 | 17.6 | 186 | 6.6 | 132 | 200 | 17.6 | 203 | 7.2 | 170 | ||
| 3.75 | 10 | 0 | 17.6 | 208 | 7.4 | 102 | 200 | 17.6 | 229 | 8.1 | 223 | ||
| 4.75 | 5 | 0 | 17.6 | 226 | 8.0 | 162 | 200 | 17.7 | 246 | 8.7 | 284 | ||
| 5.75 | 5 | 0 | 17.6 | 232 | 8.2 | 235 | 200 | 17.7 | 274 | 9.7 | 337 | ||
| Field scale | 190 | 18.7 | 181 | 50%* | 147 | 200 | 18.2 | 178 | 30%* | 159 | |||
| 2021, Scenario B | 0.75 | 10 | 270 | 17.8 | 147 | 4.9 | 140 | 200 | 17.0 | 129 | 4.5 | 108 | |
| 1.25 | 15 | 270 | 17.4 | 165 | 5.6 | 151 | 200 | 17.8 | 146 | 5.0 | 117 | ||
| 1.75 | 25 | 261 | 17.4 | 179 | 6.6 | 158 | 200 | 17.9 | 163 | 5.9 | 129 | ||
| 2.25 | 20 | 230 | 17.7 | 187 | 6.6 | 158 | 200 | 17.8 | 180 | 6.4 | 143 | ||
| 2.75 | 10 | 152 | 17.6 | 184 | 6.6 | 135 | 200 | 17.6 | 195 | 7.0 | 160 | ||
| 3.75 | 10 | 14 | 17.6 | 189 | 6.6 | 96 | 200 | 17.6 | 222 | 7.7 | 191 | ||
| 4.75 | 5 | 0 | 17.6 | 219 | 7.7 | 112 | 200 | 17.6 | 234 | 8.3 | 237 | ||
| 5.75 | 5 | 0 | 17.6 | 228 | 8.3 | 152 | 200 | 17.7 | 245 | 8.6 | 284 | ||
| Field scale | 195 | 17.6 | 181 | 75%* | 144 | 200 | 17.7 | 177 | 30%* | 150 | |||
| 2021, Scenario C | 0.75 | 10 | 270 | 15.4 | 115 | 4.6 | 162 | 200 | 13.6 | 103 | 4.7 | 128 | |
| 1.25 | 15 | 270 | 16.8 | 146 | 5.5 | 168 | 200 | 16.6 | 132 | 4.9 | 131 | ||
| 1.75 | 25 | 200 | 17.7 | 161 | 6.6 | 137 | 200 | 17.7 | 161 | 6.6 | 137 | ||
| 2.25 | 20 | 210 | 18.1 | 189 | 6.6 | 148 | 200 | 18.1 | 187 | 6.5 | 142 | ||
| 2.75 | 10 | 91 | 18.4 | 185 | 6.6 | 101 | 200 | 18.5 | 212 | 8.4 | 153 | ||
| 3.75 | 10 | 0 | 19.5 | 210 | 6.7 | 83 | 200 | 19.6 | 253 | 8.1 | 193 | ||
| 4.75 | 5 | 0 | 20.3 | 243 | 7.7 | 112 | 200 | 20.4 | 286 | 8.7 | 221 | ||
| 5.75 | 5 | 0 | 20.9 | 257 | 8.0 | 159 | 200 | 21.1 | 319 | 9.4 | 252 | ||
| Field scale | 169 | 18.0 | 176 | 75%* | 137 | 200 | 17.8 | 185 | 55%* | 153 | |||
For the variable rate application, the N rate was calculated for achieving a target CP of 6.6%, for the uniform N application a rate of 200 kg N ha−1 was used. * Indicates the percentage of the field for which the target CP of 6.6% was achieved. Bold data show field scale aggregated data.
If N fertilisation is instead managed to ensure that the annual average NO₃-N concentration in drainage water remains below the critical drinking water standard (11.3 mg NO₃-N L⁻1), then the allowable N loads would need to be ≤81, 35 and 71 kg N ha−1 for the years 2014, 2016 and 2021, respectively – corresponding to drainage volumes of 721, 310 and 627 mm. Even without N fertilisation, this could not be achieved in 2014 and 2016, with average field-scale N leaching across the three different scenarios of 99 and 61 kg N ha−1, respectively. In 2021, N fertiliser could be applied to areas with low SOC of up to 74 kg N ha−1 for the area with an SOC of 0.75 under Scenario B.
Discussion
APSIM model performance
The APSIM-Maize model showed generally good performance regarding the effect of N fertilisation rate on maize silage yield, CP and N leaching. Model performance across all sites was good, with R2 of 0.77, RMSE of 1.6 t ha−1 and NSE of 0.7 for silage biomass. A similar model performance by APSIM was reported by Wilson et al. (1995) following model adjustments regarding phenology and RUE for maize grown in New Zealand, with RMSE of 1.8 t ha−1. The good model performance across the various model outputs shows that the various algorithms used in APSIM regarding, beside others, biomass accumulation, N uptake, translocation and dilution, as well as N leaching losses, are appropriate and robust across different environments. Only a few model parameters were adjusted from the default values based on data from mostly subtropical and tropical environments. Specifically, thermal time units for the phenological development adjusted, with similar values used to those reported by Alderkamp et al. (2022) for north-western Europe conditions. The only other model parameters that were adjusted from the default values were target stem and structural N concentrations and the RUE to account for breeding progress of maize hybrids with a stay-green trait and a higher radiation interception and RUE. Using the process-based model Daisy, Manevski et al. (2015), found R2 of 0.69 for maize DM and maize N content, and Alderkamp et al. (2022) found RMSE with range 1.5–1.8 kg ha−1 for various experiments carried out in north-western Europe. In contrast to these relatively good predictions, Morel et al. (2020) found a large underestimation (RMSE of 5.2 t ha−1) of silage maize biomass using the APSIM Next Generation for experiments carried out in southern Sweden. They attributed this underestimation to the constant RUE of 2 g MJ−1 implied in APSIM, which might be incorrect for high latitudes, due to the increase in the fraction of diffuse light. In line with this, Manevski et al. (2015) using Daisy for simulating silage maize systems in Denmark, adapted several model parameters to account for higher photosynthetic rates and resistance to colder temperatures for newer maize hybrids.
Other observed changes in hybrid characteristics, such as an increase in the number of leaves in newer hybrids compared with older ones were not adjusted in APSIM, as this would also change the phenological development. For example, changing the maximum number of leaves from 17 to 14, would decrease the simulated maturity date in the Ostenfeld 1 experiment substantially (by 34 days in 2015 and 16 days in 2016). While adoption of further model parameters might result in improved model performance of certain experiments, limiting the number of adjusted parameters increases the predictive quality of a model (Wallach 2006). In line with this, Refsgaard (1997) argued that the ratio between adjusted parameters and the number of independent field data should be kept reasonably low.
In general, the model also predicts the CP development (Ostenfeld Experiments 1 and 2) and CP concentrations at silage maturity well, with R2 of 0.51, RMSE of 1 and NSE of 0.5 for CP when omitting data from the older cultivar used in the Karkendamm experiment. For the experiments in Agerskov and Tinglev, APSIM predicted on average an increase of 0.01% increase/kg N ha−1 applied across both sites. Similar increases in CP have been reported from experiments in Brazil, with increases of 0.01–0.02%/kg N ha−1, and a minimum CP at zero N fertilisation of 4.6% (Damian et al. 2017). These differences between simulations and measurements in CP and thus N yield could be due to long-term accumulation of N from previous slurry application. However, the APSIM model was initialised with the measured SOC, and common soil C:N ratios of 11. At the Tinglev site, APSIM predicted a higher response of N fertilisation rate to CP compared with the measurements. The maximum simulated values of 10% CP are within the range of values reported for Denmark in the Nordic Field Trial System (https://nfts.dlbr.dk/), and the lack of response in the measurements is unclear.
The temporal N leaching at Karkendamm was well predicted by APSIM for the different slurry N fertilisation rates, but the model failed to predict the delay and reduction in leaching with delayed timing of slurry application. The temporal patterns of N leaching at Agerskov and Tinglev were also not well predicted. However, across all sites, the cumulative N leaching amounts showed good agreements with measurements, with R2 of 0.89, NSE of 0.8 and RMSE of 21.9 kg ha−1. This is about half the RMSE of 50 kg ha−1 obtained by Hoffmann et al. (2018) using the APSIM model for simulating N leaching across three different sites across northern Germany. However, their experiments involved two different crop rotations following the break-up of grassland with very complex N dynamics.
The relatively good fits between measured and predicted silage biomass, CP and N leaching across a large range of N application rates, indicate that the model can be used for scenario assessments regarding precision N fertilisation.
APSIM modelling for variable N application
Using the APSIM model for investigating the effect of variable N application rate based on variations in soil properties (SOC and PAW) to achieve a target CP showed that such variable rate application can be beneficial. Applying variable N rates based on measured SOC levels across a 20-ha field increased the proportion of the area achieving the target CP concentration of 6.6%, compared to a uniform application rate of 200 kg N ha−1. This improvement was achieved despite a generally lower overall N input. Total biomass and N yield at the field scale were comparable between the variable-rate and uniform application strategies. In 2014, N leaching was slightly higher under variable-rate N application compared to uniform application, with increases ranging within 1–6% depending on the scenario. In contrast, variable-rate application reduced N leaching by 4–15% in 2016 and 2021. The model, however, showed poor simulations in very dry years, with very high CP values at silage maturity of up to 30%. This shows that for such conditions the model needs to be refined, ideally based on field studies with variable N application rates.
Similar positive impacts of precision N fertilisation were found for a winter wheat field with variations in SOC of 1.5–3% in a study by Argento et al. (2021) in Switzerland. They showed that variable rate N application reduced fertiliser use by 5–40% and improved N use efficiency by about 10%. However, they also concluded that further understanding of soil N mineralisation and plant uptake is needed to refine in-season fertilisation.
Apart from using models to increase crop yield or quality, they can also be used to guide N fertilisation strategies aimed at reducing N leaching. Using a combination of field data and crop simulation modelling, Mandrini (2021) demonstrated that N fertilisation strategies accounting for inter-annual weather variability could reduce average N leaching by 12.7% without affecting profitability. In our study, field-scale N applications optimised for yield and quality varied from +5% to −18% relative to the uniform application (Scenario A) across three different climatic years. Corresponding changes in N leaching ranged from +3% to −15% for Scenario A. Across all scenarios and years, variable N rates decreased N leaching on average by 5%. These results indicate that precision N application, when adjusted for interannual climatic variability, does not necessarily lead to reduced N leaching.
To meet the critical N load threshold – corresponding to an average annual NO3-N concentration below the drinking water standard of 11 mg NO3-N L−1, simulations indicate that, in two of the years studied, no fertiliser should be applied. Even then, N leaching would still exceed the critical load. In the year with exceptionally high rainfall and drainage, limited N fertilisation could be applied to areas with low SOC. However, since annual rainfall is unknown at the time of slurry or fertiliser application, this approach poses environmental risks and is not advisable.
To comply with the Nitrates Directive in N leaching hotspots – characterised by high livestock density, sandy soils and slurry-fertilised maize – adapted N fertilisation strategies are essential (Kühling et al. 2021). Under the Nitrates Directive, the maximum permitted slurry application in NO3-N-vulnerable zones is 170 kg N ha−1 year−1. The total allowable N input is regulated based on the balance between crop N demand and N supplied through slurry, mineral fertilisers and soil N mineralisation. The latter can be quite substantial on sandy soils, which receive high amounts of slurry (Köhler et al. 2006). Other mitigation options for such hotspots for N leaching include the avoidance of maize monocultures and the use of catch crops, preferably under-sown ryegrass to allow for sufficient biomass accumulation and N uptake following the late harvest of silage maize (Komainda et al. 2018). Another mitigation option is the inclusion of an at least 2-year grass ley in an arable crop rotation or using a wider crop rotation with catch crops (Reheul et al. 2017; Smit et al. 2021; Bockstaller et al. 2024). Both catch crops and grass leys take up post-harvest mineral N and thereby reduce the risk of N leaching. The use of catch crops has been shown to reduce leaching in maize silage systems by up to 50% (Schröder et al. 1996; Wachendorf et al. 2006). Additionally, catch crops increase the N availability for subsequent crops, known as the residual effect (Vogeler et al. 2022). This residual effect needs to be accounted for through a reduction in the N fertilisation rate to the subsequent crop, which is compulsory in many European countries (Aronsson et al. 2016; Kumar et al. 2024).
Conclusions
The APSIM model showed good performance across five different studies, based on measurements of biomass development, N uptake, CP and N leaching losses. For silage biomass, R2 of 0.77, RMSE of 1.6 t ha−1 and NSE of 0.7 wereachieved; for CP, R2 of 0.51, RMSE of 1 and NSE of 0.5 when omitting data from an older cultivar; and for cumulative N leaching, R2 of 0.89, NSE of 0.8 and RMSE of 21.9 kg ha−1. Using the model for determining optimum N fertilisation rates, based on variability in SOC and PAW, showed that variable N rate application generally increased the proportion of the field that achieved the target CP, and also reduced field-scale N leaching compared with a blanket N application across the field. The approach, which uses APSIM modelling and second-order polynomial functions derived from its outputs, can guide fertilisation rates for silage maize based on field variations in soil organic carbon (SOC) and plant-available water (PAW). However, experimental studies under different environmental conditions are needed to validate this approach before it can be widely applied. Process-based models, when linked with proximal soil and/or crop sensing and embedded within a decision support framework, can support the development of more sustainable spatially variable N fertilisation recommendations.
Conflicts of interest
Iris Vogeler is an Editor of Soil Research but was not involved in the peer review or any decision-making process for this paper. The authors have no further conflicts of interest to declare.
References
Alderkamp LM, Vogeler I, Poyda A, Manevski K, van Middelaar CE, Taube F (2022) Yields and nitrogen dynamics in ley-arable systems – comparing different approaches in the APSIM model. Agronomy 12(3), 738.
| Crossref | Google Scholar |
Argento F, Anken T, Abt F, Vogelsanger E, Walter A, Liebisch F (2021) Site-specific nitrogen management in winter wheat supported by low-altitude remote sensing and soil data. Precision Agriculture 22, 364-386.
| Crossref | Google Scholar |
Aronsson H, Hansen EM, Thomsen IK, Liu J, Øgaard AF, Känkänen H, Ulén B (2016) The ability of cover crops to reduce nitrogen and phosphorus losses from arable land in southern Scandinavia and Finland. Journal of Soil and Water Conservation 71(1), 41-55.
| Crossref | Google Scholar |
Bagnall DK, Morgan CL, Cope M, Bean GM, Cappellazzi S, Greub K, Liptzin D, Norris CL, Rieke E, Tracy P, et al. (2022) Carbon-sensitive pedotransfer functions for plant available water. Soil Science Society of America Journal 86, 612-629.
| Crossref | Google Scholar |
Bockstaller C, Blatz A, Rapp O, Koller R, Slezack S, Schaub A (2024) Sustainable alternative to irrigated maize monoculture in a maize-dominated cropped area: Lessons learned from a system experiment. Heliyon 10(10), e30400.
| Crossref | Google Scholar |
Büchter M, Wachendorf M, Volkers K, Taube F (2003) Silomaisanbau auf sandigen Böden Norddeutschlands: Einfluss von Untersaat, Gülle- und Mineral-N-Düngung auf den Nitrataustrag. Pflanzenbauwissenschaften 7(2), 64-74.
| Google Scholar |
Damian JM, Da Ros CO, da Silva RF, Coldebella IJ, Simon DH (2017) N, P or K doses on the dry matter and crude protein yield in maize and sorghum for silage. Pesquisa Agropecuária Tropical 47(1), 53-61.
| Crossref | Google Scholar |
Gollner G, Fohrafellner J, Friedel JK (2020) Winter-hardy vs. freeze-killed cover crop mixtures before maize in an organic farming system with reduced soil cultivation. Organic Agriculture 10, 5-11.
| Crossref | Google Scholar |
Greef J, Ott H, Wulfes R, Taube F (1999) Growth analysis of dry matter accumulation and N uptake of forage maize cultivars affected by N supply. The Journal of Agricultural Science 132(1), 31-43.
| Crossref | Google Scholar |
Herrmann A, Taube F (2004) The range of the critical nitrogen dilution curve for maize (Zea mays L.) can be extended until silage maturity. Agronomy Journal 96(4), 1131-1138.
| Crossref | Google Scholar |
Hoffmann MP, Isselstein J, Rötter RP, Kayser M (2018) Nitrogen management in crop rotations after the break-up of grassland: insights from modelling. Agriculture, Ecosystems & Environment 259, 28-44.
| Crossref | Google Scholar |
Kayser M, Benke M, Isselstein J (2011) Little fertilizer response but high N loss risk of maize on a productive organic-sandy soil. Agronomy for Sustainable Development 31(4), 709-718.
| Crossref | Google Scholar |
Knörzer H, Lawes R, Robertson M, Graeff-Hönninger S, Claupein W (2011) Evaluation and performance of the APSIM crop growth model for german winter wheat, maize and fieldpea varieties within monocropping and intercropping systems. Journal of Agricultural Science and Technology B1, 698-717.
| Google Scholar |
Köhler K, Duynisveld WHM, Böttcher J (2006) Nitrogen fertilization and nitrate leaching into groundwater on arable sandy soils. Journal of Plant Nutrition and Soil Science 169(2), 185-195.
| Crossref | Google Scholar |
Komainda M, Taube F, Kluß C, Herrmann A (2018) Effects of catch crops on silage maize (Zea mays L.): yield, nitrogen uptake efficiency and losses. Nutrient Cycling in Agroecosystems 110(1), 51-69.
| Crossref | Google Scholar |
Kühling I, Beiküfner M, Vergara M, Trautz D (2021) Effects of adapted N-fertilisation strategies on nitrate leaching and yield performance of arable crops in North-Western Germany. Agronomy 11(1), 64.
| Crossref | Google Scholar |
Kühling I, Mikuszies P, Helfrich M, Flessa H, Schlathölter M, Sieling K, Kage H (2023) Effects of winter cover crops from different functional groups on soil-plant nitrogen dynamics and silage maize yield. European Journal of Agronomy 148, 126878.
| Crossref | Google Scholar |
Kumar U, Halling M, Parsons D, Bergkvist G, Morel J, Vogeler I, Geladi P, Hetta M (2022) Dynamics and plasticity of agronomic performance and nutritive quality traits in forage maize at high latitudes. European Journal of Agronomy 138, 126532.
| Crossref | Google Scholar |
Kumar U, Hansen EM, Eriksen J, Vogeler I, Mäenpää M, Thomsen IK (2024) Faba bean and spring barley in sequence with catch crops: grain yields and nitrate leaching. Field Crops Research 310, 109360.
| Crossref | Google Scholar |
Manevski K, Børgesen CD, Andersen MN, Kristensen IS (2015) Reduced nitrogen leaching by intercropping maize with red fescue on sandy soils in North Europe: a combined field and modeling study. Plant and Soil 388(1), 67-85.
| Crossref | Google Scholar |
Manschadi AM, Eitzinger J, Breisch M, Fuchs W, Neubauer T, Soltani A (2021) Full parameterisation matters for the best performance of crop models: inter-comparison of a simple and a detailed maize model. International Journal of Plant Production 15(1), 61-78.
| Crossref | Google Scholar |
Morel J, Parsons D, Halling MA, Kumar U, Peake A, Bergkvist G, Brown H, Hetta M (2020) Challenges for simulating growth and phenology of silage maize in a Nordic climate with APSIM. Agronomy 10(5), 645.
| Crossref | Google Scholar |
Moriasi DN, Arnold JG, Van Liew MW, Bingner RL, Harmel RD, Veith TL (2007) Model evaluation guidelines for systematic quantification of accuracy in watershed simulations. Transactions of the ASABE 50(3), 885-900.
| Crossref | Google Scholar |
Mueller SM, Vyn TJ (2016) Maize plant resilience to N stress and post-silking N capacity changes over time: a review. Frontiers in Plant Science 7, 53.
| Crossref | Google Scholar |
Nannen DU, Herrmann A, Loges R, Dittert K, Taube F (2011) Recovery of mineral fertiliser N and slurry N in continuous silage maize using the 15N and difference methods. Nutrient Cycling in Agroecosystems 89, 269-280.
| Crossref | Google Scholar |
Nevens F, Reheul D (2005) Agronomical and environmental evaluation of a long-term experiment with cattle slurry and supplemental inorganic N applications in silage maize. European Journal of Agronomy 22(3), 349-361.
| Crossref | Google Scholar |
Pommel B, Gallais A, Coque M, Quilleré I, Hirel B, Prioul JL, Andrieu B, Floriot M (2006) Carbon and nitrogen allocation and grain filling in three maize hybrids differing in leaf senescence. European Journal of Agronomy 24(3), 203-211.
| Crossref | Google Scholar |
Refsgaard JC (1997) Parameterisation, calibration and validation of distributed hydrological models. Journal of Hydrology 198(1–4), 69-97.
| Crossref | Google Scholar |
Reheul D, Cougnon M, Kayser M, Pannecoucque J, Swanckaert J, De Cauwer B, van den Pol-van Dasselaar A, De Vliegher A (2017) Sustainable intensification in the production of grass and forage crops in the Low Countries of north-west Europe. Grass and Forage Science 72(3), 369-381.
| Crossref | Google Scholar |
Schröder J, Dijk WV, Groot WD (1996) Effects of cover crops on the nitrogen fluxes in a silage maize production system. Netherlands Journal of Agricultural Science 44(4), 293-315 ref. 40.
| Google Scholar |
Schröder JJ, Neeteson JJ, Withagen JCM, Noij IGAM (1998) Effects of N application on agronomic and environmental parameters in silage maize production on sandy soils. Field Crops Research 58(1), 55-67.
| Crossref | Google Scholar |
Schröder JJ, Neeteson JJ, Oenema O, Struik PC (2000) Does the crop or the soil indicate how to save nitrogen in maize production? Reviewing the state of the art. Field Crops Research 66(2), 151-164.
| Crossref | Google Scholar |
Smit HPJ, Reinsch T, Kluß C, Loges R, Taube F (2021) Very low nitrogen leaching in grazed ley-arable-systems in northwest europe. Agronomy 11(11), 2155.
| Crossref | Google Scholar |
Struck IJ, Reinsch T, Herrmann A, Kluß C, Loges R, Taube F (2019) Yield potential and nitrogen dynamics of no-till silage maize (Zea mays L.) under maritime climate conditions. European Journal of Agronomy 107, 30-42.
| Crossref | Google Scholar |
Taube F, Vogeler I, Kluß C, Herrmann A, Hasler M, Rath J, Loges R, Malisch CS (2020) Yield progress in forage maize in NW Europe – breeding progress or climate change effects? Frontiers in Plant Science 11, 1214.
| Crossref | Google Scholar |
Vogeler I, Böldt M, Taube F (2022) Mineralisation of catch crop residues and N transfer to the subsequent crop. Science of the Total Environment 810, 152412.
| Crossref | Google Scholar |
Vogeler I, Hansen EM, Thomsen IK (2023) The effect of catch crops in spring barley on nitrate leaching and their fertilizer replacement value. Agriculture, Ecosystems & Environment 343, 108282.
| Crossref | Google Scholar |
Volkers KC, Wachendorf M, Loges R, Jovanovic NJ, Taube F (2003) Prediction of the quality of forage maize by near-infrared reflectance spectroscopy. Animal Feed Science and Technology 109(1), 183-194.
| Crossref | Google Scholar |
Wachendorf M, Büchter M, Volkers KC, Bobe J, Rave G, Loges R, Taube F (2006) Performance and environmental effects of forage production on sandy soils. V. Impact of grass understorey, slurry application and mineral N fertilizer on nitrate leaching under maize for silage. Grass and Forage Science 61(3), 243-252.
| Crossref | Google Scholar |
Wendling U (1995) Berechnung der Gras-Referenzverdunstung mit der FAO Penman-Monteith-Beziehung. Wasserwirtschaft 85, 602-604.
| Google Scholar |
Wilson DR, Muchow RC, Murgatroyd CJ (1995) Model analysis of temperature and solar radiation limitations to maize potential productivity in a cool climate. Field Crops Research 43(1), 1-18.
| Crossref | Google Scholar |