

Influence of phosphate retention capacity on the potential plant availability of struvite fertiliser in acidic grassland soils
Florencia De Lucca Agrelo A * , Leo Condron A and Jim Moir A
A
Abstract
Sustainable agricultural production relies on efficient phosphorus (P) management due to the finite nature of phosphate rock reserves, increasing fertiliser costs for farmers, and environmental concerns associated with P losses. Struvite, a P fertiliser recovered from wastewater, appears to be an alternative to conventional water soluble-P fertilisers.
We aimed to evaluate changes in the concentration of soil available P in response to the application of struvite in three New Zealand acidic soils with varied P retention capacities.
A plant-less incubation was carried out for 63 days where struvite, two water soluble-P fertilisers, and reactive phosphate rock were applied at two rates to three contrasting soils.
Regardless of soil type, struvite significantly increased Olsen-P concentrations, comparable to conventional P fertilisers. P retention capacity influenced P release patterns, with Pallic soil exhibiting the highest Olsen-P increases due to its low P retention. P release from struvite was rapid but showed sustained availability in Pallic soil compared to declines in Allophanic and Brown soils.
Struvite showed similar fertiliser-P behaviour in soils with contrasting P retention capacity generating changes in Olsen-P like those from water-soluble P fertilisers.
Further research is necessary to investigate the suitability of struvite as an alternative P fertiliser source for New Zealand agriculture.
Keywords: acidic soils, circular economy, phosphorus fertiliser solubility, phosphorus recovery, soil fertility, sustainability, wastewater, water-soluble fertilisers.
Introduction
The recent increase in phosphorus (P) fertiliser prices have raised concerns about the economic viability of agricultural systems. Since agricultural production relies on continuous P inputs to maintain soil fertility and meet the demands of a growing population, the finite nature of phosphate rock reserves has raised questions about the long-term sustainability of this critical resource (Elser and Haygarth 2021; Brownlie et al. 2023).
Significant P losses occur during food production, processing, and consumption, resulting in low P use efficiencies that contribute to environmental degradation, such as the eutrophication of water bodies (Withers et al. 2020). This situation has led to a growing and increasing interest in closing the P cycle through the recovery and recycling of P. Improving the P use efficiency along the food production chain has become an urgent priority for the sustainability of on-farm P management while reducing risks in P supply and ensuring a stable economic value of the nutrient (Schneider et al. 2019; Hollas et al. 2021).
The recovery of P from wastewater for its use as a phosphate fertiliser emerged as a way to return P to the food chain (Elser and Haygarth 2021). Struvite (MgNH4PO4·6H2O), chemically precipitated from wastewater, has gained increased interest as an alternative P fertiliser. Struvite has proven to be as effective as commercial P fertilisers on a wide range of crops, although it is less water soluble than phosphate rock-derived fertilisers (Johnston and Richards 2003; Cabeza et al. 2011; Antonini et al. 2012; Nongqwenga et al. 2017).
Different soil properties can affect the bioavailability of P from struvite, and previous research showed that in alkaline soils, struvite-P release may be slower compared to acidic soils (Talboys et al. 2016; Degryse et al. 2017; Do Nascimento et al. 2018). New Zealand pastoral soils are generally acidic (pH < 6), with low available P, and a wide range of P retention capacity (Saunders 1965; Chen et al. 2003; Morton 2020). Soils derived from volcanic ash, such as Allophanic soils, are characterised by high P fixation capacities due to the presence of amorphous allophane, requiring higher inputs of P fertiliser than soils with low P retention (i.e. Pallic) (Hewitt 2010). Even though previous research has evaluated the behaviour of struvite in different soils as well as its agronomic performance (Hertzberger et al. 2020), little is known about how soil P retention capacity affects the potential availability of struvite-P fertiliser in acidic soils.
This study aimed to quantify and compare changes in plant-available P (Olsen-P) after the application of struvite, single superphosphate (SSP), diammonium phosphate (DAP), and reactive phosphate rock (RPR) in three New Zealand acidic soils with different P retention capacities, incubated in the absence of plants. It was expected that the lower water-solubility of struvite-P would significantly reduce the increase in plant-available P compared with single superphosphate and DAP, which in turn would be significantly reduced by high P retention capacity.
Materials and methods
Soils
Topsoils (0–15 cm) were collected from three New Zealand soils under long-term pastures contrasting in chemical and physical characteristics, especially P retention capacity. The soils were Typic Orthic-Allophanic (Typic hapludand, USDA), Allophanic-Brown (Andic Dystrudept), and a Pallic Grey Earth (Fragiudalf, USDA). Soils were air-dried (30°C) and sieved through a 2-mm mesh before use. Determination of selected chemical and physical characteristics of each soil was carried by an accredited commercial laboratory (R. J. Hill Laboratories; www.hill-labs.co.nz) using methods described by Blakemore et al. (1981). Soil pH was determined using a 1:2 (w/v) soil: water ratio followed by potentiometric determination of pH. Exchangeable Ca, Mg, K, and Na were determined by a 1M neutral ammonium acetate extraction followed by Inductively Coupled Plasma Optical Emission Spectroscopy (ICP-OES) determination (Agilent 5110, Agilent Technologies, USA). Organic carbon was assessed by near infra-red reflectance (NIR, Brüker MATRIX-F II FT-NIR, Germany), calibration based on Dumas combustion. Sulfate-sulfur was determined by ion chromatography after extraction with 0.02 M potassium phosphate. Olsen-P was determined by Olsen extraction (Olsen et al. 1954) followed by colorimetric determination (Murphy and Riley 1962). Total P and total sulfur (S) were determined through nitric hydrochloric acid digestion of the sample and posterior analysis of the filtered by ICP-OES. The P retention capacity was assessed by shaking the soil with a solution containing 1000 mg L−1 at pH 4.6 for 16 h (Saunders 1965). Samples were then centrifuge at 760g for 15 min. Phosphate was determined colorimetrically (Murphy and Riley 1962) in UV-VIS spectrophotometer (Shimadzu UV-1900i, Japan). Particle size was measured using a Malvern Mastersizer Autosampler 2000 (Malvern Instruments Limited, UK), after treating the soil samples with H2O2 30% w/w to remove the soil organic matter, followed by the addition of sodium hexametaphosphate 5% and shaking the samples for 2 h (Sperazza et al. 2004; Ryżak and Bieganowski 2011; Lewis and McConchie 2012). The physical and chemical properties of these soils are presented in Table 1.
| Property | Pallic | Brown | Allophanic | |
|---|---|---|---|---|
| pH (water) | 5.0 | 5.4 | 5.5 | |
| Total C (%) | 5.6 | 4.4 | 7.2 | |
| Texture | Silt loam | Silt loam | Silt loam | |
| Olsen-P (mg kg−1) | 12 | 5 | 24 | |
| Total P (mg kg−1) | 582 | 469 | 2530 | |
| Total S (mg kg−1) | 591 | 425 | 1209 | |
| Sulfur-S (mg kg−1) | 10 | 3 | 31 | |
| P retention capacity % | 12 | 45 | 94 | |
| K (cmol kg−1) | 0.4 | 0.6 | 0.2 | |
| Ca (cmol kg−1) | 5.0 | 4.2 | 3.5 | |
| Mg (cmol kg−1) | 1.1 | 1.1 | 0.9 | |
| Na (cmol kg−1) | <0.1 | 0.1 | 0.2 | |
| CEC (cmol kg−1) | 15 | 21 | 20 | |
| TBS (%) | 43 | 28 | 24 |
CEC, cation exchange capacity; TBS, total base saturation.
Phosphorus fertilisers and characterisation
Four P fertilisers were used in this experiment: (1) a commercial single superphosphate (SSP, Ballance Agri-Nutrients, New Zealand); (2) a commercial diammonium phosphate (DAP, Ballance Agri-Nutrients, New Zealand); (3) a commercial struvite fertiliser (Emerge, New Zealand); and (4) a reactive phosphate rock (RPR; FOSPAC, Sechura, Perú). As the fertiliser particle sizes differed among the used P sources, for the incubation experiment all the fertilisers were crushed using a mortar and pestle (<0.2 mm) to reduce the potential effect of particle size during the incubation experiment.
Total P contents were determined by digesting the fertilisers with aqua regia solution (HNO3 + HCl) followed by inductively coupled plasma mass spectrometer analysis (ICP-MS Agilent 7700, Agilent Technologies, USA) (USEPA 1996). Moisture content (%) was determined by weighing a sample (20 g) of each fertiliser and drying it in an oven at 60°C until constant weight and calculated as the difference between initial and final weight. Citrate-soluble phosphorus was determined by mixing 10 g of each fertiliser with 500 mL of citric acid (2%), and water-soluble phosphorus by mixing 5 g of each fertiliser with 500 mL of deionised water. Both mixtures were placed in a rotary shaker at 40 rpm for 30 min and then filtered through a Type 3 filter paper. Citrate-soluble P was determined using the vanado-molybdate colorimetric method (FAMIC 2020). Water-soluble P concentration was quantified by colorimetric determination according to Murphy and Riley (1962). Fertiliser solubility in NaHCO3 0.5 M was assessed according to Olsen et al. (1954). Fertiliser characteristics are in Table 2.
| Fertiliser | Total P (%) | Water-soluble P (% of total P) | Citrate-soluble P (% of total P) | NaHCO3 soluble P (% of total P) | |
|---|---|---|---|---|---|
| Struvite | 12 | 4 | 99 | 19 | |
| DAP | 23 | 90 | 99 | 95 | |
| SSP | 12 | 84 | 85 | 91 | |
| RPR | 12 | <1 | 45 | 5 |
DAP, diammonium phosphate; SSP, single superphosphate; RPR, reactive phosphate rock.
Soil incubation study
An incubation study was carried out to determine and compare the change in labile P and its pattern of release from different P fertilisers. Two rates of each fertiliser, equivalent to 50 or 100 mg P kg−1, were thoroughly mixed with 500 g of the different soils and placed in 1 L polyethylene containers. These rates were used to be able to generate changes in available P concentration in soils that can show release trends during incubation (Nongqwenga et al. 2017). The contents of Mg, S, and N were not controlled as this was an incubation in the absence of plant growth. A control treatment without P to estimate the contribution of soil-derived P was also established. Deionised water was added to reach a soil moisture of 60% of the maximum water-holding capacity of each soil and was controlled weekly by weighing the containers and adding more deionised water. Parafilm was used to cover each container to keep the soil moist, and small holes were made to allow gas exchange. Soils were incubated in the dark at 22°C for 63 days. The soil containers were placed randomly in the incubators and were rotated among the shelves every time soil moisture was checked.
The experiment was arranged in a completely randomised design with four replicates of each combination of fertiliser type, application rate, and soil order. Samples were taken from each replicate after 7, 21, and 63 days by mixing the soil and taking a sample of 80 g (dry soil equivalent) to determine plant available P using the Olsen-P soil test, which is commonly used in New Zealand soils (Edmeades et al. 2006). The P concentration was expressed as an increase in the available P levels determined at each sampling date with respect to the control treatment for each soil.
Statistical analysis
An ANOVA combined with repeated measures analysis was conducted to determine the effect of the soil order (i.e. Pallic, Brown, Allophanic), fertiliser type (i.e. struvite, SSP, RPR, and DAP), application rate (i.e. 50 or 100 mg P kg−1), sampling time (i.e. 7, 21, and 63 days), and their interactions on the variation in Olsen-P concentration was conducted in R Core Team (2023). Data for Olsen-P concentration was transformed to square root to be analysed under the assumptions of a normal distribution and resulting means and standard errors were back-transformed to the original scale. Homogeneity of the variance and normal distribution of the residuals was assessed by visual assessment of residual plots and the Shapiro–Wilk test (W > 0.9). A mean comparison of the effects and their interactions was performed by Tukey’s test at a P < 0.05 level of significance.
Results
Soils
Initial analyses showed that the Brown soil had a lower Olsen-P content (5 mg P kg−1), while Allophanic exhibited the highest concentration (24 mg P kg−1). All the soils showed an acidic pH that ranged between 5.0 and 5.5, with Pallic being the most acidic soil. Allophanic showed the highest P retention capacity (94%), whereas Pallic soil had the lowest (12%). The concentration of K, Ca, Mg, and Na varied between soils (Table 1). Pallic soil had the highest TBS (43%) compared to the Allophanic soil and Brown (24% and 28%, respectively). In addition, Total P was greatest for the Allophanic soil (2530 mg P kg−1) and lowest for Brown soil (469 mg P kg−1), reflecting fertiliser (SSP) input history to the sites.
General changes in Olsen-P concentrations
Increments in Olsen-P concentrations were affected by fertiliser type, P rate, soil order, sampling time, and their interactions (Table 3). The Olsen-P concentrations in the fertilised treatments were higher than those in the unfertilised controls across all treatments and sampling times. Olsen-P levels in fertilized treatments ranged from 6 to 94 mg P kg−1, while control treatments exhibited values between 5 and 27 mg P kg−1. Averaged across P rates, soil orders, and sampling times, increases in Olsen-P were significantly higher for struvite (49 mg P kg−1) and DAP (43 mg P kg−1) compared with SSP (36 mg P kg−1) and RPR (9 mg P kg−1).
| Factor | Δ Olsen-P | |
|---|---|---|
| (mg P kg−1) | ||
| P fertiliser (F) | ||
| Struvite | 49 | |
| SSP | 36 | |
| DAP | 43 | |
| RPR | 9 | |
| P rate (R) | ||
| 50 | 25 | |
| 100 | 43 | |
| Soil (S) | ||
| Pallic | 46 | |
| Brown | 31 | |
| Allophanic | 23 | |
| Sampling time in days (D) | ||
| 7 | 40 | |
| 21 | 34 | |
| 63 | 27 | |
| P-value | ||
| F | <0.001 | |
| R | <0.001 | |
| S | <0.001 | |
| D | <0.001 | |
| F × R | <0.001 | |
| F × S | <0.001 | |
| F × D | <0.001 | |
| S × D | <0.001 | |
| S × R | <0.001 | |
| D × R | 0.7011 | |
| F × S × D | <0.001 | |
| F × S × R | <0.001 | |
| F × D × R | <0.001 | |
| S × D × R | <0.001 | |
| F × S × D × R | <0.001 | |
Values presented are back transformed least-squares means for main effect.
SSP, single superphosphate; DAP, diammonium phosphate; RPR, reactive rock phosphate.
Effect of fertiliser type and soil order in Olsen-P increments
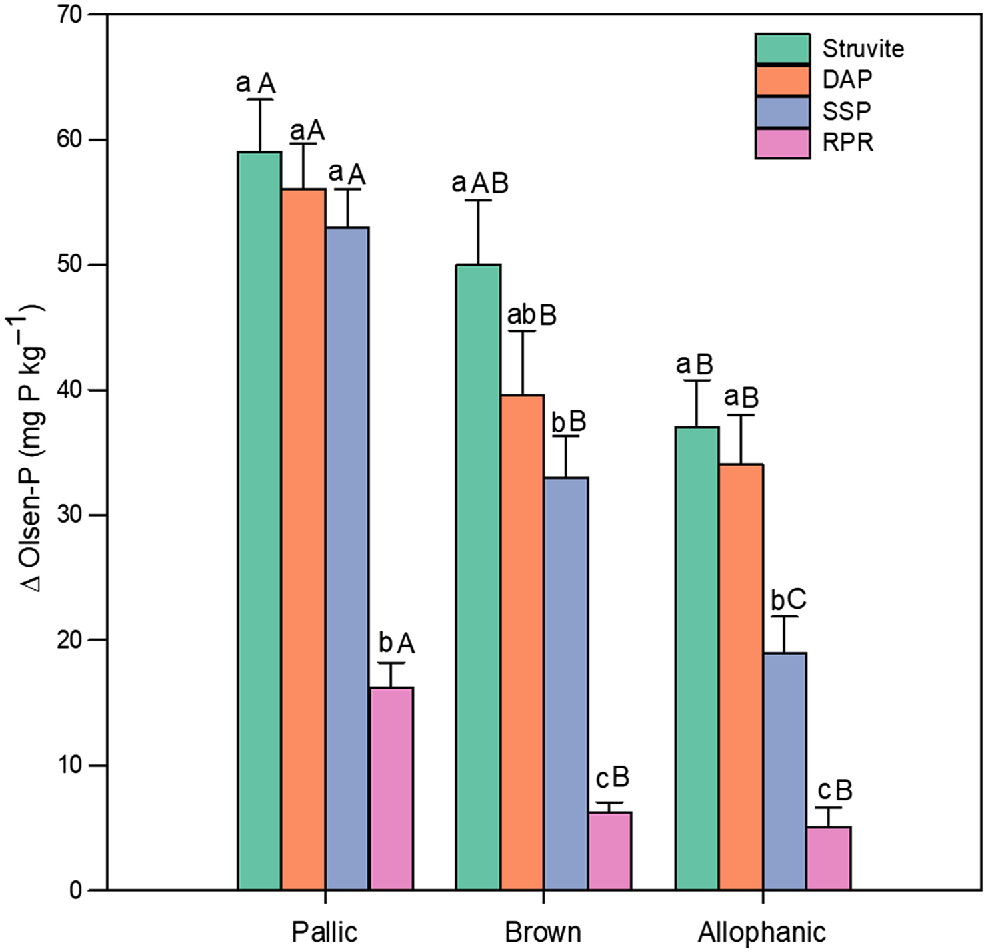
The extent of the increases in Olsen-P depended also on the soil order (Table 3). Averaged across P fertilisers, P rates, and sampling times, the greatest P increases were evidenced in the Pallic soil, while the lowest were in Allophanic (46 and 23 mg P kg−1, respectively). The Olsen-P increase pattern of the four P fertilisers was similar in the evaluated soils, averaged across P rates and sampling times (Fig. 1). Struvite generated the largest increases in Olsen-P concentrations in all three soils, although it was not different (P ≥ 0.05) from DAP. Conversely, RPR consistently showed the lowest performance, being different (P < 0.05) from the others in all the soils (Fig. 1). In all soil and fertiliser combinations, the highest numerical increments in Olsen-P were observed in the Pallic soil for the struvite, DAP, and SSP treatments (59, 56, and 53 mg P kg−1, respectively). In contrast, the lowest increments were consistently recorded for the RPR treatment across all three soils.
Mean data for effect of soil (Pallic, Brown, Allophanic) and fertiliser (struvite, DAP, SSP, RPR) type on measured increases in Olsen-P averaged across P application rates and sampling dates. Bar height and error bars represent the mean and s.e.m., respectively. Within each soil lowercase letters denote significant differences (P < 0.05) between fertilisers, and uppercase letters denotes significant differences (P < 0.05) between soils for each fertiliser. DAP, diammonium phosphate; SSP, single superphosphate; RPR, reactive phosphate rock.
Effect of fertiliser type and P rate on Olsen-P increases over time
The increases in Olsen-P were affected by the interaction between fertiliser type, P rate, and the duration of the experiment (Table 3). For the 50 mg P kg−1, Struvite, DAP, and SSP initially showed a rapid increase in Olsen-P at Day 7 of incubation (Table 4). After this point, a gradual decline is observed, with all three fertilisers converging around 20 mg P kg−1 by the end of the incubation period (Day 63). In contrast, RPR shows a lower increase in Olsen-P across the entire period, with only a modest rise by Day 21 of incubation, followed by a pronounced decline by the end of the incubation. For the highest P rate (100 mg P kg−1), the trends are more evident for struvite, DAP, and SSP, with struvite maintaining the highest Olsen-P values throughout the sampling period (Table 4). DAP and SSP also showed a significant increase, although SSP experienced a greater decrease after Day 21, leading to a convergence with DAP on Day 63. RPR, which was consistent with the low P rate, had the smallest Olsen-P increase with minimal changes across sampling times.
| Sampling time | ||||
|---|---|---|---|---|
| 7 days | 21 days | 63 days | ||
| Δ Olsen-P (mg P kg−1) | ||||
| Pallic soil | ||||
| (Control) | 15 | 13 | 13 | |
| 50 (mg P kg−1) | ||||
| Struvite | 37abA | 38bA | 48aB | |
| DAP | 42aA | 39abA | 44bB | |
| SSP | 35bA | 44aB | 44bB | |
| RPR | 21cA | 19cA | 3cB | |
| 100 (mg P kg−1) | ||||
| Struvite | 77aA | 72aA | 84aA | |
| DAP | 67bA | 66aA | 84aB | |
| SSP | 62bA | 64aA | 75bB | |
| RPR | 24cA | 26bA | 8cB | |
| Brown soil | ||||
| (Control) | 5 | 4 | 5 | |
| 50 (mg P kg−1) | ||||
| Struvite | 42aA | 21aB | 24aB | |
| DAP | 37abA | 17bB | 18bB | |
| SSP | 40bA | 20abB | 17bB | |
| RPR | 5cA | 2cB | 5cA | |
| 100 (mg P kg−1) | ||||
| Struvite | 65bA | 80aB | 64aB | |
| DAP | 84aA | 44bB | 50bB | |
| SSP | 59bA | 30cB | 31cB | |
| RPR | 6cA | 10dA | 12dA | |
| Allophanic soil | ||||
| (Control) | 23 | 22 | 20 | |
| 50 (mg P kg−1) | ||||
| Struvite | 38aA | 30bB | 9aC | |
| DAP | 36aA | 36aA | 8aB | |
| SSP | 26bA | 25cA | 2bB | |
| RPR | 10cA | 12dA | <1cB | |
| 100 (mg P kg−1) | ||||
| Struvite | 56aA | 57aA | 27aB | |
| DAP | 54aA | 54aA | 12bB | |
| SSP | 31bA | 32bA | 5cB | |
| RPR | 10cA | 10cA | <1dB | |
For each sampling time/soil/application rate combination, lowercase letters denote significant differences (P < 0.05) between fertilisers, and uppercase letters denote significant differences (P < 0.05) between sampling times for each fertiliser at different rates of addition to each soil. Data presented corresponds to back-transformed means. Means followed by different superscript lowercase letter within column for each day and P rate are significantly different (P < 0.05). Means followed by different superscript uppercase letters are significantly different between sampling time for the same fertiliser at each P rate (P < 0.05).
Effect of soil order and P rate on Olsen-P increments
The interaction between soil order and P rate also had a significant effect on the Olsen-P increments (Table 3). Across both P rates, the Pallic soil consistently exhibited the highest Olsen-P increases, while the Brown soil generally showed the lowest. At the lower P application rate, the Pallic soil showed the highest increase in Olsen-P (35 mg P kg−1), followed by the Brown soil (20 mg P kg−1), and the Allophanic soil exhibited the lowest increase (18 mg P kg−1), averaged across fertiliser types and sampling times. At the higher P rate, all three soils showed a marked increase in Olsen-P compared to the 50 mg P kg⁻1 treatment. The Pallic soil continued to exhibit the highest Olsen-P increase (58 mg P kg⁻1), followed by the Brown and Allophanic soils (43 and 27 mg P kg−1, respectively).
Effect of the interaction between soil order, fertiliser type, and P rate on Olsen-P increments over time
The extent of the Olsen-P increases varied depending on the specific combination of fertiliser type, application rate, and soil order over time (Table 3). In general, the Olsen-P concentrations declined with incubation duration for the Allophanic and Brown soils, while the Pallic soil showed an increase towards the end of the experiment. Nevertheless, differences among sampling times were not always significant (Table 4). The applied P rates clearly had an impact on the magnitude of the increase in Olsen-P. Overall, significant differences between P rates for each fertiliser were determined in each soil, except for RPR in the Allophanic soil. For struvite, DAP, and SSP the observed increments in Olsen-P concentration from the highest rate were higher than that from the lower rate, and in some cases doubled the lower rate values (Table 4). The results showed a clear difference in Olsen-P dynamics between fertilisers. Struvite caused a rapid increase in Olsen-P concentrations by Day 21 in all soils for both P rates. However, in the Brown and Allophanic soil, the concentrations decreased towards the end of the experiment, while they continued to increase for the Pallic soil (Table 4).
Discussion
Increases in Olsen-P were significantly influenced by fertiliser type, soil order, application rate, and their interactions. This observation aligns with previous research emphasising the importance of these factors in determining P availability in soils (Do Nascimento et al. 2018; Anderson et al. 2020; Thiessen Martens et al. 2023). The high and immediate increment in Olsen-P concentration due to the application of struvite despite its low water solubility (4% of the total P) was also observed by other authors (Meyer et al. 2018; Oliveira et al. 2019). This could be explained by the high citrate-solubility of struvite (99%) particularly in acidic soils like the ones used in this experiment (Talboys et al. 2016). In this situation the slower release of P from struvite compared to water-soluble fertilisers can be offset by the protonation of phosphate ions, therefore increasing phosphorus release. In addition, in this experiment the finely ground fertiliser (<0.2 mm) was mixed completely with the soil, which may explain the complete solubilisation of struvite and DAP (Talboys et al. 2016; Degryse et al. 2017; Meyer et al. 2018; Anderson et al. 2021). The specific surface area of the fertilisers particles increases, generating a higher interaction between them and soil and consequently, enhancing the dissolution.
The magnitude of the increase in Olsen-P concentration is highly dependent on the specific interactions between fertiliser and soil order (Anderson et al. 2021; Thiessen Martens et al. 2023). The most consistent and least variable results were observed in the Pallic soil. Possibly the low soil pH (5.0) and the very low P retention capacity (12%) promoted the dissolution of fertiliser-P and sustained a large amount of P in the soil solution (Nongqwenga et al. 2017; do Nascimento et al. 2018; Jia et al. 2024). Although the Allophanic soil has a very high P retention capacity (94%), it exhibited a greater initial increase in the Olsen-P concentration in struvite and DAP treatments. This could be explained by the presence of allophane materials (Al, Si, and Fe species), which serves as a large sink for dissolved P and therefore enhancing the struvite dissolution (Achat et al. 2014; Nongqwenga et al. 2017; Hewitt et al. 2021). However, this effect is temporary as the P in solution is quickly immobilised by iron/aluminium oxide minerals and clay minerals (Pierzynski et al. 2005; Syers et al. 2008; Thiessen Martens et al. 2022) so that Olsen-P concentration in this soil decreased towards the end of the incubation period. This suggests the possibility of a short period for increased phosphorus uptake, particularly during the early stages of plant growth.
In the Allophanic soil, struvite exhibited the most significant increases in Olsen-P at both phosphorus application rates, sustaining a high concentration of labile phosphorus P throughout the duration of the experiment. This trend persisted even to the final sampling time (Day 63) when the Olsen-P concentrations from all fertilisers demonstrated the largest decrease relative to earlier sampling dates. These findings suggest a positive outlook for fertiliser management approaches in soils characterised by a high capacity for phosphorus retention, where the use of traditional soluble fertilisers is constrained by their significant reactivity with soil constituents (Syers et al. 2008; Nash et al. 2019).
The Brown soil exhibited an increase in Olsen-P after fertiliser application intermediate between the Pallic and Allophanic soils. The moderate P retention capacity (45%) therefore resulted in a less pronounced depletion of Olsen-P levels by Day 63 than in the Allophanic soil, probably attributable to a lower P retention capacity.
While in the Allophanic and Brown soils, Olsen-P concentrations tended to decrease or stabilise, the Pallic soil showed a continuous increase towards the end of the experiment for the struvite, DAP, and SSP treatments. To accurately identify and quantify the alterations in soil phosphorus reserves and determine the balance between them, a prolonged incubation period is warranted along with a thorough examination of the changes in soil phosphorus reserves following the application of these P sources.
Increasing the phosphorus application rate from 50 to 100 mg P kg−1 resulted in a marked increase in the Olsen-P concentration across all phosphorus sources in the three examined soils. This may be attributed to a potential depletion of phosphorus retention mechanisms such as iron and aluminium oxides and hydroxides that are the most abundant form of these ions in moderately acid and acidic soils, which facilitated the maintenance of elevated P concentrations within the soil solution (Sample et al. 1980; McLaughlin et al. 2011; Penn and Camberato 2019). In both P rates struvite maintained the greatest Olsen-P values at the end of the incubation period evidencing its slow-release properties compared to DAP and SSP (Anderson et al. 2020). This is particularly advantageous in agricultural systems where frequent P applications are impractical such as implanted pastures. The limited effectiveness of RPR at both application rates highlights its constrained use as a short-term phosphorus source in soils that do not promote its dissolution (Bolan and Hedley 1990). Averaged across fertilisers and sampling times, the highest increase in Olsen-P over the control was observed in the Pallic soil for both P doses. This soil had the lowest P retention capacity (12%) and, consequently a low P sorption capacity that allowed a relatively high and stable Olsen-P concentration to be maintained over the experimental period.
Despite the low water-solubility of struvite, its high solubility in citric acid (99%) may explain the relatively high dissolution compared with DAP and SSP, which had comparable levels of citric acid solubility (Wang et al. 2023). This would suggest that when plants are actively growing, there is a large potential for P release from struvite dissolution (Richardson et al. 2009). Therefore, by supplying P gradually, struvite could increase P use efficiency and reduce the risk of P leaching in those productive systems where the application of water-soluble P fertilisers could result in significant P losses and avoid P fixation in soils with high P retention indices.
Conclusions
The interaction between soil order and struvite determined the changes in Olsen-P concentrations. The soil P retention capacity determined the magnitude of the increase and maintenance of P levels in the soil solution. As expected, results demonstrated that over the course of the 2-month incubation experiment, struvite exhibited similar fertiliser-P behaviour in soils with contrasting phosphorus retention capacity; and generated changes in Olsen-P like those from water-soluble P fertilisers. Nevertheless, the P release pattern of struvite was more like that of DAP than RPR. These outcomes suggest that struvite recovered from wastewater may be a viable and sustainable alternative P source to phosphate rock in New Zealand. However, further research is needed to investigate the dissolution and reactions of struvite-P with soil, together with its agronomic efficiency.
Data availability
The data supporting this study can be made available upon reasonable request to the corresponding author.
Conflicts of interest
Leo Condron is an Editor of Soil Research but was not involved in the peer review or any decision-making process for this paper. The authors have no further conflicts of interest to declare.
References
Achat DL, Daumer M-L, Sperandio ML, Santellani A-C, Morel C (2014) Solubility and mobility of phosphorus recycled from dairy effluents and pig manures in incubated soils with different characteristics. Nutrient Cycling in Agroecosystems 99, 1-15.
| Crossref | Google Scholar |
Anderson R, Brye KR, Greenlee LF, Gbur E (2020) Chemically precipitated struvite dissolution dynamics over time in various soil textures. Agricultural Sciences 11(6), 567-591.
| Crossref | Google Scholar |
Anderson R, Brye KR, Greenlee L, Roberts TL, Gbur E (2021) Wastewater-recovered struvite effects on total extractable phosphorus compared with other phosphorus sources. Agrosystems, Geosciences & Enviroment 4(2), e20154.
| Crossref | Google Scholar |
Antonini S, Arias MA, Eichert T, Clemens J (2012) Greenhouse evaluation and environmental impact assessment of different urine-derived struvite fertilizers as phosphorus sources for plants. Chemosphere 89(10), 1202-1210.
| Crossref | Google Scholar | PubMed |
Blakemore LC, Searle PL, Daly BK (1981) ‘Methods for chemical analysis of soils.’ (Department of Scientific and Industrial Research: Lower Hutt) 10.7931/DL1-SBSR-10A
Bolan NS, Hedley MJ (1990) Dissolution of phosphate rocks in soils. 2. Effect of pH on the dissolution and plant availability of phosphate rock in soil with pH dependent charge. Fertilizer Research 24, 125-134.
| Crossref | Google Scholar |
Brownlie WJ, Sutton MA, Cordell D, Reay DS, Heal KV, Withers PJA, Vanderbeck I, Spears BM (2023) Phosphorus price spikes: a wake-up call for phosphorus resilience. Frontiers in Sustainable Food Systems 7, 1088776.
| Crossref | Google Scholar |
Cabeza R, Steingrobe B, Römer W, Claassen N (2011) Effectiveness of recycled P products as P fertilizers, as evaluated in pot experiments. Nutrient Cycling in Agroecosystems 91(2), 173-184.
| Crossref | Google Scholar |
Chen CR, Sinaj S, Condron LM, Frossard E, Sherlock RR, Davis MR (2003) Characterization of phosphorus availability in selected New Zealand grassland soils. Nutrient Cycling in Agroecosystems 65, 89-100.
| Crossref | Google Scholar |
Degryse F, Baird R, Da Silva RC, McLaughlin MJ (2017) Dissolution rate and agronomic effectiveness of struvite fertilizers – effect of soil pH, granulation and base excess. Plant and Soil 410(1), 139-152.
| Crossref | Google Scholar |
Do Nascimento CAC, Pagliari PH, Faria LdA, Vitti GC (2018) Phosphorus mobility and behavior in soils treated with calcium, ammonium, and magnesium phosphates. Soil Science Society of America Journal 82(3), 622-631.
| Crossref | Google Scholar |
Edmeades DC, Metherell AK, Waller JE, Roberts AHC, Morton JD (2006) Defining the relationships between pasture production and soil P and the development of a dynamic P model for New Zealand pastures: a review of recent developments. New Zealand Journal of Agricultural Research 49(2), 207-222.
| Crossref | Google Scholar |
FAMIC (2020) Testing Methods for Fertilizers. Food and Agricultural Materials Inspection Center (FAMIC). Available at http://www.famic.go.jp/ffis/fert/obj/TestingMethodsForFertilizers2020.pdf
Hertzberger AJ, Cusick RD, Margenot AJ (2020) A review and meta-analysis of the agricultural potential of struvite as a phosphorus fertilizer. Soil Science Society of America Journal 84(3), 653-671.
| Crossref | Google Scholar |
Hewitt AE (2010) ‘New Zealand soil classification.’ 3rd edn. (Manaaki Whenua Press: Lincoln, New Zealand) 10.7931/DL1-LRSS-1-2010
Hewitt AE, Balks MR, Lowe DJ (2021) ‘The soils of aotearoa New Zealand.’ (Springer: Madison, WI) 10.1007/978-3-030-64763-6
Hollas CE, Bolsan AC, Venturin B, Bonassa G, Tápparo DC, Cândido D, Antes FG, Vanotti MB, Szögi AA, Kunz A (2021) Second-generation phosphorus: recovery from wastes towards the sustainability of production chains. Sustainability 13(11), 5919.
| Crossref | Google Scholar |
Jia L, Wei J, Zeng Q, Luo Q, Yan X, Wu J, Wei Z (2024) Phosphorus dissolution and diffusion from struvite and its impact on phosphorus availability in Acrisol and Cambisol soils. Soil Use and Management 40(1), e13031.
| Crossref | Google Scholar |
Johnston AE, Richards IR (2003) Effectiveness of different precipitated phosphates as phosphorus sources for plants. Soil Use and Management 19(1), 45-49.
| Crossref | Google Scholar |
McLaughlin MJ, McBeath TM, Smernik R, Stacey SP, Ajiboye B, Guppy C (2011) The chemical nature of P accumulation in agricultural soils – implications for fertiliser management and design: an Australian perspective. Plant and Soil 349(1–2), 69-87.
| Crossref | Google Scholar |
Meyer G, Frossard E, Mäder P, Nanzer S, Randall DG, Udert KM, Oberson A (2018) Water soluble phosphate fertilizers for crops grown in calcareous soils – an outdated paradigm for recycled phosphorus fertilizers? Plant and Soil 424, 367-388.
| Crossref | Google Scholar |
Morton JD (2020) A review of research on the effect of lime on New Zealand soils and pastures. New Zealand Journal of Agricultural Research 63(2), 189-201.
| Crossref | Google Scholar |
Murphy J, Riley JP (1962) A modified single solution method for the determination of phosphate in natural waters. Analytica Chimica Acta 27, 31-36.
| Crossref | Google Scholar |
Nash DM, McDowell RW, Condron LM, McLaughlin MJ (2019) Direct exports of phosphorus from fertilizers applied to grazed pastures. Journal of Environmental Quality 48(5), 1380-1396.
| Crossref | Google Scholar | PubMed |
Nongqwenga N, Muchaonyerwa P, Hughes J, Odindo A, Bame I (2017) Possible use of struvite as an alternative phosphate fertilizer. Journal of Soil Science and Plant Nutrition 17(3), 581-593.
| Crossref | Google Scholar |
Oliveira V, Horta C, Dias-Ferreira C (2019) Evaluation of a phosphorus fertiliser produced from anaerobically digested organic fraction of municipal solid waste. Journal of Cleaner Production 238, 117911.
| Crossref | Google Scholar |
Penn CJ, Camberato JJ (2019) A critical review on soil chemical processes that control how soil pH affects phosphorus availability to plants. Agriculture 9(6), 120.
| Crossref | Google Scholar |
Pierzynski GM, McDowell RW, Thomas Sims J (2005) Chemistry, cycling, and potential movement of inorganic phosphorus in soils. In ‘Phosphorus: agriculture and the environment’. (Eds J Thomas Sims, AN Sharpley, DT Westermann) pp. 51–86. (American Society of Agronomy, Inc., Crop Science Society of America, Inc., Soil Science Society of America, Inc.) 10.2134/agronmonogr46.c3
R Core Team (2023) ‘R: a language and environment for statistical computing.’ (R Foundation for Statistical Computing: Vienna, Austria) Available at https://www.R-project.org/
Richardson AE, Barea J-M, McNeill AM, Prigent-Combaret C (2009) Acquisition of phosphorus and nitrogen in the rhizosphere and plant growth promotion by microorganisms. Plant and Soil 321, 305-339.
| Crossref | Google Scholar |
Ryżak M, Bieganowski A (2011) Methodological aspects of determining soil particle-size distribution using the laser diffraction method. Journal of Plant Nutrition and Soil Science 174(4), 624-633.
| Crossref | Google Scholar |
Sample EC, Soper RJ, Racz GJ (1980) Reactions of phosphate fertilizers in soils. In ‘The role of phosphorus in agriculture’. (Eds FE Khasawneh, EC Sample, EJ Kamprath) pp. 263–310. (American Society of Agronomy, Inc. Crop Science Society of America, Inc. Soil Science Society of America Inc.) 10.2134/1980.roleofphosphorus.c12
Saunders WMH (1965) Phosphate retention by New Zealand soils and its relationship to free sesquioxides, organic matter, and other soil properties. New Zealand Journal of Agricultural Research 8(1), 30-57.
| Crossref | Google Scholar |
Schneider KD, Thiessen Martens JR, Zvomuya F, Reid DK, Fraser TD, Lynch DH, O’Halloran IP, Wilson HF (2019) Options for improved phosphorus cycling and use in agriculture at the field and regional scales. Journal of Environmental Quality 48(5), 1247-1264.
| Crossref | Google Scholar | PubMed |
Sperazza M, Moore JN, Hendrix MS (2004) High-resolution particle size analysis of naturally occurring very fine-grained sediment through laser diffractometry. Journal of Sedimentary Research 74(5), 736-743.
| Crossref | Google Scholar |
Talboys PJ, Heppell J, Roose T, Healey JR, Jones DL, Withers PJA (2016) Struvite: a slow-release fertiliser for sustainable phosphorus management? Plant and Soil 401(1–2), 109-123.
| Crossref | Google Scholar |
Thiessen Martens JR, Entz MH, Schneider KD, Zvomuya F, Wilson HF (2022) Response of organic grain and forage crops to struvite application in an alkaline soil. Agronomy Journal 114(1), 795-810.
| Crossref | Google Scholar |
Thiessen Martens JR, Srinathan OD, Amarakoon I (2023) Fertilizing effect of wastewater-derived granular struvite on contrasting Manitoba soils. Canadian Journal of Soil Science 103(1), 259-263.
| Crossref | Google Scholar |
Wang J, Xue L, Hou P, Hao T, Xue L, Zhang X, Sun T, Lobanov S, Yang L (2023) Struvite as P fertilizer on yield, nutrient uptake and soil nutrient status in the rice–wheat rotation system: a two-year field observation. Agronomy 13(12), 2948.
| Crossref | Google Scholar |
Withers PJA, Forber KG, Lyon C, Rothwell S, Doody D, Jarvie HP, Martin-Ortega J, Jacobs B, Cordell D, Patton M, Valero-Camargo MA, Cassidy R (2020) Towards resolving the phosphorus chaos created by food systems. Ambio 49, 1076-1089.
| Crossref | Google Scholar | PubMed |