

Revenue of consultant physicians for private out-patient consultations
Gary L. Freed A B C and Amy R. Allen AA Centre for Health Policy, Melbourne School of Population and Global Health, The University of Melbourne, Vic. 3010, Australia.
B Present address: Child Health Evaluation And Research (CHEAR) Center, University of Michigan Hospital and Health Systems, 300 N. Ingalls, Rm 6D12, Ann Arbor, MI 48109-5456, USA.
C Corresponding author. Email: gary.freed@unimelb.edu.au
Australian Health Review 43(2) 142-147 https://doi.org/10.1071/AH17274
Submitted: 1 December 2017 Accepted: 4 October 2018 Published: 18 December 2018
Journal Compilation © AHHA 2019 Open Access CC BY-NC-ND
Abstract
Objective The aim of this study was to determine the revenue to consultant physicians for private out-patient consultations. Specifically, the study determined changing patterns in revenue from 2011 to 2015 after accounting for bulk-billing rates, changes in gap fees and inflation.
Methods An analysis was performed of consultant physician Medicare claims data from 2011 to 2015 for initial (Item 110) and subsequent (Item 116) consultations and, for patients with multiple morbidities, initial management planning (Item 132) and review consultations (Item 133). The analysis included 12 medical specialties representative of common adult non-surgical medical care. Revenue to consultant physicians was calculated for initial consultations (Item 110: standard; Item 132: complex) and subsequent consultations (Item 116: standard; Item 133: complex) accounting for bulk-billing rates, changes in gap fees and inflation.
Results From 2011 to 2015, there was a decrease in inflation-adjusted revenue from standard initial and subsequent consultations (mean –$2.69 and –$1.03 respectively). Accounting for an increase in the use of item codes for complex consultations over the same time period, overall revenue from initial consultations increased (mean +$2.30) and overall revenue from subsequent consultations decreased slightly (mean –$0.28). All values reported are in Australian dollars.
Conclusions The effect of the multiyear Medicare freeze on consultant physician revenue has been partially offset by changes in billing practices.
What is known about the topic? There was a ‘freeze’ on Medicare schedule fees for consultations from November 2012 to July 2018. Concerns were expressed that the schedule has not kept pace with inflation and does not represent appropriate payments to physicians.
What does this paper add? Accounting for bulk-billing, changes in gap fees and inflation, revenue from standard initial and subsequent consultations decreased from 2011 to 2015. Use of item codes for complex consultations (which have associated higher schedule fees) increased from 2011 to 2015. When standard and complex consultation codes are analysed together (and accounting for bulk-billing, changes in gap fees and inflation), revenue from initial consultations increased and revenue from subsequent consultations decreased slightly.
What are the implications for practitioners? Efforts to control government expenditure through Medicare rebate payment freezes may result in unintended consequences. Although there were no overall decreases in bulk-billing rates, the shift to higher-rebate consultations was noticeable.
Additional keywords: clinical services, health services.
Introduction
The Medicare schedule fee is an amount set by the Federal Government as representative of reasonable charges for specific clinically relevant services.1 The schedule fee is stated to be calculated to account for the difficulty and time involved in providing the service, as well as other factors, such as major capital costs, direct costs (e.g. consumables) and indirect costs (e.g. salaries for administrative staff).2 The schedule fee for each eligible service is published in the Medicare Benefits Schedule (MBS).1
Medicare provides a set payment (rebate) of 85% of the schedule fee for most out-patient appointments to provide at least a partial offset of the cost to patients for private consultations.1 If the consultant chooses to ‘bulk-bill’ (i.e. accept the rebate from Medicare as full payment) there is no out-of-pocket cost to the patient. If consultants do not bulk-bill, they are allowed to set their fee at any amount they choose. In this scenario, the consultant receives the 85% rebate amount from Medicare and the patient must pay the difference as an out-of-pocket cost (a ‘gap fee’).
As part of a strategy to limit expenditure in the federal budget, schedule fees did not increase between November 2012 and July 2018. During this period of an effective ‘freeze’ on the schedule fees, the average annual inflation rate was 1.9%.3 As such, there has been significant concern expressed among doctors that the fee schedule has not kept pace with inflation, and currently does not represent appropriate payments for services,4–6 particularly against a backdrop of rising medical indemnity and practice administrative and overhead costs.7 The 2016 Federal Budget announced a continuation of the fee freeze until 2019–20, with estimates that this would save the government $925 million.8 (Note, all values reported are in Australian dollars.) However, this was overturned and the freeze on medical specialist consultation rebates ended on 1 July 2018.9
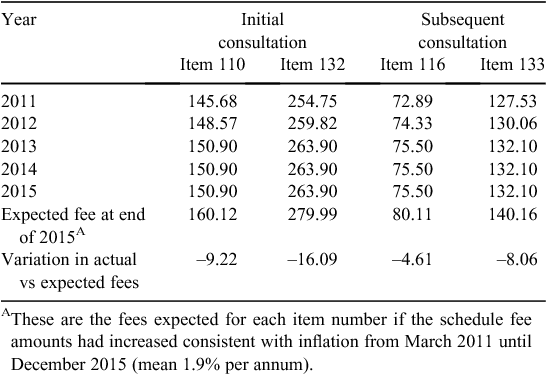
In January 2011, the schedule fee for a standard initial consultation by a consultant physician (Item 110) was $145.20 (benefit amount = $123.45), whereas that for a standard subsequent consultation (Item 116) was $72.65 (benefit amount = $61.80).10 There was a small increase in November 2011 and again in November 2012, taking the schedule fee (and benefit amount) for Item 110 to $150.90 (benefit amount $128.30) and for Item 116 to $75.50 (benefit amount $64.20).11,12 There were no further increases until July 2018.
Where a patient has two or more morbidities (e.g. complex congenital, developmental or behavioural disorders) and a consultant physician spends at least 45 min developing an initial treatment and management plan, the consultant can claim Medicare Item 132.1 Over the following 12 months, a subsequent review of the management plan (lasting at least 20 min) is payable via Item 133. However, Item 133 can only be used twice within a 12-month period, after which the lower-fee Item 116 must be used.1 In 2016, the schedule fee for Item 132 was 75% higher than for Item 110. Similarly, the schedule fee for Item 133 was 75% higher than the fee for Item 116.1
In the 2015 calendar year, Medicare processed initial consultation claims for over 2.3 million consultations for Item 110 and over 837 000 consultations for Item 132.13 Over the same period, there were more than 8.3 million subsequent consultations using Item 116 and over 563 000 using Item 133.13 Although there are other item codes available for consultant physicians attendances, no other item was used more than 100 000 times during 2015.13
The present study examined average revenue from private out-patient consultations for the years 2011–15, accounting for the effects of inflation and the rate of bulk-billing.
Methods
The Medicare schedule fee for each year, for any specialty, was calculated as the average MBS published fee amount across the months of the year for each item number of interest.
This study examined aggregate non-identifiable Medicare claims rendered between 1 April 2011 and 31 December 2015 obtained from the Commonwealth Department of Human Services (DHS). The primary Medicare item numbers of interest were Item 110 (initial consultation) and Item 116 (subsequent consultation in the same course of treatment) with a consultant physician following a referral.1 We also analysed Item 132 (initial assessment and management plan of a patient with multiple morbidities, lasting at least 45 min) and Item 133 (review of management plan for a patient with multiple morbidities, lasting at least 20 min).1 To prevent the potential identification of any specific providers through the data, DHS imposed the suppression of data in instances where there were fewer than 20 of these services provided in a specific specialty in a state or territory.
The data provided by DHS included the number of initial and subsequent out-patient medical consultations for which a claim for benefit was made. These included separate counts of the absolute number of bulk-billed versus non-bulk-billed visits. Whenever a Medicare claim is made for a non-bulk-billed service, the actual charge for the visit must be provided to the DHS as part of the claim. The data obtained from DHS included the mean, median and 10th and 90th percentiles of actual consultation charges. These data were organised by medical specialty and state/territory of the doctor providing the service.
We analysed service charge data from 12 medical specialties representative of common adult non-surgical medical care provided by consultant physicians. The specialties were: cardiology, endocrinology, gastroenterology, general medicine, geriatric medicine, haematology, immunology/allergy, medical oncology, nephrology, neurology, respiratory medicine and rheumatology.
The mean revenue for each Medicare item number was calculated separately as follows:
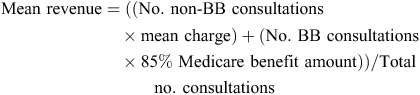
where BB is bulk-billed. We accounted for the rate of inflation across the years 2011–15, converting all dollar amounts into 2015 equivalent dollars using the inflation calculator available on the website of the Reserve Bank of Australia (http://www.rba.gov.au/calculator/, accessed 23 November 2018).
This study received ethics approval from The University of Melbourne Human Research Ethics Committee (Reference 1646466.1).
Results
MBS fees from 2011–15
The average schedule fee amount for Items 110, 116, 132 and 133 are given in Table 1.
|
Changes in bulk-billing rate over time
For most specialties in this study, the mean proportion of visits that were bulk-billed tended to increase over the years from 2011 to 2015. Geriatric medicine was an exception, where bulk-billing rates decreased for all four item numbers examined.
In most specialties in most years, item numbers corresponding to patients with multiple morbidities (Items 132 and 133) tended to be bulk-billed more commonly than the similar standard consultation codes (Items 110 and 116; Table 2).

|
Mean revenue for Item 110
Table 3 shows that from 2011 to 2015, when accounting for bulk-billing rates, changes in gap fees and inflation, most specialties saw a decrease in mean revenue for each Item 110 (initial consultation) completed. The notable exception was immunology/allergy, where revenue per initial consultation increased by $7.73. Neurology and rheumatology were the only other specialties that did not show a revenue decrease. The largest decrease in revenue per Item 110 was seen in geriatric medicine, where, in 2015, consultants on average received $7.44 less per initial consultation (in 2015 equivalent dollars) than in 2011.

|
Accounting for bulk-billing rates and differing gap fees, in 2015 the mean revenue for an immunologist/allergist for each Item 110 (initial consultation) completed ($219.91) was at least $13 greater than other specialties. In 2015, medical oncologists had the lowest average revenue per Item 110 completed, receiving an average of $160.17.
Revenue for an initial consultation (Items 110 and 132 combined)
Accounting for both bulk-billing rates and differing gap fees, in 2015 the mean revenue for an initial consultation (Item 110 or 132) was highest for neurologists ($251.64) and rheumatologists ($246.78). These two specialties consistently showed the highest revenue for an initial consultation throughout the period 2011–15 (Table 3).
Accounting for bulk-billing rates, changes in gap fees and inflation, neurologists saw the largest positive change in revenue for an initial consultation across the period 2011–15, receiving, on average, $19.30 more per initial consultation (Items 110 and 132) in 2015 than in 2011 (in 2015 equivalent dollars).
Revenue for Item 116
Accounting for bulk-billing rates and differing gap fees, in 2015, the mean revenue for each Item 116 (subsequent consultation) completed was highest for neurologists ($105.29) and rheumatologists ($103.21). All other specialties examined fell within the range from $87.27 (haematologists) to $96.37 (endocrinologists; Table 4).

|
From 2011 to 2015, after accounting for bulk-billing rates, changes in gap fees and inflation, most specialties saw a decrease in the mean revenue for each Item 116 (subsequent consultation) completed, the largest decrease being in medical oncology (–$3.56 in 2015 equivalent dollars).
Revenue for a subsequent consultation (Items 116 and 133 combined)
Accounting for bulk-billing rates and differing gap fees, in 2015 the mean revenue for a subsequent consultation (Item 116 or 133) was highest for neurologists ($113.04) and rheumatologists ($108.95; Table 4). These two specialties showed the highest average revenue for a subsequent consultation throughout the period 2011–15.
Accounting for bulk-billing rates, changes in gap fees and inflation, neurologists saw the largest positive change in revenue for a subsequent consultation from 2011 to 2015, receiving, on average, $5.16 more per subsequent consultation (Items 116 and 133) in 2015 than in 2011 (in 2015 equivalent dollars).
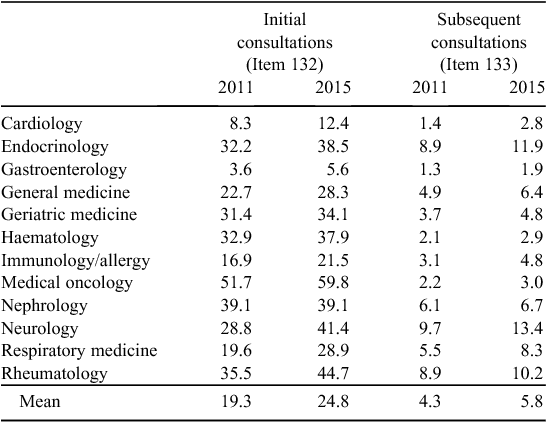
Use of Items 132 and 133
Table 5 shows that the proportion of initial consultations using Item 132, relative to Item 110, increased for all specialties examined (except neurology) over the period 2011–15. Similarly, relative to Item 116 (standard subsequent consultation), the proportional use of Item 133 (complex subsequent consultation) increased for all specialties examined from 2011 to 2015.
|
Medical oncologists used Item 132 for a greater proportion of their initial consultations than any other specialty (59.8% coded as Item 132 in 2015). Neurologists used Item 133 for a greater proportion of their subsequent consultations than any other specialty (13.4% coded as Item 133 in 2015). Gastroenterologists and cardiologists used the item codes for complex patients (Items 132 and 133) a smaller proportion of the time compared with the other specialties examined.
Discussion
When accounting for the rate of bulk-billing, the mean inflation-adjusted revenue for a standard initial or subsequent consultation tended to decrease for most specialties from 2011 to 2015. This effectively means that, on average, consultant physicians in the specialties examined were earning $2.69 less per standard initial consult (Item 110) and $1.03 less per standard subsequent consult (Item 116) in 2015 than they did 4 years prior. In order to decrease federal budget expenditure, MBS schedule fees for consultations were frozen during most of that time.4–6
There have been concerns among medical professional associations, such as the Australian Medical Association (AMA), that consultation fees have not kept pace with inflation and rising medical practice operating costs.7 Data from the Australian Bureau of Statistics show that the overall cost of medical and hospital services (including insurance) rose by approximately 33% from 2011 to 2014,14 approximately 23% greater than the rate of inflation.3 The AMA recommends to its doctor members fee levels for consultations and procedures that it considers appropriate, fair and reasonable. The AMA list published in November 2014 recommended consultant physician fees that are approximately double the MBS schedule fee amounts: $310 for Item 110 and $142 for Item 116.15 Statements from the AMA have included comments that as a result of the Medicare freeze, doctors may have to decide between decreasing bulk-billing or potentially shortening the time spent with each patient in order to recoup income.5 This has the potential to affect patient access to care or the quality of care provided.
From 2011 to 2015, the item codes for complex consultations (Items 132 and 133) were being used increasingly more commonly relative to the codes for standard consultations (Items 110 and 116). Consultants receive a 75% higher rebate on the item codes for complex consultations than for standard consultations. When accounting for inflation, bulk-billing and the increase in use of Item 132, the mean revenue for an initial consultation tended to increase (+$2.30 on average) for most specialties examined across from 2011 to 2015, although some specialties still saw a marked decrease. When accounting for the increase in the use of Item 133, and with inflation and bulk-billing taken into account, the mean revenue for a subsequent consultation tended to decrease (–$0.28 on average) for the specialties examined from 2011 to 2015. With more than 3.1 million initial consultations (Items 110 and 132) and more than 8.8 million subsequent consultations (Items 116 and 133) taking place in 2015,13 even a small change in revenue per consultation can have a big effect on the health system.
Concerns have been expressed in the popular press that the rebate freeze will lead to doctors offering fewer bulk-billed consultations.5 We found that bulk-billing rates tended to increase slightly for most of the specialties examined from 2011 to 2015. Complex consultations were typically bulk-billed more commonly than standard consultations, although there was some variation among the specialties examined.
Changes in revenue across the period 2011–15 varied markedly between specialties. For example, neurologists and immunologists/allergists experienced increases in revenue across all item codes examined, whereas other specialties (and the aggregate across the 12 specialties) experienced decreases in revenue for the same item codes during the same period. It is difficult to explain why the trend in revenue patterns of immunologists/allergists differs from that of other specialties examined. It is known from previous studies that the mean and median fees in 2015 for immunologist/allergist consultations were higher than fees in other specialties examined.16
Study limitations
Fees and bulk-billing rates are known to vary widely within and between specialties, as well as between the states and territories.16 It is a limitation of the present study that case-by-case data were not available to enable testing of statistical significance. However, with millions of consultations included in the data, even the small differences observed are likely to be significant.
Although this study revealed increasing use of complex item codes, it is unknown why this has occurred. Possibilities include increasing complexity of overall patient presentations, changes in health service availability for patients with multiple morbidities or conscious or unconscious changes in consultants’ billing practices. With regard to the MBS stipulation that a complex initial consultation (Item 132) lasts at least 45 minutes and a complex subsequent consultation (Item 133) lasts at least 20 minutes, it should be noted that there is currently no effective and efficient method to systematically verify time spent completing consultations.
The trends identified in bulk-billing rates and revenue would not necessarily be reflective of the billing practices of every consultant physician in Australia. It is not possible to determine what the differences in revenue observed for the examined Medicare items mean in the overall scheme of consultant physician earnings. With the freeze on MBS indexation of medical specialist consultation rebates having been lifted in July 2018,9 medical specialists’ revenue patterns (and bulk-billing practices) might now change.
Conclusion
There have been concerns that the effect of the Medicare rebate freeze on doctor’s revenue may have had potential consequences for the population, such as decreases in bulk-billing rates affecting financial access to care. When the effects of inflation and bulk-billing rates are taken into account, on average consultant physicians in the medical specialties examined had less revenue for each standard initial (Item 110) and subsequent (Item 116) consultation in 2015 than in 2011. Over the same time period, the use of the codes for complex consultations (which carry higher rebates) increased markedly. This change in billing practices resulted in a slight increase in specialists’ revenue after accounting for inflation and bulk-billing for initial consultations and relative stability for subsequent consultations in 2015 compared with 2011. Changes in billing practices may or may not have been conscious decisions made by doctors to offset the effect of the Medicare freeze on revenue.
Competing interests
The authors declare no competing interests.
Acknowledgements
This research did not receive any specific funding.
References
[1] Department of Health. Medicare benefits schedule book: operating from 01 January 2016. Canberra: Commonwealth of Australia; 2014.[2] Consumers Health Forum of Australia. Frequently asked questions about Medicare, the Medicare Benefits Schedule and the Medicare Benefits Schedule listing process. Canberra: Consumers Health Forum of Australia; 2013. Available at: http://web.archive.org/web/20160311230215/https://chf.org.au/fac-freq-asked-questions-MBS.chf [verified 23 November 2018].
[3] Reserve Bank of Australia. Historical series and explanatory notes. 2018. Available at: https://www.rba.gov.au/statistics/tables/xls/g01hist.xls?v=2018-11-23-09-57-48 [verified 23 November 2018].
[4] Australian Medical Association. Medicare undermined as rebates kept in deep freeze. 2015. Available at: https://ama.com.au/media/medicare-undermined-rebates-kept-deep-freeze [verified September 2017].
[5] Australian Medical Association. AMA transcript – Medicare rebate freeze. 2016. Available at: https://ama.com.au/media/ama-transcript-medicare-rebate-freeze [verified September 2017].
[6] Hoffman T. Freeze will cost GPs $50,000 in 2019. Australian Doctor 4 May 2016. Available at: https://www.australiandoctor.com.au/news/exclusive-freeze-will-cost-gps-50000-2019 [verified 15 November 2018].
[7] Australian Medical Association. Health costs rise as rebate freeze bites. 2016. Available at: https://ama.com.au/ausmed/health-costs-rise-rebate-freeze-bites [verified September 2017].
[8] Dickinson H, Gillespie J, Woods M, Moodie R, Duckett S. Federal budget 2016: health experts react. The Conversation 3 May 2016. Available at: https://theconversation.com/federal-budget-2016-health-experts-react-58638 [verified September 2017].
[9] Commonwealth of Australia. Budget 2017–18: guaranteeing the essentials. 2017. Available at: http://www.budget.gov.au/2017-18/content/glossies/essentials/html/essentials-00.htm [verified September 2017].
[10] Department of Health. Medicare benefits schedule book: operating from 01 January 2011. Canberra: Commonwealth of Australia; 2010.
[11] Department of Health. Medicare benefits schedule book: operating from 01 November 2011. Canberra: Commonwealth of Australia; 2011.
[12] Department of Health. Medicare benefits schedule book: operating from 01 November 2012. Canberra: Commonwealth of Australia; 2012.
[13] Australian Government, Department of Human Services. All Medicare items in ‘Group: A4 Consultant Physician (other than Psychiatry)’ processed from January 2015 to December 2015. http://medicarestatistics.humanservices.gov.au/statistics/do.jsp?_PROGRAM=/statistics/mbs_ item_standard_report&VAR=services&STAT=count&PTYPE=calyear&START_DT=201501&END_DT=201512&RPT_FMT=by+state&DRILL=ag&GROUP=A0401 [verified August 2017].
[14] Australian Bureau of Statistics. 6401.0 – Consumer Price Index, Australia, Mar 2016. Table 8. CPI: Analytical series, weighted average of eight capital cities. 2016; Available at: http://www.abs.gov.au/AUSSTATS/abs@.nsf/DetailsPage/6401.0Mar%202016?OpenDocument [verified August 2017].
[15] Australian Medical Association (AMA). List of medical services and fees. Canberra: AMA; 2014.
[16] Freed GL, Allen AR. Variation in outpatient consultant physician fees in Australia by specialty and state and territory. Med J Aust 2017; 206 176–80.
| Variation in outpatient consultant physician fees in Australia by specialty and state and territory.Crossref | GoogleScholarGoogle Scholar |