Measuring the economic impact of hospital-acquired complications on an acute health service
Liam Fernando-Canavan A B C , Anthony Gust
  B , Arthur Hsueh
  A , An Tran-Duy
  A , Michael Kirk
  B , Peter Brooks
  A B and Josh Knight
  A
A
A Centre for Health Policy, The University of Melbourne, 207 Bouverie Street, Carlton, Vic. 3053, Australia. Email: ahsueh@unimelb.edu.au; an.tran@unimelb.edu.au; brooksp@unimelb.edu.au; josh.knight@unimelb.edu.au
B Northern Health, 185 Cooper Street, Epping, Vic. 3076, Australia. Email: anthony.gust@nh.org.au; michael.kirk@nh.org.au
C Corresponding author. Email: l.fernandocanavan@unimelb.edu.au
Australian Health Review 45(2) 135-142 https://doi.org/10.1071/AH20126
Submitted: 5 June 2020 Accepted: 9 September 2020 Published: 18 December 2020
Journal Compilation © AHHA 2021 Open Access CC BY-NC-ND
Abstract
Objective This study determined the economic impact of 16 ‘high-priority’ hospital-acquired complications (HACs), as defined by the Australian Commission on Safety and Quality in Health Care, from the perspective of an individual Australian health service.
Methods A retrospective cohort study was performed using a deidentified patient dataset containing 93 056 in-patient separations in Northern Health (Victoria, Australia) from 1 July 2016 to 30 June 2017. Two log-linked generalised linear regression models were used to obtain additional costs and additional length of stay (LOS) for 16 different HACs, with the main outcome measures being the additional cost and LOS for all 16 HACs.
Results In all, 1700 separations involving HACs (1.83%) were identified. The most common HAC was health care-associated infections. Most HACs were associated with a statistically significant risk of increased cost (15/16 HACs) and LOS (11/16 HACs). HACs involving falls resulting in fracture or other intracranial injury were associated with the highest additional cost (A$17 173). The biggest increase in additional LOS was unplanned admissions to the intensive care unit (5.42 days).
Conclusions This study shows the economic impact of HACs from the perspective of an individual health service. The methodology used demonstrates how other health services could determine safety priorities corresponding to their own casemix.
What is known about the topic? HACs are a major issue in Australian health care; however, their effect on cost and LOS at the individual health service level is not well quantified.
What does this paper add? Additional cost and LOS implications for 16 high-priority HACs have been quantified within an Australian health service. There is substantial variation in terms of the number of HACs and the economic impact of each HAC.
What are the implications for practitioners? This study provides a template for other health services to assess the economic impact of HACs corresponding to their own casemix and to inform targeted patient safety programs.
Keywords: activity-based funding, clinical coding, financial management, health classification, health economics, health services administration, hospital-acquired complications (HACs); hospital-acquired conditions, hospital, International Classification of Diseases, medical classification, patient safety, quality and safety, value-based health care.
Introduction
Health services function as high-hazard organisations striving to deliver a triple aim of high-quality, accessible and cost-effective care.1 However, health services worldwide are buckling under the pressure of growing demand. Although initiatives over the past few decades have been focused on reducing hospital length of stay (LOS) in order to cope, the improvements in efficiency for these strategies has plateaued in recent years, with the focus shifting towards incentives to improve the quality of care. One such incentive involves reducing preventable harm associated with hospital-acquired complications (HACs). HACs are defined by the Australian Commission on Safety and Quality in Health Care (ACSQHC) as ‘a patient complication for which clinical risk mitigation strategies may reduce (but not necessarily eliminate) the risk of that complication occurring’.2
The ACSQHC designates 16 medical conditions (Box 1) that occur as an HAC. If a patient develops one or more of these 16 conditions during an admission to an Australian hospital, the ACSQHC considers the patient to have experienced an HAC. The list of the 16 HACs was developed by the ACSQHC based on a computer algorithm known as the Classification of Hospital-Acquired Diagnoses (CHADx), which is used to classify 144 different classes of adverse patient events in coded hospital data.3
| Box 1. The 16 hospital-acquired complications, as defined by the Australian Commission on Safety and Quality in Health Care,2 included as independent variables in this analysis |
|
The coded hospital data developed after a patient is discharged from an Australian hospital is prepared by clinical coders, a skilled workforce working in partnership with the treating medical staff to ensure each patient’s discharge summary and its diagnoses are coded appropriately and correctly.4 Clinical coders can apply a condition-onset flag (COF) to a particular diagnosis, indicating it occurred after admission into hospital. If a COF is present with one of the 16 diagnoses that can occur as an HAC, then a patient would be considered to have suffered an HAC.5
Cost of HACs
In an attempt to try to decrease the incidence of HACs, Australia’s Independent Hospital Pricing Authority (IHPA) developed a method for risk-adjusted hospital funding penalties that incorporates the list of HACs to penalise hospitals each time a patient develops an HAC.6 This approach also seeks to avoid any perverse incentives associated with HACs and current activity-based funding models. An example of a perverse incentive could be additional funding associated with extended length of stay (LOS), which is associated with HACs. This would result in the hospital receiving higher funding for an equivalent patient with an HAC. The HAC penalties have not been enforced by all state governments, but in some states, such as Victoria, they are undergoing a shadow period during the 2019–20 financial year with the potential to be enforced in 2020–21.7
The implementation of penalties associated with HACs is a contentious issue in the Australian medical community. The Australian Medical Association (AMA) suggests that the added time and cost of treating a patient due to an HAC should act as an incentive for hospitals to minimise HACs due to the prevailing model of funding hospital-based care in Australia.8 In its simplest form, the current casemix-based funding model determines reimbursement for each hospital admission based on the national average cost of treating all patients with similar conditions, thereby reducing incentives to have a patient population with substantially greater than average resource usage.9 However, many implementations of this funding model have adjustments for patients where the LOS falls substantially outside the average range,10 a population that could potentially include patients with HACs.
Indeed, HACs have been shown to be associated with significant costs for Australian hospitals, beginning with an assessment of HACs in 2005–06 and 2006–07 in Victoria and Queensland respectively that showed annual costs of A$790 million in both states combined.11 In 2013, work between the IHPA and ACSQHC estimated HACs increased the mean cost of an Australian hospital admission by A$9200 and the mean LOS by 5.3 days.12 The Grattan Institute estimated that in 2014–15, A$4.6 billion was added to the national cost of treating acute admissions associated with complications in Australian public hospitals.13 Although information has been reported on the broader implications of HACs in Australia, there is limited data on both cost and LOS consequences for HACs at the individual health service level. Using a large, recent and high-quality dataset, we aimed to estimate both the frequency and the cost and LOS impacts at the level of individual HACs within a major health service.
Methods
A retrospective cohort study was conducted using a dataset consisting of all admissions to one of Victoria’s major metropolitan health services, Northern Health (NH), in the financial year 1 July 2016–30 June 2017. The dataset is an extraction of deidentified routinely collected hospital-based data containing administrative and coded medical information. In addition to HAC data, the dataset contained admission type, demographic data, LOS and a linked costing dataset for the costs associated with each separation. All data used in the analysis were collected and coded by NH clinical coders as part of their Victorian Department of Health and Human Services reporting requirements.
Hospital-acquired complications
The assessment of HACs was based on the definitions provided by the ACSQHC. Descriptions of the HACs are given in Box 1, and details of International Classification of Diseases, 10th Revision, Australian Modification (ICD-10-AM) coding associated with HACs can be assessed from the ACSQHC directly.14 HACs were classified on the basis of patient notes by professional coders in the course of routine data administration following discharge or transfer. Only previously coded clinical data was used in the analysis and patient notes were not accessed for our analysis. HACs were recorded in two ways: (1) a binary variable indicating whether a patient experienced any one of the 16 HACs during a separation; and (2) a continuous variable recording the total number of HACs a patient experienced in a separation. HACs, as recorded, are not mutually exclusive and during any one separation a patient could experience two or more of the 16 HACs.
Main outcome variables
The NH administrative systems provided a bottom-up clinical costing approach. Each time a resource was used by a patient during a hospital stay, the utilisation and related costs were linked to their medical record number.15 The total dollar amount of each in-patient separation was recorded in 2017 Australian dollars. LOS was also derived from the NH administrative systems and recorded in whole days, where a stay of <1 would be recorded as 0 days (i.e. a same-day hospital admission).
Statistical analysis
To examine the effect of HACs on cost and LOS, we used two separate generalised linear models (GLMs) to control for skewed distribution and non-negative responses: (1) a GLM with a log-link and Poisson distribution used to analyse LOS;16 and (2) a GLM with a log-link and a gamma distribution used to analyse cost.17 All HACs and other covariates were included as potential predictors in each model.
Potential confounding variables included in the model were age, sex, Charlson Comorbidity Index (CCI), admission type and care type. Admission type was defined as medical, emergency, maternity, paediatric or surgical, and care type was defined as acute, geriatric evaluation management (GEM), palliative, rehabilitation or unqualified newborn. The reference groups in the regression model for speciality and care type were medical and acute respectively.
The output of both regression models consisted of coefficients that can be interpreted multiplicatively, rather than additively. The exponential value of a β-coefficient (exp(β)) from the GLM model for cost represents the mean ratio (i.e. the ratio of the mean cost in patients with an HAC to the mean cost in patients without that HAC), whereas exp(β) from the GLM model for LOS represents the incidence rate ratio (IRR), that is the ratio of LOS in patients with an HAC to LOS in patients without that HAC.
Calculation of additional cost and LOS of an HAC
The additional cost and additional LOS were quantified using the outputs from the regression models, adjusted for age, sex, CCI, admission type and care type. The mean ratio or IRR for each HAC was then applied across all in-patient separations, with all other variables in the respective model held constant, to calculate the mean predicated value if each individual were to develop a particular HAC (i.e. the additional cost or LOS of an HAC). Stata version 13.0 (StataCorp, College Station, Texas, USA) was used for the analysis.
Ethics approval
Ethics approval was provided by The University of Melbourne Human Ethics Sub-Committee (HREC no. 1954816.1). The project was also deemed a quality initiative by the NH Low Risk Ethics Committee and approval was obtained.
Results
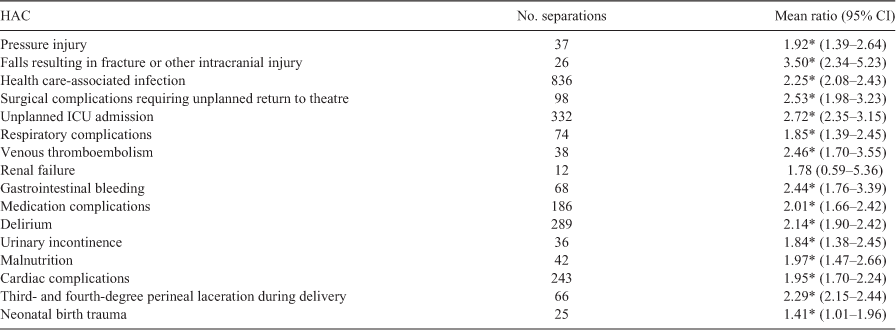
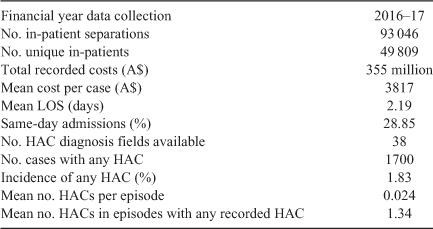
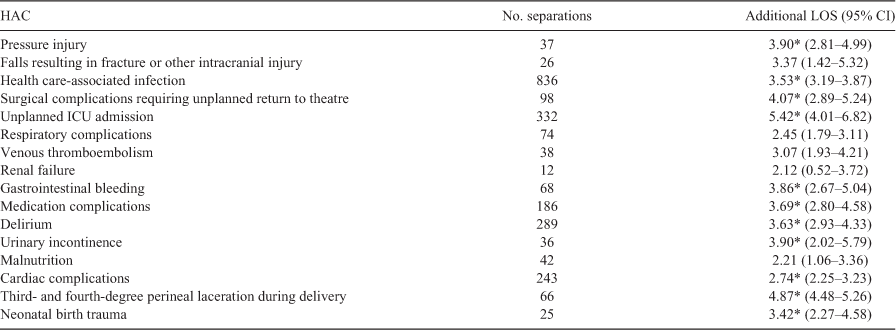
The number of in-patient separations at NH during the study period was 93 046, consisting of 49 809 unique patients. There were 1700 in-patient separations including at least one HAC; for patients who developed an HAC, the mean number of HACs was 1.34 HACs per separation (Table 1). The most commonly occurring HACs were health care-associated infection (n = 836), unplanned intensive care unit (ICU) admission (n = 332) and delirium (n = 289). The least frequently occurring HACs were falls resulting in fracture or other intracranial injury (n = 26), neonatal birth trauma (n = 25) and renal failure (n = 12; Table 2).
|
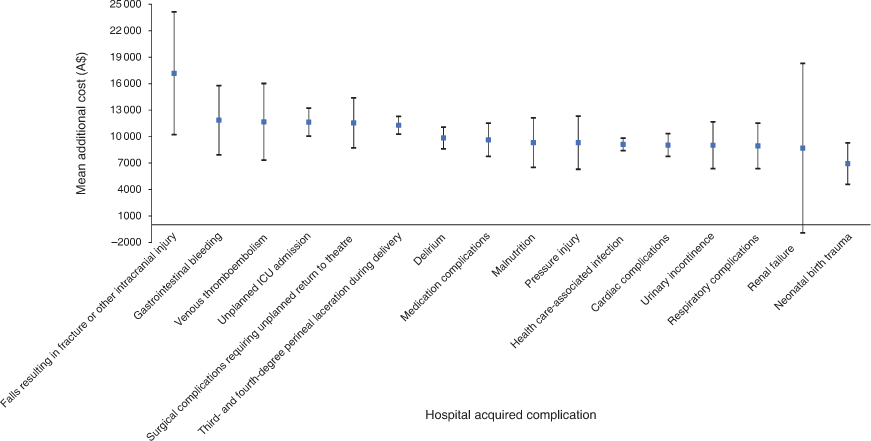
Falls resulting in fracture or other intracranial injury had the highest risk associated with an increase in cost (mean ratio 3.50; 95% confidence interval (IC) 2.34–5.23), followed by unplanned ICU admission (mean ratio 2.72; 95% CI 2.35–3.15) and surgical complications requiring unplanned return to theatre (mean ratio 2.72; 95% CI 1.98–3.23; Table 2). Most HACs (15/16) were associated with statistically significant increases in costs and only the renal failure HAC was not associated with increased costs. The falls resulting in fracture or other intracranial injury HAC had the highest additional cost of all HACs (A$17 173 per separation; 95% CI 10 214–24 131; Table 3), but this particular HAC was relatively rare (n = 26). Costs per HAC occurrence are shown in Fig. 1, arranged in decreasing cost with CIs.
|
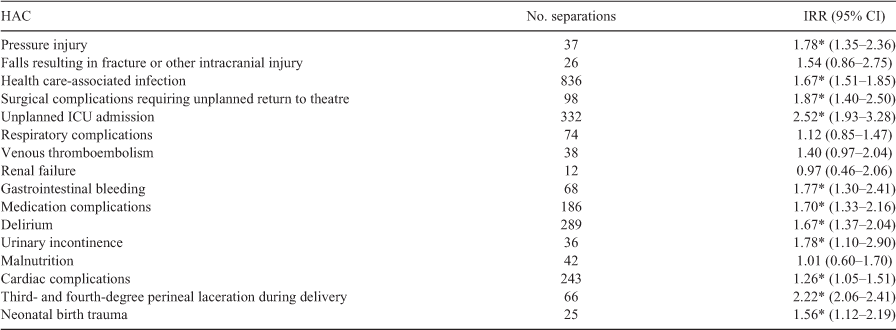
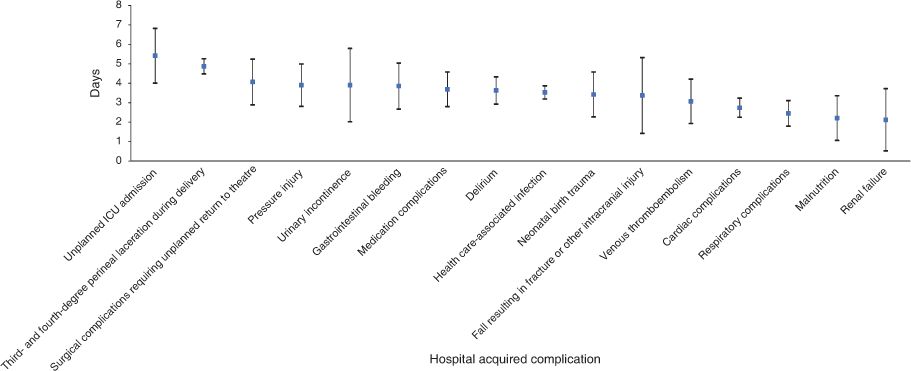
Increased LOS and the occurrence of HACs also showed a strength and direction of association, with 11 of the 16 HACs reporting a statistically significant risk of increased LOS (Table 4). The unplanned ICU admission HAC was associated with a 152% increase in LOS (IRR 2.52; 95% CI 1.93–3.28), followed by third- and fourth-degree perineal laceration during delivery (IRR 2.22; 95% CI 2.04–2.41) and surgical complications requiring unplanned return to theatre (IRR 2.22; 95% CI 1.40–2.50; Table 4). There was no statistically significant evidence of an increase in the LOS associated with individuals having the renal failure, malnutrition or respiratory complications HACs. The unplanned ICU admission HAC had the highest additional LOS, with an increased mean LOS of 5.43 days (95% CI: 4.01 to 6.82) in patients experiencing this HAC compared with an otherwise similar patient (Table 5). Increased LOS per HAC occurrence is shown in Fig. 2, arranged in decreasing order of impact with associated CIs.
|
|
Discussion
Identifying the HACs that have a high impact on an individual health service and its patients is an important first step towards creating a safer hospital environment and understanding the economic burden associated with the HACs.18 Catastrophic adverse patient events and HACs are also gaining significant media attention, putting pressure on health services and placing health care safety and quality in the national spotlight, with a need for more clarity of patient outcomes.19,20 The inability to measure and understand the impact of HACs places limitations on the capacity of a health service to effectively seek to prevent them. Therefore, when the impact of HACs can be measured, as with the approach used in the present study, their economic consequences can be incorporated into a value-based healthcare framework.21 By combining accurate cost and outcome measurements, a health system can systematically attempt to reduce HAC incidence and therefore greatly increase the value of health care delivered to patients through improved outcomes and a reduction in the total costs involved with patient care.22
As shown in the present analysis, there was heterogeneity in the impact of individual HACs on NH. Although health care-associated infections were the most frequently occurring HAC, falls resulting in fracture or other intracranial injury and unplanned ICU admission actually had the largest effects on cost and LOS respectively. The additional information provided by this study can be used by NH to inform strategies targeting less-frequent, but higher-impact HACs. For example, since the analysis has been completed, a Code Fall team has been implemented at NH in response to the impact of the falls resulting in fracture or other intracranial injury HAC.
Previous work has shown increases in cost and LOS for HACs on a national scale, and an increase in LOS only at the individual health service level.12,23 The present study extends this research by demonstrating increases in both cost and LOS at an individual health service level in a contemporary dataset. The study also provides other health services with an analytical template to quantify the economic impact of HACs and subsequently develop tailored patient safety efforts corresponding to their own casemix.
The present study has several strengths. One strength is the use of a large linked administrative dataset to provide both cost and LOS implications of HACs as defined by the ACQSHC on an individual health service for the first time. Using linked hospital data is a useful method for monitoring healthcare system performance and can represent a key step in improving health policy.24 The universal capture of admissions to a health service prevents selection bias and allows for a large sample size, therefore increasing the detection rate of rare and potentially high-consequence events. The use of statistical techniques appropriate to the data and context strengthens the validity of our results, and the use of GLM models to appropriately adjust for skewed data and control for a range of potential confounders provides robust estimates of effect.
However, the study also has limitations that should be considered when interpreting the results. The consequences attributed to HACs in this study only represent those incurred by NH during each in-patient separation. As such, the results do not any include any flow-on costs from HACs, such as out-of-pocket costs for patients or further contact with the broader health system following discharge. As a consequence, these findings are likely to be a conservative estimate of the full system costs associated with HACs.
HACs occurring after discharge that are discovered in the community would generally be treated in the community, or as a second episode of hospital care, and these costs would not be captured in the present study.25 This is a reflection of the current funding system; in particular, resources associated with HACs in other spheres of the Australian health service (e.g. primary care) have a limited effect on NH. Therefore, an analysis focused on the in-hospital consequences has greater applicability to decisions on the introduction of NH-focused HAC-mitigation strategies. This limited scope does restrict the ability to assess the full impact of an HAC and the benefits of eliminating them, and future analysis would benefit from a systematic view of the impact of HACs.
We controlled for age, sex, CCI, admission type and care type when calculating the estimated difference in cost and LOS between patients with and without an HAC. However, these estimates may be improved in the future through the inclusion of additional admission-specific factors, such as diagnosis-related groups or ICD coding. Furthermore, the results of this study are contingent on the quality of the administrative dataset, where low-quality coding of data may underrepresent the number of events detected.26 Although a hospital’s administrative data may not be a verbatim record of the clinical picture for each patient, it is the major source of information used by the Victorian Government for funding, performance monitoring, service planning and quality of care.7 In order to ensure quality and safety initiatives developed from administrative data translate into safer long-term care, continuously evolving the partnership between clinical coders and the treating medical team should help translate patient notes into appropriately defined ICD-10-AM codes.27
The HACs used in this analysis, as defined by the ACSQHC, are arguably limited in scope and highly aggregated.2 A more sensitive tool, such as the CHADx algorithm, may have detected complications that are not captured by the current HACs list or found important subpopulations within the aggregated HACs list.5 For example, the HACs list only includes Stages III and IV pressure injuries, whereas CHADx encompasses Stages I–IV pressure injuries. Although a more detailed capture of HACs may give a more granular view, this can cause separate issues. In our 100% sample of 1 year’s admissions to a large metropolitan health service, certain HACs were still quite rare, despite the use of the aggregated ACSQHC definitions. Therefore, using a very fine-grained assessment tool could suffer from low levels of detection that can then lead to a limited ability to detect statistically significant changes in reasonable time periods.
Conclusion
As health systems transition away from traditional activity-based funding models towards the principles of value-based health care, organisations having a firm understanding of the costs associated with preventable harm will be become increasingly relevant. This study found there was substantial variation between the impact of HACs within an individual health service. A minority of HACs were found to have a limited effect on cost and LOS. Other HACs, such as falls resulting in fracture or other intracranial injury and unplanned admissions to the ICU, were associated with substantial additional cost (A$17 173 and A$11 640 respectively) and LOS (3.37 and 5.42 days respectively). This study has also established a method for assessing the economic impact of individual HACs and could be used by other individual health services to develop their own targeted clinical risk minimisation strategies to influence a value-based healthcare approach.
Competing interests
The authors declare no potential conflicts of interest with respect to the research, authorship and/or publication of this article.
Acknowledgements
Liam Fernando-Canavan completed this work as a postgraduate student of The University of Melbourne within the Melbourne School of Population and Global Health. An Tran-Duy and Josh Knight are supported by the Australian Research Council’s Centre of Excellence in Population Ageing Research. The authors acknowledge Bill Shearer (Northern Health – Quality, Safety and Transformation) for preliminary investigation into costing and clinical incidents. This research did not receive any specific grant from funding agencies in the public, commercial or not-for-profit sectors.
References
[1] Berwick DM, Nolan TW, Whittington J. The triple aim: care, health, and cost. Health Aff (Millwood) 2008; 27 759–69.| The triple aim: care, health, and cost.Crossref | GoogleScholarGoogle Scholar | 18474969PubMed |
[2] Australian Commission on Safety and Quality in Health Care. HACs information kit. 2018. Available at: https://www.safetyandquality.gov.au/our-work/indicators-measurement-and-reporting/complications/hacs-information-kit [verified 13 November 2020].
[3] Shepheard J, Lapiz E, Read C, Jackson TJ. Reconciling hospital-acquired complications and CHADx+ in Victorian coded hospital data. Health Inf Manag 2019; 48 76–86.
| 29690788PubMed |
[4] Victorian State Government. Clinical coding workforce. 2020. Available at: https://www2.health.vic.gov.au/health-workforce/health-information-workforce/clinical-coding-workforce [verified 13 November 2020].
[5] Jackson T, Duckett S, Shepheard J, Baxter K. Measurement of adverse events using ‘incidence flagged’ diagnosis codes. J Health Serv Res Policy 2006; 11 21–6.
| Measurement of adverse events using ‘incidence flagged’ diagnosis codes.Crossref | GoogleScholarGoogle Scholar | 16425472PubMed |
[6] Independent Hospital Pricing Authority. Pricing and funding for safety and quality. Risk adjustment model for hospital acquired complications. Version 3. 2018. Available at: https://www.ihpa.gov.au/sites/default/files/publications/pricing_and_funding_for_safety_and_quality_-_risk_adjustment_model_for_hospital_acquired_complications_2018-19.pdf [verified 13 November 2020].
[7] Department of Health and Human Services. Policy and funding guidelines 2019–20. 2019. Available at: https://www.dhhs.vic.gov.au/sites/default/files/documents/201908/Policy%20and%20Funding%20Guidelines%202019-20.pdf [verified 19 November 2020].
[8] Australian Medical Association (AMA). Australian Medical Association Submission on the proposals set out in the Independent Hospital Pricing Authority – Pricing Framework for Australian public hospital services 2019–20. Independent Hospital Pricing Authority. 2018. Available at: https://www.ihpa.gov.au/sites/default/files/pricing_framework_for_australian_public_hospital_services_2019-20_-_consultation_-_submission_-_australian_medical_association.pdf?acsf_files_redirect [verified 3 December 2020].
[9] Victorian Government. Casemix funding. 2020. Available at: https://www2.health.vic.gov.au/hospitals-and-health-services/funding-performance-accountability/activity-based-funding/casemix-funding [verified 13 November 2020].
[10] Antioch KM, Walsh MK. The risk-adjusted vision beyond casemix (DRG) funding in Australia. International lessons in high complexity and capitation. Eur J Health Econ 2004; 5 95–109.
| The risk-adjusted vision beyond casemix (DRG) funding in Australia. International lessons in high complexity and capitation.Crossref | GoogleScholarGoogle Scholar | 15452744PubMed |
[11] Jackson T, Nghiem HS, Rowell D, Jorm C, Wakefield J. Marginal costs of hospital-acquired conditions: information for priority-setting for patient safety programmes and research. J Health Serv Res Policy 2011; 16 141–6.
| Marginal costs of hospital-acquired conditions: information for priority-setting for patient safety programmes and research.Crossref | GoogleScholarGoogle Scholar | 21719478PubMed |
[12] Australian Commission on Safety and Quality in Health Care. Analysis of hospital-acquired diagnoses and their effect on case complexity and resource use. 2013. Available at: https://www.safetyandquality.gov.au/publications-and-resources/resource-library/analysis-hospital-acquired-diagnoses-and-their-effect-case-complexity-and-resource-use [verified 13 November 2020].
[13] Duckett S, Jorm C, Moran G, Parsonage H. Safer care saves money: how to improve patient care and save public money at the same time. Melbourne: Grattan Institute; 2018.
[14] Australian Commission on Safety and Quality in Health Care. Hospital-acquired complications (HACs) list – specifications – version 3.0. 2019. Available at: https://www.safetyandquality.gov.au/publications-and-resources/resource-library/hospital-acquired-complications-hacs-list-specifications-version-30 [verified 13 November 2020].
[15] Department of Health and Human Services. VCDC – deriving cost buckets. 2018. Available at: https://www2.health.vic.gov.au/about/publications/policiesandguidelines/vcdc-deriving-cost-buckets [verified 19 November 2020].
[16] Santos Silva JMC, Silvana T. The log of gravity. Rev Econ Stat 2006; 88 641–58.
| The log of gravity.Crossref | GoogleScholarGoogle Scholar |
[17] Gregori D, Petrinco M, Bo S, Desideri A, Merletti F, Pagano E. Regression models for analyzing costs and their determinants in health care: an introductory review. Int J Qual Health Care 2011; 23 331–41.
| Regression models for analyzing costs and their determinants in health care: an introductory review.Crossref | GoogleScholarGoogle Scholar | 21504959PubMed |
[18] Duckett S, Jorm C, Danks L, Moran G. All complications should count: using our data to make hospitals safer. Melbourne: Grattan Institute; 2018.
[19] Milligan L. Health hazard. Four Corners. ABC, 9 September 2019. Available at: https://www.abc.net.au/4corners/health-hazard/11493580 [verified 19 November 2020].
[20] Davey M. Victoria to overhaul health system after hospital safety review over baby deaths. The Guardian, 14 October 2016. Available at: https://www.theguardian.com/australia-news/2016/oct/14/victoria-to-overhaul-health-system-after-hospital-safety-review-over-baby-deaths [verified 19 November 2020].
[21] Victorian Clinical Council. Value-based healthcare – an approach for Victoria. 2019. Available at: https://www.bettersafercare.vic.gov.au/sites/default/files/2019-12/Victorian%20Clinical%20Council%20advice%20-%20Value-based%20healthcare.pdf [verified 19 November 2020].
[22] Porter ME. What is value in health care? N Engl J Med 2010; 363 2477–81.
| What is value in health care?Crossref | GoogleScholarGoogle Scholar | 21142528PubMed |
[23] Trentino KM, Swain SG, Burrows SA, Sprivulis PC, Daly FFS. Measuring the incidence of hospital-acquired complications and their effect on length of stay using CHADx. Med J Aust 2013; 199 543–7.
| Measuring the incidence of hospital-acquired complications and their effect on length of stay using CHADx.Crossref | GoogleScholarGoogle Scholar | 24138380PubMed |
[24] Tew M, Dalziel KM, Petrie DJ, Clarke PM. Growth of linked hospital data use in Australia: a systematic review. Aust Health Rev 2017; 41 394–400.
| Growth of linked hospital data use in Australia: a systematic review.Crossref | GoogleScholarGoogle Scholar | 27444270PubMed |
[25] Ehsani JP, Jackson TJ, Duckett SJ. The incidence and cost of adverse events in Victorian hospitals 2003–04. Med J Aust 2006; 184 551–5.
| The incidence and cost of adverse events in Victorian hospitals 2003–04.Crossref | GoogleScholarGoogle Scholar | 16768660PubMed |
[26] Stevenson KB, Khan Y, Dickman J, Gillenwater T, Kulich P, Myers C, Taylor D, Santangelo J, Lundy J, Jarjoura D, Li X, Shook J, Mangino JE. Administrative coding data, compared with CDC/NHSN criteria, are poor indicators of health care–associated infections. Am J Infect Control. 2008; 36 155–64.
| Administrative coding data, compared with CDC/NHSN criteria, are poor indicators of health care–associated infections.Crossref | GoogleScholarGoogle Scholar | 18371510PubMed |
[27] Michel J, Nghiem HD, Jackson TJ. Using ICD-10-AM codes to characterise hospital-acquired complications. Health Inf Manag 2009; 38 18–25.
| 19875851PubMed |


