Planning for the future of the Australian midwifery workforce: the Midwifery Futures workforce model
Kirsten Small A B * , Martin Boyce C , Chanelle Warton A , Kathleen Baird D , Zoe Bradfield
  E , Jennifer Fenwick D and Caroline Homer A
A
B
C
D
E
Abstract
Quality maternity service provision relies on having a robust midwifery workforce. Although previous models suggested future growth of the workforce, this is at odds with recent reports of staffing shortfalls and difficulties in recruitment. We developed an updated model to provide long-term projections of supply and demand for the Australian midwifery workforce.
A dynamic stock and flow model was built from baseline data from 2022, with projections through to 2030. It was assumed that 79% of the midwifery workforce would provide clinical care, working 20 h per week to meet a workload of 40 pregnancies per full-time equivalent midwife per year.
If recruitment and attrition remain stable, both headcount and full-time equivalent numbers of midwives will increase by 2030, exceeding demand. The average annual workload per full-time equivalent midwife would fall to 34 pregnancies. However, if voluntary attrition rose by 10%, there would be a rapid and devastating decrease in numbers. The average workload for a full-time equivalent midwife would rise to 66 pregnancies per year by 2030.
The Midwifery Futures model demonstrated the sensitivity of the Australian midwifery workforce to a small change in attrition. Preventing midwives’ exit from the workforce by improving their experiences in the workplace and increasing access to midwifery continuity roles would build workforce resilience. Minimising attrition, enhancing midwives’ engagement, and matching student intake to attrition can assist in maintaining a robust Australian midwifery workforce.
Keywords: attrition, health workforce planning, immigration, maternity, midwifery, modelling, retention, workforce.
Introduction
Having the right number of midwives, in the right places, providing appropriate care is essential for quality maternity care.1 Forward planning for the recruitment, education, and retention of the midwifery workforce is crucial. Workforce modelling provides a mechanism to understand current workforce numbers and predict future possibilities. Modelling the midwifery workforce can inform policy changes to ensure enough midwives are available.
In 2012, Health Workforce Australia undertook modelling of the midwifery workforce.2 Built on data from 2009, their model suggested the midwifery workforce would be in over-supply through to 2025. However, the Health Workforce Australia team described their concerns about data quality and the methodology used for the modelling and recommended changes.
The same team developed an updated workforce model based on data from 2017 and predicted growth in the midwifery workforce sufficient to meet demand through to 2030.3 A more recent model4 predicted a fall in the number of registered midwives between 2018 and 2023, returning to previous numbers by 2028, and a continued increase in the size of the workforce to 2043. Both models preceded the COVID-19 pandemic and its effect on the Australian midwifery workforce. One-quarter of Victorian midwives surveyed in 2021 indicated feeling more likely to leave the profession due to the pandemic.5
Findings from these workforce models conflict with research on the experiences of Australian midwives. In 2021, 76% of Victorian midwifery managers reported inadequate midwifery staff levels, and 73% had difficulty recruiting midwifery staff.6 In a 2023 survey, only 2% of midwifery managers indicated that their service was currently fully staffed with midwives.7 Additionally, 83.9% indicated that recruiting midwifery staff was difficult, with only 14.1% being able to fill all advertised midwifery positions in the previous 12 months.
Considering the effect of the COVID-19 pandemic and research reporting workforce shortages, there was an urgent need to generate new modelling for the Australian midwifery workforce. We aimed to construct a model to provide long-term projections of demand for and the supply of midwifery workforce in Australia, with state and territory information provided as Supplementary material. This work was conducted as part of the Midwifery Futures project.8 Midwifery Futures reviewed the current state of Australia’s midwifery workforce, generating information to support policy and regulatory change relevant to enhance midwifery service provision.
Methods
The Midwifery Futures Workforce model was developed to estimate the future number of midwives in Australia, using baseline data from December 2022. A dynamic stock and flow approach9 was used to estimate numbers of midwives required to provide clinical care annually to 2030.
Identifying supply
The number of Australian midwives in December 2022 was sourced from the National Health Workforce Data Tool (Table 1).10 The proportion of midwives working in midwifery and providing clinical care was 79% in 2019,3 with the same proportion identified in the Midwifery Futures survey of 2023.11 The average hours worked per week per midwife was 20 h in 2019.3 The current full-time equivalent (FTE) number of midwives was calculated as midwife headcount × proportion working in a clinical role × (average hours worked per week/38 h per week) (Table 2).
| Variable | Definition | Source | |
|---|---|---|---|
| Live birth rate | Number of live births after 20 weeks of gestation (excludes stillbirth and miscarriage) | UN World Population Prospects 2022 12 | |
| Current midwife headcount | Registered midwives, including dual registered nurse-midwives (enrolled nurse and midwife, registered nurse and midwife, registered and/enrolled nurse and midwife) | National Health Workforce Database 10 | |
| Percentage working in a clinical role | The proportion of midwives who are working in midwifery in a clinical role | Australian Government Fact Sheet for Midwives, 2019 16 | |
| Average hours per week worked | The average number of hours worked per week per midwife in a 38 h working week | Australian Government Fact Sheet for Midwives, 2019 16 | |
| Age specific mortality rate | Number of deaths at a specific age, per 1000 population | Australian Bureau of Statistics 17 | |
| Entry of new graduates | All graduates from a midwifery program accredited for entry to midwifery registration by the Australian Nursing and Midwifery Accreditation Council | Nursing and Midwifery Board of Australia, A 2015–2023 | |
| The default number per year was the average for the preceding 5 years |
| Measure | Calculation | |
|---|---|---|
| Current midwife FTE | Midwife headcount × % in clinical role × (average hours worked per week/standard hours per week) | |
| Pregnancy multiplier = 1.65 | (Live births + stillbirths + induced abortions + miscarriages)/live births; as an average of the past 5 years, assumed to be constant for all states and territories and at all time points | |
| Pregnancies | Live births × pregnancy multiplier | |
| Workload per FTE midwife | Number of pregnancies/number of FTE midwives | |
| Outflows | Deaths + retirements + voluntary attrition | |
| Deaths | Sum (headcount × age specific mortality rate/1000) for each age group | |
| Retirement | All midwives over statutory retirement age of 67; assumed to be 80% of those aged 65–74, and all those aged 75+ | |
| Inflows | Entry of new graduates + immigration | |
| Expected future midwife headcount | Midwife headcount (year − 1) − outflows + inflows | |
| Net average change | (Midwife headcount (year) − Midwife headcount (year − 1) − sum (graduates − (deaths + retirement)))/number of midwives (year − 1) |
Identifying demand
National live birth rate numbers were sourced from the United Nations World Population Prospects 2022 data set12 (Table 1). A pregnancy multiplier rate was estimated by adding the proportion of stillbirths,13 abortions,14 and miscarriages15 to live births. Doing so recognised that midwives also provide care for people experiencing stillbirth, abortion, and miscarriage. For the past 5 years, 2019–2023, the number of pregnancies has averaged 1.65 times the number of live births, and we assumed this would remain constant over time (Table 2).
Demand for midwifery services (workload) was taken as the number of pregnancies in Australia each calendar year per FTE midwife (Table 2). The average workload per FTE midwife in Australia between 2018 and 2022 was calculated as 40 pregnancies per year. This workload reflects the existing levels of casemix complexity in the Australian maternity care system, and it was assumed that this casemix and, therefore, workload would remain constant across all future years in the model.
Modelling future midwife numbers
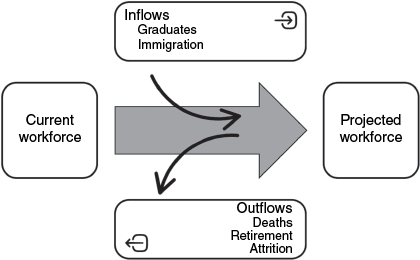
Each subsequent year’s projection of the number of midwives providing clinical care was calculated by adding inflows to the previous year’s number and removing outflows (Fig. 1). Inflows were the number of new Australian graduates and midwives immigrating to Australia. Graduate numbers were supplied by the Nursing and Midwifery Board of Australia. The default number of graduates per year used in the model was the annual average in years 2019–2023.
Outflows were the number of deaths, retirements, and voluntary attrition. Deaths were calculated as the headcount in each age category multiplied by the age-specific mortality rate per 1000 people for that age category (Table 2). All midwives over the statutory retirement age of 67 were assumed to have retired. As the data were reported in age category blocks of 10 years, it was assumed that 80% of those aged 65–74 years would retire.
Reliable data on immigration and voluntary attrition could not be located. Instead, the net average change in the midwife headcount was calculated to estimate the net effect of both immigration and voluntary attrition after accounting for the other known changes (Table 2). Using data from the preceding 5 years (2017–2022) showed the net average change was +1.9%, indicating that immigration exceeded voluntary attrition over the past 5 years. The model used this default rate of net change.
Scenario testing
Base model assumptions are provided in Table 3. Adjusting key variables in the model allowed permitted examination of the expected results under different scenarios.
| Variable | Default | |
|---|---|---|
| Percent in a non-clinical role | 79% | |
| Workload (pregnancies per FTE midwife) | 40 | |
| Average hours worked per 38 h work week | 20 | |
| Net change (immigration–voluntary attrition) | 1.9% | |
| Annual entry of new graduates | 1305 |
A survey of midwives on the Nursing and Midwifery Board of Australia register was carried out specifically for Midwifery Futures11 and asked midwives about their future intentions. Of the 2428 respondents, 887 (37%) said that they were currently considering leaving midwifery altogether. However, not every midwife who considers leaving the profession will do so. Actual attrition rates are lower, even when accounting for retirement and death. Previously, age-disaggregated 5-year attrition rates for Australian midwives between 2013 and 2018 were estimated to be 7%.4 The average attrition rate for midwives in the State of the World’s Midwifery 2014 data set was 8.2%.18
Based on this limited evidence, the effect of a 10% attrition rate on workload was modelled. Graduate numbers and weekly working hours were independently adjusted to determine the changes required to maintain the current number of FTE midwives at this attrition rate.
Results
Forecast midwife numbers in Australia 2023–2030
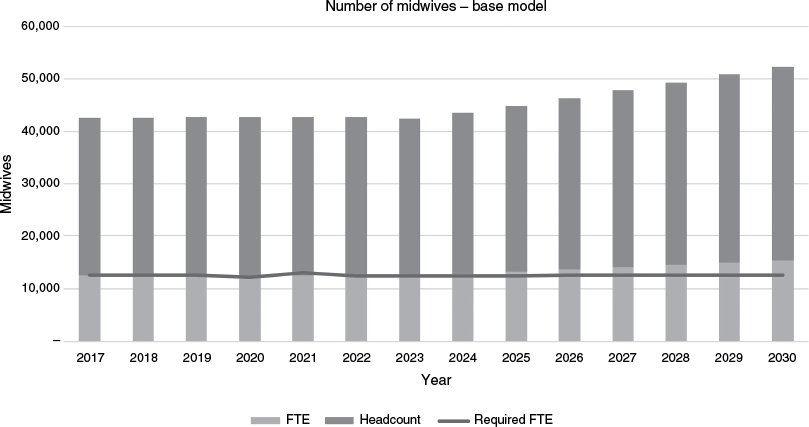
Using the default assumptions for each of the key variables (Table 3), the estimated number of midwives for the years 2024–2030 is shown in Fig. 2, both by headcount and FTE. Required FTE indicates the number of FTE midwives required to achieve a workload of 40 pregnancies per FTE midwife per year, assuming the birth rate remains the same as in 2022. The numbers for the years 2017–2023 represent the actual headcount and FTE for each year.
In this model, the number of midwives is projected to increase. This model assumes graduate numbers will continue at their current annual rate of 1305, and inflows will continue to exceed outflows, with a net change (immigration–attrition) of 1.9% annually. The increase means that by 2030 the average workload per FTE midwife per year could fall from 40 to 34 pregnancies. Alternately, fewer graduates and immigrants would need to be recruited.
Modelling scenarios
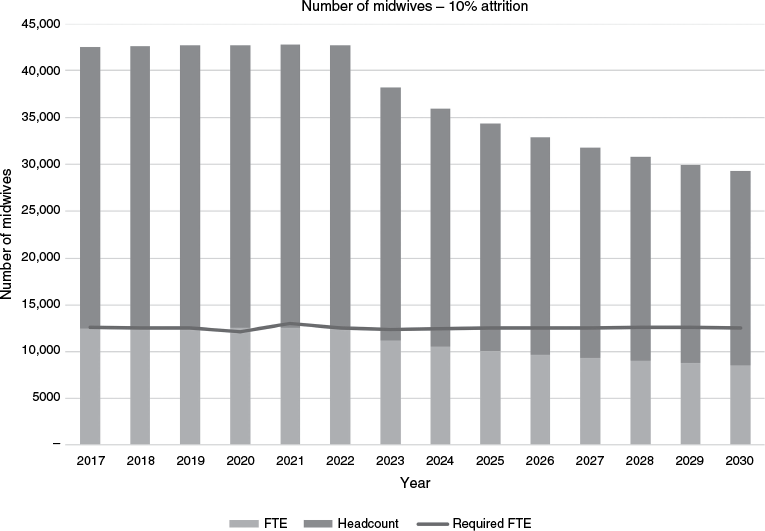
The lack of reliable data regarding attrition did not allow projection based on historic data. Instead, we modelled the impact of a 10% attrition rate.
The impact of a 10% attrition rate would be rapid and devastating (Fig. 3). By 2030, a deficit of 3943 FTE midwives would occur, with a reduction in headcount below 2022 numbers of 9496 midwives. Assuming pregnancy rates remain the same, the average workload for midwives would rise each year. By 2030, a 50% increase in workload to 66 pregnancies per FTE midwife would be required.
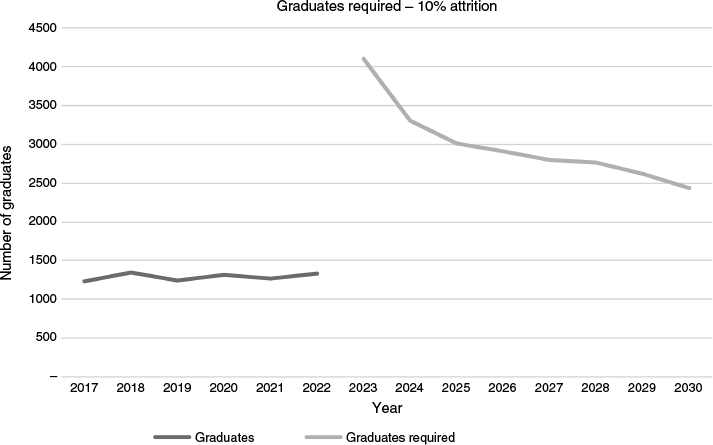
To fill the gap without additional immigration, it would be necessary to produce more graduates (Fig. 4). This presents a significant challenge, as 4100 new graduates would have been required in 2023 – a threefold increase on the current number of new midwifery graduates. The number of graduates required is especially high in the first year, as the model assumes all midwives aged over 67 years will leave the workforce, which history tells us is unlikely. Once these retirees have been replaced, required graduate numbers fall then level out at twice the current number.
Number of Australian midwifery graduates required to replace a 10% attrition rate, 2023–2030.
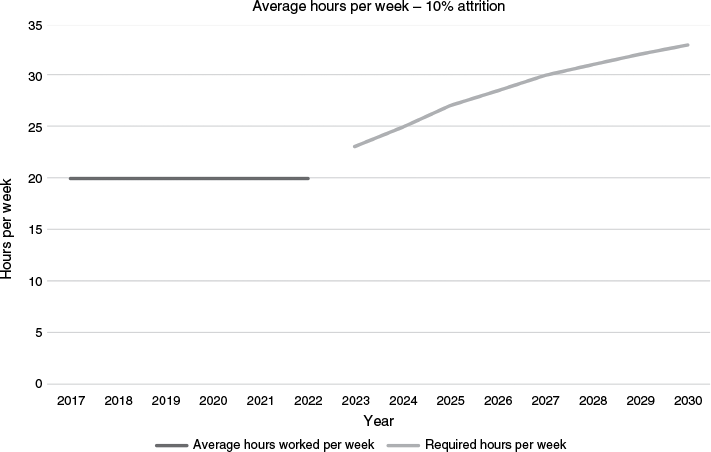
Alternatively, it would be possible to fill the gap if remaining midwives worked more hours per week in midwifery. By 2030, the average midwifery hours worked per week per midwife in this scenario would need to rise to 33 h (Fig. 5).
Discussion
We developed a dynamic stock and flow model for the Australian midwifery workforce, projecting forward to 2030 based on data from 2022. Assuming a stable pregnancy rate, the model predicted an oversupply in workforce, with an additional 22% of FTE midwives above demand in 2030. This forecast aligns with the projections made in 2019 by Health Workforce Australia3 and would suggest minimal changes to midwifery workforce recruitment and retention are required.
However, modelled attrition rates demonstrate significant potential risks to future workforce adequacy.
Early career midwives more often report an intention to leave midwifery than their experienced counterparts,19 and their loss from the profession has a large effect on future workforce requirements. Early career midwives who had left clinical practice in Australia describe untenable workplace cultures, workload, and expectations as strong drivers for their decision to leave.20,21 Factors that encourage retention include supportive relationships with managers and other staff, strong relationships with women in their care, flexible working hours including access to part-time work, adequate remuneration, and being able to practice autonomously.22,23 Midwives working in continuity of carer models are less likely to consider leaving.19 Preventing attrition, particularly for early career midwives, is a powerful means of supporting a sustainable midwifery workforce.
Small increases in the average hours worked per midwife would produce a sizeable impact. In the face of a 10% attrition rate, increasing the average hours worked by only 4 h per week would reduce the shortfall in 2030 by 30%. Improved support for midwives working part-time due to primary carer responsibilities may facilitate increases in the number of hours worked per week. One-quarter of midwives also work as nurses, with clinical nursing work being the primary role for 20% of midwives.11 Caution should be applied when redirecting nurse-midwives into more hours in midwifery, as this may leave commensurate gaps in the nursing workforce.
Increasing the throughput of midwifery education programs offers a measured pathway to addressing future workforce shortfalls and requires longer range planning. Bachelor of Midwifery programs take 3 years to complete on a full-time basis, and a quarter of midwifery students undertake their program part-time.24 The shortest education programs leading to midwifery registration (such as a Graduate Diploma in Midwifery) can be completed full-time in 18 months but require prior nursing qualifications. Encouraging more nurses to move into midwifery may have detrimental effects on the nursing workforce that should also be considered.
Strengths and limitations
A strength of this model was the assumption that all women would receive pregnancy care in a continuity of carer model. Continuity of midwifery care is recognised as the optimal maternity care model, with better perinatal and maternal outcomes25 and reduced healthcare costs.26 Using this approach illustrated the size of the midwifery workforce required and how it is possible to meet, indeed, to exceed, current demand.
We encountered a lack of data for voluntary attrition and for immigration. The difference between outflows and inflows must be small, as the total number of midwives registered each year has not changed significantly between 2017 and 2022 (Fig. 2). Reliable data for the number of new graduates joining the profession from Australian training institutions each year were available, and we could estimate the expected number of retirements and the very small number of deaths in service. Consequently, the static totals for these years may disguise a level of underlying ‘churn’, with midwives leaving the profession being replaced by a similar number of new registrations from overseas. The true scale of this churn remains unknown.
Our model assumed that the workforce was adequately meeting demand in 2022 and the years prior. If this was not the case, then the predicted FTE requirements may under- or over-represent the number of midwives. Our model is unable to account for changing workforce requirements relating to changes in the skill mix of midwives, casemix complexity, and factors that affect clinical productivity. Changes in the proportions of women receiving care in different models of care might alter demand for midwifery services, and we were unable to account for this in the model. Like the Health Workforce Australia model, we focused on modelling the clinical workforce. We acknowledge that for the midwifery profession to remain robust, it is vital that midwives also have roles in all the places where decisions about the profession is made, in education, policy, and research. While we have performed modelling for each state and territory (provided in the Supplementary material Fig S1), regional and rural areas are typically most affected by workforce shortages. Our model does not include this analysis as we did not have access to detailed information about the place of practice for midwives.
Recommendations
We recommend a robust modelling tool be developed, including measures of both the clinical and non-clinical midwifery workforce, with reports on workforce predictions according to state and territory and according to levels of rurality. Policy decisions should be informed by best practice modelling and include considerations of the effect of suggested changes on the nursing workforce.
Universities, health services, and policy makers working together to increase the number of midwifery students can provide a future safety net against attrition rates. Efforts to retain midwives and promote a small increase in working hours would benefit from increased positions in midwifery continuity of carer roles, and a focus on the provision of workplace flexibility, adequate working conditions, and appropriate remuneration.
Conclusion
A robust midwifery workforce is crucial for the health of Australia’s maternity care system. Our workforce model predicts there will be enough midwives through to 2030, assuming stable rates of attrition and immigration. Increased attrition levels could seriously disrupt workforce stability. Minimising attrition, enhancing midwives’ engagement with clinical work, and aligning student intake with anticipated attrition are important steps in maintaining a healthy midwifery workforce.
Data availability
The sources of the raw data used in the modelling are described in the Methods. Most are publicly available. Some was provided by the Nursing and Midwifery Board of Australia, and we do not have data sharing rights for these. Data sharing is not applicable as no new data were generated or analysed during this study. Our data sources are listed in Table 1.
Declaration of funding
The Midwifery Futures project was supported by funding from the Nursing and Midwifery Board of Australia.
Acknowledgements
The Midwifery Futures project team acknowledges the contribution of Andrea Nove from Novametrics Ltd. who contributed to early drafts of the model.
Author contributions
KS: Conceptualisation; Writing – original draft. MB: Conceptualisation; Methodology; Data Curation; Formal analysis; Writing – original draft. CW: Conceptualisation; Writing – review and editing. KB: Writing – review and editing. ZB: Writing – review and editing. J. F.: Writing – review and editing. CH: Conceptualisation; Supervision; Funding acquisition; Project Administration; Writing – review and editing.
References
1 Lopes MA, Almeida ÁS, Almada-Lobo B. Handling healthcare workforce planning with care: where do we stand? Hum Resour Health 2015; 13: 38.
| Crossref | Google Scholar | PubMed |
2 Health Workforce Australia. Health Workforce 2025 - Doctors, Nurses and Midwives. 2012. Available at https://apo.org.au/sites/default/files/resource-files/2012-01/apo-nid154456.pdf
3 Health Workforce Australia. Australia’s Future Health Workforce Report - Midwives. 2019. Available at https://www.health.gov.au/sites/default/files/documents/2021/03/midwives-australia-s-future-health-workforce-report.pdf
4 Callander E, Sidebotham M, Lindsay D, Gamble J. The future of the Australian midwifery workforce – impacts of ageing and workforce exit on the number of registered midwives. Women Birth 2021; 34(1): 56-60.
| Crossref | Google Scholar | PubMed |
5 Matthews R, Forster D, Hyde R, McLachlan H, Newton M, Mumford S, et al. FUSCHIA: Future proofing the midwifery workforce in Victoria. A state-wide cross-sectional study exploring health, well-being and sustainability. 2022. 10.26181/21729068.v1
6 Matthews RP, Hyde RL, McLachlan HL, Llewelyn F, Forster DA. Midwifery workforce challenges in Victoria, Australia. A cross-sectional study of maternity managers. Women Birth 2023; 37: 144-52.
| Crossref | Google Scholar | PubMed |
9 Lee JT, Crettenden I, Tran M, Miller D, Cormack M, Cahill M, et al. Methods for health workforce projection model: systematic review and recommended good practice reporting guideline. Hum Resour Health 2024; 22(1): 25.
| Crossref | Google Scholar | PubMed |
10 Department of Health and Aged Care. Health Workforce Data Tool. 2025. Available at https://hwd.health.gov.au/datatool/ [cited 12 December 2023].
11 Homer C, Small K, Warton C, Bradfield Z, Fenwick J, Gray J, Robinson M. Midwifery Futures: Building the future Australian midwifery workforce. 2024. Available at https://www.nursingmidwiferyboard.gov.au/News/Midwifery-Futures.aspx
12 United Nations. World Population Prospects: 2022. 2022. Available at https://population.un.org/wpp/ [cited 17 January 2024].
14 Bearak J, Popinchalk A, Ganatra B, Moller AB, Tunçalp Ö, Beavin C, et al. Unintended pregnancy and abortion by income, region, and the legal status of abortion: estimates from a comprehensive model for 1990-2019. Lancet Glob Health 2020; 8(9): e1152-61.
| Crossref | Google Scholar | PubMed |
15 Miscarriage Australia. What is miscarriage? 2024. Available at https://miscarriageaustralia.com.au/understanding-miscarriage/what-is-miscarriage/#:~:text=The%20actual%20miscarriage%20rate%20is,occur%20every%20day%20in%20Australia
16 Department of Health & Aged Care. Factsheet: 2019 Midwives. 2020. Available at https://hwd.health.gov.au/resources/publications/factsheet-nrmw-2019.html [cited 20 January 2024]
17 Australian Bureau of Statistics. Causes of death, Australia 2022. 2023. Available at https://www.abs.gov.au/statistics/health/causes-death/causes-death-australia/latest-release [cited 23 January 2024]
18 Castro Lopes S, Guerra-Arias M, Buchan J, Pozo-Martin F, Nove A. A rapid review of the rate of attrition from the health workforce. Hum Resour Health 2017; 15(1): 21.
| Crossref | Google Scholar | PubMed |
19 Harvie K, Sidebotham M, Fenwick J. Australian midwives’ intentions to leave the profession and the reasons why. Women Birth 2019; 32(6): e584-93.
| Crossref | Google Scholar | PubMed |
20 Donnelly E, Lee J, Donnellan-Fernandez R. Understanding attrition of early career midwives in Australia. Women Birth 2024; 37(4): 101636.
| Crossref | Google Scholar | PubMed |
21 Parry N, Catling C, Cummins A. Early career midwives’ job satisfaction, career goals and intention to leave midwifery: A scoping review. Women Birth 2023; 37: 98-105.
| Crossref | Google Scholar | PubMed |
22 Bloxsome D, Ireson D, Doleman G, Bayes S. Factors associated with midwives’ job satisfaction and intention to stay in the profession: An integrative review. J Clin Nurs 2019; 28(3–4): 386-99.
| Crossref | Google Scholar | PubMed |
23 Feeley C, Stacey T. Novel solutions to the midwifery retention crisis in England: an organisational case study of midwives’ intentions to leave the profession and the role of retention midwives. Midwifery 2024; 138: 104152.
| Crossref | Google Scholar | PubMed |
24 Warton C, Small K, Bradfield Z, Baird K, Fenwick J, Robinson M, et al. The future midwifery workforce: A survey of the education experiences of midwifery students in Australia. Nurse Educ Pract 2025; 84: 104321.
| Crossref | Google Scholar |
25 Sandall J, Soltani H, Gates S, Shennan A, Devane D, et al. Midwife-led continuity models versus other models of care for childbearing women. Cochrane Database Syst Rev 2016; 4(4): CD004667.
| Crossref | Google Scholar | PubMed |
26 Callander E, Jackson H, McLachlan HL, Davey MA, Forster D. Continuity of care by a primary midwife (caseload midwifery): a cost analysis using results from the COSMOS randomised controlled trial. Gynecol Obstet Clin Med 2024; 4: e000008.
| Google Scholar |


