Genetic parameters of blood urea nitrogen and milk urea nitrogen concentration in dairy cattle managed in pasture-based production systems of New Zealand and Australia
Irene van den Berg A D , Phuong N. Ho A , Mekonnen Haile-Mariam A , Phil R. Beatson B , Erin O’Connor B and Jennie E. Pryce
  A C
A C
A Agriculture Victoria, AgriBio, Centre for AgriBioscience, 5 Ring Road, Bundoora, Vic. 3083, Australia.
B CRV Ambreed, PO Box 176, Hamilton, New Zealand.
C School of Applied Systems Biology, La Trobe University, 5 Ring Road, Bundoora, Vic. 3083, Australia.
D Corresponding author. Email: irene.vandenberg@agriculture.vic.gov.au
Animal Production Science - https://doi.org/10.1071/AN21049
Submitted: 4 February 2021 Accepted: 29 April 2021 Published online: 13 July 2021
Journal compilation © CSIRO 2021 Open Access CC BY-NC-ND
Abstract
Context: Urinary nitrogen excretion by grazing cattle causes environmental pollution. Selecting for cows with a lower concentration of urinary nitrogen excretion may reduce the environmental impact. While urinary nitrogen excretion is difficult to measure, blood urea nitrogen (BUN), mid-infrared spectroscopy (MIR)-predicted BUN (MBUN), which is predicted from MIR spectra measured on milk samples, and milk urea nitrogen (MUN) are potential indicator traits. Australia and New Zealand have increasing datasets of cows with urea records, with 18 120 and 15 754 cows with urea records in Australia and New Zealand respectively. A collaboration between Australia and New Zealand could further increase the size of the dataset by sharing data.
Aims: Our aims were to estimate genetic parameters for urea traits within country, and genetic correlations between countries to gauge the benefit of having a joint reference population for genomic prediction of an indicator trait that is potentially suitable for selection to reduce urinary nitrogen excretion for both countries.
Methods: Genetic parameters were estimated within country (Australia and New Zealand) in Holstein, Jersey and a multibreed population, for BUN, MBUN and MUN in Australia and MUN in New Zealand, using high-density genotypes. Genetic correlations were also estimated between the urea traits recorded in Australia and MUN in New Zealand. Analyses used the first record available for each cow or within days-in-milk (DIM) intervals.
Key results: Heritabilities ranged from 0.08 to 0.32 for the various urea traits. Higher heritabilities were obtained for Jersey than for Holstein, and for the New Zealand cows than for the Australian cows. While urea traits were highly correlated within Australia (0.71–0.94), genetic correlations between Australia and New Zealand were small to moderate (0.08–0.58).
Conclusions: Our results showed that the heritability for urea traits differs among trait, breed, and country. While urea traits are highly correlated within country, genetic correlations between urea traits in Australia and MUN in New Zealand were only low to moderate.
Implications: Further study is required to identify the underlying causes of the difference in heritabilities observed, to compare the accuracies of different reference populations, and to estimate genetic correlations between urea traits and other traits such as fertility and feed intake. Larger datasets may help estimate genetic correlations more accurately between countries.
Keywords: nitrogen, environmental stress, animal breeding, quantitative genetics, urea.
Introduction
Urinary nitrogen excretion by grazing cattle causes nitrogen to leach into the groundwater, resulting in environmental pollution, such as deteriorating water quality (O’Callaghan et al. 2019). One strategy to reduce the impact of cattle on the environment could be to select for cows with a lower urinary nitrogen excretion. While urinary nitrogen excretion is a difficult trait to measure and therefore not likely to be available on a large enough number of cows to implement genomic prediction, milk urea nitrogen (MUN) and blood urea nitrogen (BUN) have been considered as good indicators of nitrogen utilisation and may be good alternatives. BUN and MUN are highly related, because of the free diffusion of urea from blood to milk (Gustafsson and Palmquist 1993). Several studies have shown a linear phenotypic relationship between BUN and MUN and urine nitrogen excretion (Kauffman and St-Pierre 2001; Kohn et al. 2002, 2005), and that increased feed intake results in increased urea (measured as BUN, MUN or urinary nitrogen excretion).
Both MUN (Beatson et al. 2019; Bobbo et al. 2020) and BUN (Luke et al. 2019a; van den Berg et al. 2021) have low to moderate heritabilities, ranging from 0.10 to 0.22, indicating potential for use as criteria for genetic selection. Because MUN is measured from a milk sample, it could potentially be available on all cows with milk records. BUN requires a more difficult and costly blood sample, which limits the number of records. However, BUN can be accurately predicted using mid-infrared spectroscopy of a milk sample (Ho et al. 2021). Our previous study showed that mid-infrared spectroscopy-predicted BUN (MBUN) and BUN are highly correlated, with a genetic correlation close to 1 (van den Berg et al. 2021), and may therefore be considered as the same trait. Similar to MUN, MBUN could be available on all cows with milk records.
Further increases in the size of the reference population with urea records may be achieved by combining datasets of multiple countries and breeds. Australia (AU) and New Zealand (NZ) have increasing datasets of cows with urea records, collected on Holstein, Jersey, and a substantial number of crossbred cows. Combining all those records in one large reference population will maximise the size of the reference population and may lead to increases in prediction accuracy. Haile-Mariam et al. (2020) showed that including multi-breed AU cows to the multi-breed NZ reference population increased prediction accuracy for production traits of NZ validation bulls. However, previous studies have shown that multi breed genomic prediction can be challenging, because linkage disequilibrium is conserved over shorter distances across breeds than within breeds (Lund et al. 2016). Consequently, combining data from multiple breeds in a joint reference population may be beneficial only if populations are closely related. Furthermore, the benefit of sharing data across countries, even when the populations are highly related, may be limited if traits are measured differently. In this context, an estimation of genetic correlations of the same trait in different populations is essential to assess the potential benefits of sharing reference populations.
The objective of our study was to estimate genetic parameters of BUN, MBUN and MUN in AU and of MUN in NZ, and to estimate genetic correlations between MUN in NZ and BUN, MBUN and MUN in AU to gauge the benefit of having a joint reference population for genomic prediction of an indicator trait that is suitable for selection to reduce urinary nitrogen excretion for both countries.
Materials and methods
Phenotypes
Data used for our analyses contained dairy cows from AU and NZ. The major breeds in the dataset were Holstein and Jersey, although a large number of crossbred cows were also included. In total, our dataset consisted of 18 120 AU cows (12 660 Holstein, 1857 Jersey and 3603 other breeds and crossbred) and 24 437 NZ cows (3044 Holstein, 1946 Jersey and 19 426 other breeds and crossbred), with the exact number used in each analysis varying per trait as reported in Table 1. The traits analysed were concentration of BUN, MBUN, concentrations of MUN, milk yield (MY), fat yield (FY), protein yield (PY), fat percentage (F%) and protein percentage. Trait units were mmol/L for BUN and MBUN, mg/dL for MUN and kg for MY, FY and PY. Average values and standard errors within country and breed are displayed in Table 2.
The AU data collection is described in more detail by van den Berg et al. (2021), although since that study, a larger number of records has become available and were used in the current study. Blood and milk samples were used to obtain BUN, MBUN and MUN. All procedures were conducted in accordance with the Australian Code of Practice for the Care and Use of Animals for Scientific Purposes. Approval to proceed was granted by the Agricultural Research and Extension Animal Ethics Committee of the Department of Jobs, Precincts and Regions Animal Ethics Committee (Attwood, Victoria, Australia), and the Tasmanian Department of Primary Industries, Parks, Water and Environment (Animal Biosecurity and Welfare Branch, New Town, Tasmania, Australia). Prediction equations developed by Luke et al. (2019b) and Ho et al. (2021) were used to estimate MBUN, while MUN was derived using the commercial prediction equation from Bentley Instruments. Phenotypes for production traits were provided by DataGene (Bundoora, Victoria, Australia).
A general description of NZ phenotype data has been provided by Beatson et al. (2019). NZ records for MUN were obtained from milk samples that were collected during routine herd testing by CRV Ambreed. MUN was derived using a FOSS MilkOscan FT + analyser (FOSS, Hilleroed, Denmark).
The majority of cows in the dataset had multiple records. However, we restricted our analyses to the first parity recorded for each cow to reduce the computational demand. If a cow had multiple records within a parity, we either used the earliest record, or selected one record within a days-in-milk (DIM) interval. DIM intervals used were less than 50 DIM, between 50 and 100 DIM, 100–150 DIM and more than 150 DIM. Table 3 shows the number of records available within each DIM interval.

|
Genotypes
The majority of AU cows were genotyped on a variety of low- to medium-density custom single-nucleotide polymorphism (SNP) chips (with an overlap of ~7000 or more SNPs with the Illumina Bovine 50K chip (50 K)), and 154 and 37 AU cows were genotyped with the 50 K and Illumina Bovine HD beadChip (HD) panel respectively. NZ cows were genotyped on various low-density (~8500–25 000 SNP) chips. All animals genotyped at a lower density were imputed to the HD panel by using Fimpute v3 (Sargolzaei et al. 2014). Imputation was performed in two steps. First, animals genotyped with low density and custom chips were imputed up to the 50 K chip. Subsequently, animals were imputed from 50 K to HD. More details on the genotyping and imputation can be found in van den Berg et al. (2021).
Principal-component analyses and ADMIXTURE
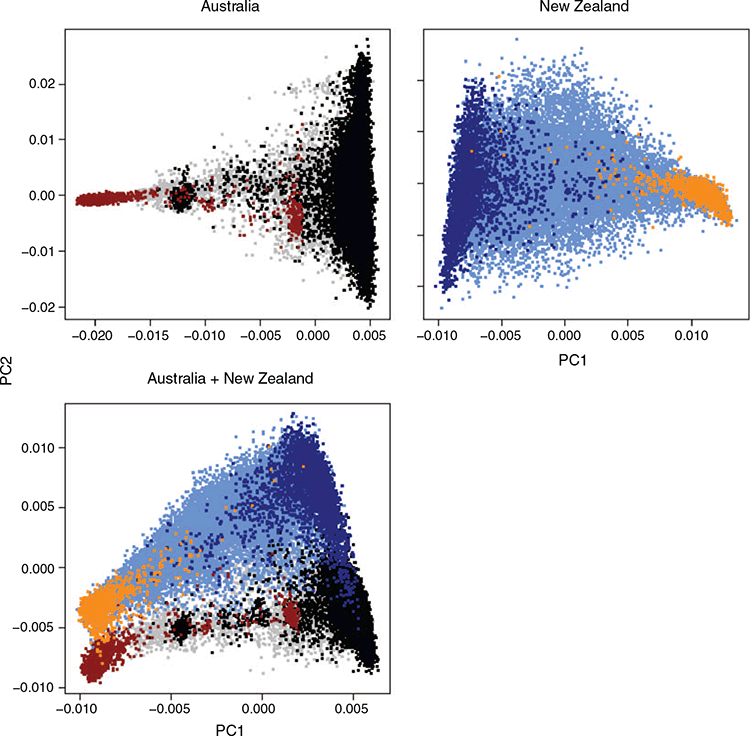
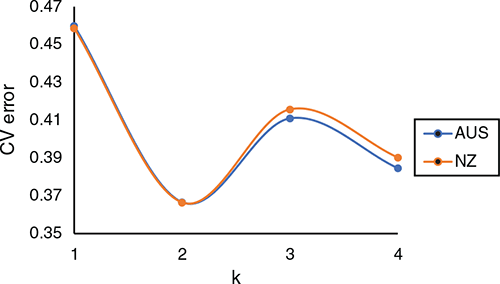
For the multibreed analyses, three principal-component analyses were performed using the AU dataset, the NZ dataset and the joint AU–NZ dataset. We used GCTA (Yang et al. 2011) to perform the principal-component analyses, and used the first principal component (PC1) as covariate in the multibreed analyses to account for the proportion of Holstein and Jersey. To compare how well PC1 accounted for the population structure, we used ADMIXTURE (Alexander et al. 2009) to estimate ancestry and test the number of discrete populations (between 1 and 4) that resulted in the lowest cross-validation error. Subsequently, we compared the ancestry results estimated with ADMIXTURE with PC1.
Genetic parameters
Genetic parameters were estimated using AIREMLF90 (Misztal et al. 2014b) for different subsets of the dataset in the following analyses:
-
WCWB = within country, within breed: AU Holstein, AU Jersey, NZ Holstein and NZ Jerseys
-
WCMB = within country, multi breed: all AU cows and all NZ cows
-
ACMB = across country, multi breed: all cows in the dataset
In the WCWB analyses, heritabilities of and genetic correlations among all traits were estimated within breed, using the first record available for each cow. WCMB analyses estimated heritabilities of and genetic correlations among traits using the first record for each cow, as well as heritabilities within DIM intervals, and genetic correlations in the same trait measured during different DIM intervals. ACMB analyses were undertaken to estimate genetic correlations between urea traits in AU and MUN in NZ, using either the first record available or within DIM intervals.
Heritabilities and genetic correlations were estimated using univariate and bivariate animal models respectively. All models included a genomic relationship matrix constructed following VanRaden Method 1 (VanRaden 2008) and fixed effects of herd, test year, test month and linear covariates of DIM, age and, in the multibreed analyses, PC1. Because of the large number of records in the ACMB analyses using the first record of each cow, the algorithm for proven and young was used to reduce the computational demand (Misztal et al. 2014a), as implemented in the AIREMLF90 software. First, we computed the number of individuals explaining 95% of the variance of the genomic relationship matrix. Subsequently, this number of individuals were randomly selected as core animals.
Results
Differences among breeds and countries
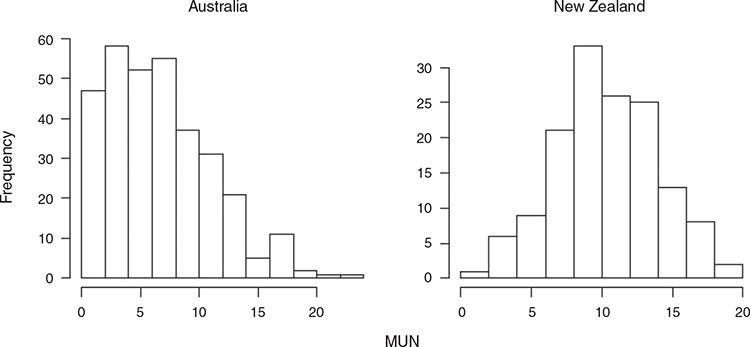
Milk urea nitrogen was higher in NZ than in AU (Table 2), with an average of 6.5, 7.9, 10.8 and 10.8 mg/dL in AU Holstein, AU Jersey, NZ Holstein and NZ Jersey respectively. While Holstein and Jersey had the same average MUN in NZ, the average MUN was slightly higher in AU Jersey than in AU Holstein. This was similar for MBUN, while the average BUN was larger in AU Holstein than in AU Jersey. While the average in AU is lower than in NZ, some herd–test date averages in AU are similar to those in NZ (Fig. 1).
|
PC1 separates Holstein and Jerseys, with crossbreds and other breeds in between (Fig. 2). ADMIXTURE analyses resulted in the lowest cross-validation error for two populations (Fig. 3). Using two populations, the correlation of the ancestry fractions estimated by ADMIXTURE had a correlation of 0.9997 and –0.9997 with PC1 in AU and NZ respectively.
|
Heritabilities
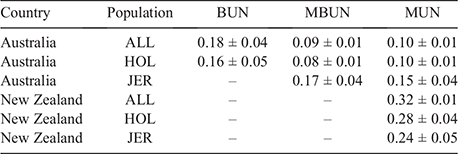
Table 4 shows heritabilities estimated for BUN, MBUN and MUN, using the first record per cow. Heritabilities varied from 0.08 for MBUN in AU_HOL, to 0.32 for MUN in NZ_ALL. MUN was the only trait available in all six populations, with heritability estimates varying between 0.10 for AU_ALL and AU_HOL to 0.32 in NZ_ALL. Both the multibreed and within-breed heritabilities of MUN were larger in NZ than in AU. A similar trend was observed for the production traits (Table A1). BUN was mostly measured on AU Holstein cows, with only a few AU non-Holstein cows having BUN records. Heritability estimates for BUN were 0.18 and 0.16 for AU_ALL and AU_HOL respectively, with large standard errors (0.04 and 0.05). MBUN was available only on the AU cows, with estimated heritabilities of 0.09 and 0.08 for AU_ALL and AU_HOL respectively and a larger heritability for AU_JER, with an estimate of 0.17. However, given the large standard error of 0.04, this difference was not significant. Similarly, the heritability of MUN was larger but not significantly different for AU_JER (0.15 ± 0.04) than for AU_HOL (0.10 ± 0.01) and AU_ALL (0.10 ± 0.01).
|
Table 5 shows the heritability of MBUN and MUN for different DIM intervals. For both traits, there was no consistent increase or decrease in heritability over the course of lactation. The heritability of MBUN varied from 0.07 for <50 DIM to 0.12 for >150 DIM. The heritability of MUN was higher in the NZ population than in the AU population during all DIM intervals, varying from 0.28 for <50 DIM to 0.32 for 100–150 DIM in NZ, and from 0.08 for >150 DIM to 0.12 for 100–150 DIM in AU.

|
Genetic correlations among traits
The three urea traits available on the AU cows (BUN, MBUN and MUN) were highly correlated with each other (Table 6). Genetic correlations between BUN and MBUN were the strongest, with correlations of 0.94 and 0.90 for AU_HOL and AU_ALL respectively. Correlations between BUN and MUN and MBUN and MUN were lower than were correlations between BUN and MBUN, ranging from 0.71 for the correlation between BUN and MUN in AU_ALL to 0.94 for the correlation between MBUN and MUN in AU_JER.

|
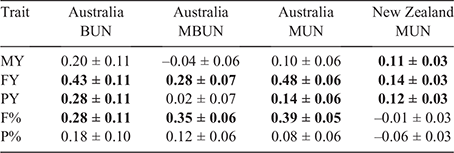
Genetic correlations between production traits and urea traits were small to moderate (Table 7). The strongest correlations were found with FY, with correlations varying from 0.14 with MUN in NZ_ALL to 0.48 with MUN in AU_ALL. Generally, genetic correlations between urea and production traits were stronger in the AU dataset than in the NZ data. For example, the correlation between MUN and F% was 0.39 ± 0.05 in AU_ALL and not significant in NZ_ALL. In the AU data, correlations of the different urea traits with MY traits showed variation, but in an inconsistent manner and with large standard errors.
|
Genetic correlations among different DIM intervals
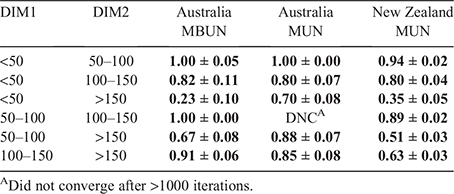
Genetic correlations among urea traits (Table 8) measured in different DIM intervals were strong for adjacent intervals, and weaker when the difference in DIM was larger. For example, between <50 and 50–100 DIM, genetic correlations varied between 0.94 and 1.00, while between <50 and >150 DIM, genetic correlations were much smaller (0.23–0.70). Genetic correlations were stronger in AU than in NZ for most DIM intervals. For example, the genetic correlation between MUN measured between 100–150 and >150 DIM was 0.85 in AU_ALL and 0.63 in NZ_ALL.
|
Genetic correlations between AU and NZ
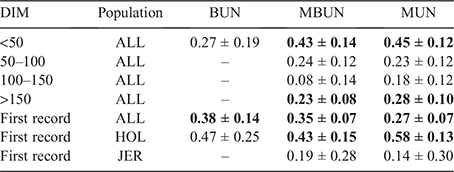
Table 9 shows genetic correlations between urea traits measured in AU and MUN recorded in NZ. Correlations between AU_ALL and NZ_ALL were strongest for <50 DIM, with correlations of 0.43 and 0.45 for MBUN and MUN respectively. The genetic correlations between BUN in AUS_ALL and MUN in NZ_ALL were not significantly different from zero. Correlations were lower and mostly not significant for other DIM intervals, with correlations up to 0.28 between MUN in AUS_ALL and MUN in NZ_ALL for >150 DIM. Genetic correlations between countries for production traits (Table A2) were low to moderate for MY, FY and PY, and larger for F% and P%.
|
Discussion
In the present study, we estimated genetic parameters of several indicator traits of nitrogen utilisation to assess the potential of sharing urea data between AU and NZ. Generally, heritabilities varied per population and trait, and genetic correlations between countries were moderate.
Heritabilities
Heritabilities for BUN and MBUN in AU Holstein were similar to those previously reported on largely the same dataset (Luke et al. 2019a; van den Berg et al. 2021), with slight differences that may be due to the small dataset and, consequently, large standard errors. Our previous study focussed only on AU Holstein, while in the current study, we estimated heritabilities not only for Holstein, but also for Jersey and by using a multibreed dataset. Because of the small number of records available for BUN in AU Jerseys, heritabilities for AU Jersey were estimated only for MBUN and MUN. While the heritability of MUN was larger in AU Jersey (0.15) than in AU Holstein (0.10), the standard error of the estimate in AU Jersey was 0.04; hence, the difference was not significant.
Heritabilities for MUN varied between country and breed and encompassed the range of previously published estimates (Mitchell et al. 2005; Stoop et al. 2007; König et al. 2008; Beatson et al. 2019; Bobbo et al. 2020). The heritability of MUN was substantially larger in NZ than in AU, for all populations. A similar trend was observed for the production traits, with larger heritabilities in NZ than in AU. The AU and NZ data differed in the DIM on which they were measured. In AU, more records were available early in lactation, while in NZ, the average DIM was larger. To investigate whether the difference in DIM could explain the observed difference in heritabilities for MUN between NZ and AU, we estimated heritabilities for different DIM intervals. However, we found only small, inconsistent differences in heritabilities between DIM intervals, which agrees with the results presented by Mucha and Strandberg (2011), showing little change in the heritability of MUN during lactation. Hence, the difference in DIM does not explain the larger heritability obtained in NZ than in AU. Other potential causes of this discrepancy could be differences in recording system and differences in breed composition. Differences in recording could be due to the use of different equipment to obtain MUN. MUN in AU is derived using the commercial prediction equation from Bentley Instruments, while MUN in NZ is derived using the FOSS MilkOscan FT + analyser.
Differences in breed composition may also play a role in the differences in heritability observed in AU and NZ. By using PC1, that relates to the proportion of Holstein and Jersey, we did not account for the effects of other breeds. To assess whether PC1 adequately accounted for the breed effects in the dataset, we used the cross-validation procedure implemented in ADMIXTURE to estimate the number of populations. The ADMIXTURE results seem to suggest that only accounting for two populations (Holstein and Jersey) is appropriate for our dataset.
Another factor that may influence our estimates and was not included in our models is heterosis. Especially in NZ, with a large number of crossbreds, heterosis may be an important factor, and not including heterosis in the model may have resulted in inflated heritabilities in NZ. However, in previous analyses of MUN in NZ, heterosis between Holstein and Jersey was not significant (P. R. Beatso,n unpubl. data, analyses described by Beatson et al. (2019)); hence, we did not include a heterosis term in our models. Heterosis due to mixtures of other breeds may still be significant. For example, the cows described as Holstein in our paper are a mixture of Holstein and Friesian cattle. The NZ Holstein–Friesian population was imported from the West of the USA before the 1920s and remained small and closed until 1960. The current NZ population has been graded up from a Jersey base with extensive importation of US genetics, especially in the 1990s (Harris and Kolver 2001). However, in our study we did not have the data to distinguish between strains of Holstein and Friesian, and were not able to test whether heterosis between Holstein and Friesian was significant.
Genetic correlations between urea traits in AU
Previously, we reported strong correlations (0.96–0.98) between BUN and MBUN (van den Berg et al. 2021). In our current study, correlations were slightly lower (0.90–0.94). The slightly lower correlations could be due to differences in DIM; all BUN records were measured less than 50 DIM, while for MBUN, records later in lactation were also used in the current study but not in that of van den Berg et al. (2021). Correlations between MBUN recorded less than 50 DIM and after 150 DIM are low (0.23); hence, including MBUN records later in lactation is likely to have contributed to the slight decrease in the genetic correlation with BUN measured less than 50 DIM. Correlations between BUN and MUN and MBUN and MUN were smaller than those between BUN and MBUN, but still high (0.71–0.77), and either trait may be useful to select for reduced urine nitrogen excretion (Kauffman and St-Pierre 2001; Kohn et al. 2002, 2005).
Genetic correlations between urea traits in AU and NZ
Genetic correlations were low to moderate, indicating that urea traits measured in AU are correlated with MUN in NZ, but cannot be considered as the same trait. Genetic correlations between countries for MY, FY and PY were substantially lower than those reported by Haile-Mariam et al. (2020) and Interbull (2018). Genetic correlations for urea traits were larger in Holstein than in Jersey or the multibreed population, and larger when restricted to records early in lactation than when using the first record of each cow. Hence, within-breed analyses restricted to records early in lactation may be better than maximising the number of records used in the analyses, if the selection target is early in lactation. However, especially in NZ, the number of crossbred cows is substantial, and further study is required to assess whether within-breed or multi-breed prediction yield higher accuracies. Furthermore, standard errors of the genetic correlations between AU and NZ were very large, and genetic correlations should be re-estimated once a larger dataset is available to obtain more accurate estimates.
The motivation behind our study was to estimate genetic correlations between urea traits in AU and NZ to gauge the potential benefits of a joint AU–NZ reference population for genomic prediction of urea. The low genetic correlations between AU and NZ appears to limit the potential to increase the accuracy from having such a joint reference population. However, even if a multi-population reference population does not result in higher accuracies than does within-population prediction, the joint dataset may still be beneficial to identify quantitative trait loci associated with urea in both countries. A multi-population genome-wide association study may increase prediction and power compared with within-population genome-wide association study (van den Berg et al. 2016a, 2020), and including sequence variants associated with quantitative trait loci can increase prediction accuracy (Brøndum et al. 2015; van den Berg et al. 2016b).
Genetic correlations between urea traits and other traits
Genetic correlations between urea traits and milk production traits were mostly unfavourable, especially with FY and PY. Reduced urea has been associated with reduced feed intake (Spek et al. 2013), which may explain the unfavourable genetic correlations between production traits and urea traits in our study. König et al. (2008) reported unfavourable genetic correlations between MUN and MY and fertility traits. Hence, selecting for lower urea may result in unfavourable correlated responses for other traits. Genetic correlations among traits should be considered when devising index weights to reduce urea while limiting unfavourable correlated responses of other traits. Ariyarathne et al. (2021) reported that selection for reduced MUN in the NZ production system is likely to lead to minor improvements at the whole-farm level and is negligible compared with other factors such as stocking rate. Furthermore, their results showed that including MUN in a selection index can have a negative impact on farm profit.
Conclusions
Our results have shown that heritability for urea traits differs among trait, breed and country. While urea traits are highly correlated within country, genetic correlations between urea traits in Australia and MUN in NZ were only low to moderate. Further study is required to identify the underlying causes of the difference in heritabilities observed and the biological consequences of selection for reduced BUN or MUN. Larger datasets may help estimate genetic correlations more accurately among countries and between urea and traits of economic interest such as MY and fertility. On the basis of our current estimates, a shared cow reference population for urea records between AU and NZ is likely to be more beneficial when restricted to records obtained early in lactation.
Conflicts of interest
The authors declare no conflicts of interest.
Acknowledgements
This study was undertaken as a collaboration between the DairyBio program and CRV. DairyBio is jointly funded by Dairy Australia (Melbourne, Australia) and Agriculture Victoria (Melbourne, Australia) and The Gardiner Foundation (Melbourne, Australia). The authors thank Tim Luke, Di Mapleson, Brigid Ribaux from Agriculture Victoria Research, and the staff at Ellinbank Dairy Research Centre (Ellinbank, Australia) for their technical expertise and assistance, staff from Datagene (Bundoora, Australia) for their work in sampling and on-farm coordinating role in this study, and the farmers who participated in this project. Hico Pty Ltd (Maffra, Victoria, Australia) and TasHerd Pty Ltd (Hadspen, Australia) are gratefully acknowledged for collecting milk samples and providing MIR spectral data. Regional Laboratory Services (Benalla, Victoria, Australia) are thanked for measuring the concentrations of blood urea used in this study. The authors extend their gratitude to the AgriBio molecular genetics team (Bundoora, Australia), particularly Iona MacLeod, Tuan Nguyen and Sunduimijid Bolormaa, for imputation, Coralie Reich, Brett Mason and Amanda Chamberlain, for genotyping, and the farmers and DataGene for access to data used in this study.
References
Alexander DH, Novembre J, Lange K (2009) Fast model-based estimation of ancestry in unrelated individuals. Genome Research 19, 1655–1664.| Fast model-based estimation of ancestry in unrelated individuals.Crossref | GoogleScholarGoogle Scholar | 19648217PubMed |
Ariyarathne HBPC, Correa-Luna M, Blair H, Garrick D, Lopez-Villalobos N (2021) Can Nitrogen Excretion of Dairy Cows Be Reduced by Genetic Selection for Low Milk Urea Nitrogen Concentration? Animals 11, 737
| Can Nitrogen Excretion of Dairy Cows Be Reduced by Genetic Selection for Low Milk Urea Nitrogen Concentration?Crossref | GoogleScholarGoogle Scholar | 33800330PubMed |
Beatson PR, Meier S, Cullen NG, Eding H (2019) Genetic variation in milk urea nitrogen concentration of dairy cattle and its implications for reducing urinary nitrogen excretion. Animal 13, 2164–2171.
| Genetic variation in milk urea nitrogen concentration of dairy cattle and its implications for reducing urinary nitrogen excretion.Crossref | GoogleScholarGoogle Scholar | 30808431PubMed |
Bobbo T, Penasa M, Rossoni A, Cassandro M (2020) Short communication: genetic aspects of milk urea nitrogen and new indicators of nitrogen efficiency in dairy cows. Journal of Dairy Science 103, 9207–9212.
| Short communication: genetic aspects of milk urea nitrogen and new indicators of nitrogen efficiency in dairy cows.Crossref | GoogleScholarGoogle Scholar | 32773306PubMed |
Brøndum RF, Su G, Janss L, Sahana G, Guldbrandtsen B, Boichard D, Lund MS (2015) Quantitative trait loci markers derived from whole genome sequence data increases the reliability of genomic prediction. Journal of Dairy Science 98, 4107–4116.
| Quantitative trait loci markers derived from whole genome sequence data increases the reliability of genomic prediction.Crossref | GoogleScholarGoogle Scholar | 25892697PubMed |
Gustafsson AH, Palmquist DL (1993) Diurnal Variation of Rumen Ammonia, Serum Urea, and Milk Urea in Dairy Cows at High and Low Yields. Journal of Dairy Science 76, 475–484.
| Diurnal Variation of Rumen Ammonia, Serum Urea, and Milk Urea in Dairy Cows at High and Low Yields.Crossref | GoogleScholarGoogle Scholar | 8445100PubMed |
Haile-Mariam M, MacLeod IM, Bolormaa S, Schrooten C, O’Connor E, de Jong G, Daetwyler HD, Pryce JE (2020) Value of sharing cow reference population between countries on reliability of genomic prediction for milk yield traits. Journal of Dairy Science 103, 1711–1728.
| Value of sharing cow reference population between countries on reliability of genomic prediction for milk yield traits.Crossref | GoogleScholarGoogle Scholar | 31864746PubMed |
Harris BL, Kolver ES (2001) Review of Holsteinization on intensive pastoral dairy farming in New Zealand. Journal of Dairy Science 84, E56–E61.
| Review of Holsteinization on intensive pastoral dairy farming in New Zealand.Crossref | GoogleScholarGoogle Scholar |
Ho PN, Luke TDW, Pryce JE (2021) Validation of milk mid-infrared spectroscopy for predicting the metabolic status of lactating dairy cows in Australia. Journal of Dairy Science 104, 4467–4477.
| Validation of milk mid-infrared spectroscopy for predicting the metabolic status of lactating dairy cows in Australia.Crossref | GoogleScholarGoogle Scholar | 33551158PubMed |
Interbull (2018) Appendix. Available at https://interbull.org/static/mace_evaluations_archive/eval/prod-appen1-141.pdf [Accessed February 2021]
Kauffman AJ, St-Pierre NR (2001) The relationship of milk urea nitrogen to urine nitrogen excretion in Holstein and Jersey cows. Journal of Dairy Science 84, 2284–2294.
| The relationship of milk urea nitrogen to urine nitrogen excretion in Holstein and Jersey cows.Crossref | GoogleScholarGoogle Scholar | 11699460PubMed |
Kohn RA, Dinneen MM, Russek-Cohen E (2005) Using blood urea nitrogen to predict nitrogen excretion and efficiency of nitrogen utilization in cattle, sheep, goats, horses, pigs, and rats. Journal of Animal Science 83, 879–889.
| Using blood urea nitrogen to predict nitrogen excretion and efficiency of nitrogen utilization in cattle, sheep, goats, horses, pigs, and rats.Crossref | GoogleScholarGoogle Scholar | 15753344PubMed |
Kohn RA, Kalscheur KF, Russek-Cohen E (2002) Evaluation of models to estimate urinary nitrogen and expected milk urea nitrogen. Journal of Dairy Science 85, 227–233.
| Evaluation of models to estimate urinary nitrogen and expected milk urea nitrogen.Crossref | GoogleScholarGoogle Scholar | 11860115PubMed |
König S, Chang YM, Borstel UUV, Gianola D, Simianer H (2008) Genetic and phenotypic relationships among milk urea nitrogen, fertility, and milk yield in Holstein cows. Journal of Dairy Science 91, 4372–4382.
| Genetic and phenotypic relationships among milk urea nitrogen, fertility, and milk yield in Holstein cows.Crossref | GoogleScholarGoogle Scholar | 18946143PubMed |
Luke TDW, Nguyen TTT, Rochfort S, Wales WJ, Richardson CM, Abdelsayed M, Pryce JE (2019a) Genomic prediction of serum biomarkers of health in early lactation. Journal of Dairy Science 102, 11142–11152.
| Genomic prediction of serum biomarkers of health in early lactation.Crossref | GoogleScholarGoogle Scholar | 31587909PubMed |
Luke TDW, Rochfort S, Wales WJ, Bonfatti V, Marett L, Pryce JE (2019b) Metabolic profiling of early-lactation dairy cows using milk mid-infrared spectra. Journal of Dairy Science 102, 1747–1760.
| Metabolic profiling of early-lactation dairy cows using milk mid-infrared spectra.Crossref | GoogleScholarGoogle Scholar | 30594377PubMed |
Lund MS, Van Den Berg I, Ma P, Brøndum RF, Su G (2016) Review: how to improve genomic predictions in small dairy cattle populations. Animal 10, 1042–1049.
| Review: how to improve genomic predictions in small dairy cattle populations.Crossref | GoogleScholarGoogle Scholar | 26781646PubMed |
Misztal I, Legarra A, Aguilar I (2014a) Using recursion to compute the inverse of the genomic relationship matrix. Journal of Dairy Science 97, 3943–3952.
| Using recursion to compute the inverse of the genomic relationship matrix.Crossref | GoogleScholarGoogle Scholar | 24679933PubMed |
Misztal I, Tsuruta S, Lourenco D, Aguilar I, Legarra A, Vitezica Z (2014b) Manual for BLUPF90 family of programs. Available at http://nce.ads.uga.edu/wiki/lib/exe/fetch.php?media=blupf90_all7.pdf.
Mitchell RG, Rogers GW, Dechow CD, Vallimont JE, Cooper JB, Sander-Nielsen U, Clay JS (2005) Milk urea nitrogen concentration: heritability and genetic correlations with reproductive performance and disease. Journal of Dairy Science 88, 4434–4440.
| Milk urea nitrogen concentration: heritability and genetic correlations with reproductive performance and disease.Crossref | GoogleScholarGoogle Scholar | 16291635PubMed |
Mucha S, Strandberg E (2011) Genetic analysis of milk urea nitrogen and relationships with yield and fertility across lactation. Journal of Dairy Science 94, 5665–5672.
| Genetic analysis of milk urea nitrogen and relationships with yield and fertility across lactation.Crossref | GoogleScholarGoogle Scholar | 22032390PubMed |
O’Callaghan P, Kelly-Quinn M, Jennings E, Antunes P, O’Sullivan M, Fenton O, Huallacháin DÓ (2019) The Environmental Impact of Cattle Access to Watercourses: Review. Journal of Environmental Quality 48, 340–351.
| The Environmental Impact of Cattle Access to Watercourses: Review.Crossref | GoogleScholarGoogle Scholar | 30951116PubMed | )
Sargolzaei M, Chesnais JP, Schenkel FS (2014) A new approach for efficient genotype imputation using information from relatives. BMC Genomics 15, 478
| A new approach for efficient genotype imputation using information from relatives.Crossref | GoogleScholarGoogle Scholar | 24935670PubMed |
Spek JW, Dijkstra J, Van Duinkerken G, Bannink A (2013) A review of factors influencing milk urea concentration and its relationship with urinary urea excretion in lactating dairy cattle. The Journal of Agricultural Science 151, 407–423.
| A review of factors influencing milk urea concentration and its relationship with urinary urea excretion in lactating dairy cattle.Crossref | GoogleScholarGoogle Scholar |
Stoop WM, Bovenhuis H, Van Arendonk JAM (2007) Genetic parameters for milk urea nitrogen in relation to milk production traits. Journal of Dairy Science 90, 1981–1986.
| Genetic parameters for milk urea nitrogen in relation to milk production traits.Crossref | GoogleScholarGoogle Scholar | 17369239PubMed |
van den Berg I, Boichard D, Lund MS (2016a) Comparing power and precision of within-breed and multibreed genome-wide association studies of production traits using whole-genome sequence data for 5 French and Danish dairy cattle breeds. Journal of Dairy Science 99, 8932–8945.
| Comparing power and precision of within-breed and multibreed genome-wide association studies of production traits using whole-genome sequence data for 5 French and Danish dairy cattle breeds.Crossref | GoogleScholarGoogle Scholar | 27568046PubMed |
van den Berg I, Boichard D, Lund MS (2016b) Sequence variants selected from a multi-breed GWAS can improve the reliability of genomic predictions in dairy cattle. Genetics, Selection, Evolution. 48, 83
| Sequence variants selected from a multi-breed GWAS can improve the reliability of genomic predictions in dairy cattle.Crossref | GoogleScholarGoogle Scholar | 27809758PubMed |
van den Berg I, Ho PN, Luke TDW, Haile-Mariam M, Bolormaa S, Pryce JE (2021) The use of milk mid-infrared spectroscopy to improve genomic prediction accuracy of serum biomarkers. Journal of Dairy Science 104, 2008–2017.
| The use of milk mid-infrared spectroscopy to improve genomic prediction accuracy of serum biomarkers.Crossref | GoogleScholarGoogle Scholar | 33358169PubMed |
van den Berg I, Xiang R, Jenko J, Pausch H, Boussaha M, Schrooten C, Tribout T, Gjuvsland AB, Boichard D, Nordbø Ø, Sanchez MP, Goddard ME (2020) Meta-analysis for milk fat and protein percentage using imputed sequence variant genotypes in 94,321 cattle from eight cattle breeds. Genetics, Selection, Evolution. 52, 37
| Meta-analysis for milk fat and protein percentage using imputed sequence variant genotypes in 94,321 cattle from eight cattle breeds.Crossref | GoogleScholarGoogle Scholar | 32635893PubMed |
VanRaden PM (2008) Efficient methods to compute genomic predictions. Journal of Dairy Science 91, 4414–4423.
| Efficient methods to compute genomic predictions.Crossref | GoogleScholarGoogle Scholar | 18946147PubMed |
Yang J, Lee SH, Goddard ME, Visscher PM (2011) GCTA: a tool for genome-wide complex trait analysis. American Journal of Human Genetics 88, 76–82.
| GCTA: a tool for genome-wide complex trait analysis.Crossref | GoogleScholarGoogle Scholar | 21167468PubMed |


