

ImmuneDEX: updated genomic estimates of genetic parameters and breeding values for Australian Angus cattle
Antonio Reverter A D , Brad C. Hine B , Laercio Porto-Neto A , Pamela A. Alexandre A , Yutao Li A , Christian J. Duff C , Sonja Dominik B and Aaron B. Ingham A
A CSIRO Agriculture & Food, Queensland Bioscience Precinct, 306 Carmody Road, St Lucia, Brisbane, Qld 4067, Australia.
B CSIRO Agriculture & Food, F.D. McMaster Laboratory, Chiswick, New England Highway, Armidale, NSW 2350, Australia.
C Angus Australia, 86 Glen Innes Road, Armidale, NSW 2350, Australia.
D Corresponding author. Email: tony.reverter-gomez@csiro.au
Animal Production Science - https://doi.org/10.1071/AN21054
Submitted: 5 February 2021 Accepted: 11 June 2021 Published online: 17 August 2021
Journal Compilation © CSIRO 2021 Open Access CC BY-NC-ND
Abstract
Context: Immune competence is a proxy trait for general disease resistance and is based on combined measures of an animal’s ability to mount both a cell-mediated immune response (Cell-IR) and an antibody-mediated immune response (Ab-IR). On the basis of previously described arithmetic, we combined these measures into a single proxy trait for immune competence, named ImmuneDEX (IDEX).
Aims: Using a population of 3715 Australian Angus steers (n = 2395) and heifers (n = 1320) with genotypes for 45 364 single-nucleotide polymorphisms, we provide the latest genomic estimates of heritability and genetic correlations for IDEX and the components Cell-IR and Ab-IR immune competence phenotypes. Accuracy and bias of genomic predictions of breeding values are also presented and discussed.
Methods: Measures of Cell-IR, Ab-IR and IDEX were analysed jointly in a tri-variate genomic restricted maximum-likelihood model that contained the fixed effects of contemporary group with 80 levels, the linear covariates of age at measurement and change in skin thickness at control site, and the random polygenic (genomic estimated breeding value, GEBV) and residual effects. Following Method LR procedures, we estimate accuracy, bias and dispersion of genomic predictions using a cross-validation scheme based on five year-of-birth cohorts.
Key results: We report genomic restricted maximum-likelihood model estimates of heritability of 0.247 ± 0.040 for Cell-IR, 0.326 ± 0.059 for Ab-IR, 0.275 ± 0.046 for IDEX. While a small positive genetic correlation (rg) was estimated between Cell-IR and Ab-IR (rg = 0.138 ± 0.095), strongly positive estimates were obtained between IDEX and Cell-IR (rg = 0.740 ± 0.044) and between IDEX and Ab-IR (rg = 0.741 ± 0.036). Averaged across the five validation sets, the accuracy of GEBV for Cell-IR, Ab-IR and IDEX was 0.405, 0.443 and 0.411 respectively. Also, some significant bias or dispersion can be expected depending on the cohort used as the validation population.
Conclusions: Consistent with previous findings, immune competence phenotypes are moderately heritable and accurate GEBV can be generated to allow the selection of cattle with an improved ability to mount a general immune response.
Implications: Our analyses suggest that ImmuneDEX will provide a tool to underpin long-term genetic strategies aimed at improving the immune competence of Australian Angus cattle in production systems, which, in turn, is expected to reduce the incidence of disease and our reliance on antibiotics to treat disease.
Keywords: beef cattle, heritability, immune competence, genomic predictions, accuracy.
Introduction
The ability to simultaneously select for improved productivity and animal welfare outcomes is key to maintain sustainable livestock production. One way to achieve this goal is to breed animals with enhanced immune competence, described as an animal’s ability to mount an immune response, which is expected to be an indirect indicator of an animal’s ability to resist disease challenges faced in their production environment (Wilkie and Mallard 1999).
Using a population of 1149 Australian Angus cattle, Hine et al. (2019) developed a method for on-farm assessment of immune competence in beef cattle, which combines measures of an animal’s ability to mount both a cell-mediated immune response (Cell-IR) and an antibody-mediated immune response (Ab-IR). Using the same animal resource, Dominik et al. (2019) applied a weighted average to combine both immune response metrics into a single immune competence phenotype. Their results suggested that a stronger emphasis on Cell-IR would minimise negative impacts on the production trait, feedlot exit weight; however, the importance of a balanced ability to mount both Cell-IR and Ab-IR for general disease resistance was acknowledged.
More recently, Reverter et al. (2021) expanded that earlier work by using a population of 2853 Australian Angus steers and heifers to estimate pedigree-based genetic parameters for immune response metrics. The authors also introduced ImmuneDEX (IDEX) as a single phenotype that describes immune competence by combining Cell-IR and Ab-IR into a single measure and reported its relationship with commonly measured traits related to growth, feedlot performance and carcass characteristics. Key findings for that earlier work indicated that ImmuneDEX will provide a basis to breed animals that are both highly productive and with an enhanced ability to resist disease.
The objective of the present study was to further expand on that work using a population of 3715 Australian Angus steers and heifers with genotypes for 45 364 autosomal single-nucleotide polymorphisms (SNPs), and to provide the latest multivariate genomic estimates of heritability and genetic correlations for IDEX and the associated Cell-IR and Ab-IR immune competence phenotypes. In addition, accuracy, bias and dispersion of genomic predictions of breeding values (GEBV) for Cell-IR, Ab-IR and IDEX are presented and discussed.
Materials and methods
Animals and cohorts
In total, 2395 Angus steers and 1320 Angus heifers that were progeny from the Angus Sire Benchmarking Program (ASBP) were included in this study. Animals were from five year-of-birth (YOB) cohorts: 2012 (n = 497 animals from 48 sires), 2013 (n = 418 animals from 43 sires), 2016 (n = 1220 animals from 64 sires), 2017 (n = 925 animals from 56 sires) and 2018 (n = 655 animals from 43 sires), representing 12 herds and 232 sires from the ASBP. The ASBP is a major initiative of Angus Australia to generate progeny test data on modern Angus bulls, particularly for hard-to-measure traits such as feed efficiency, abattoir carcass measurements, meat-quality attributes, and female reproduction (https://www.angusaustralia.com.au/sire-benchmarking/about/general-information/).
By its own design, there exist minimal sire linkages across YOB cohorts in the ASBP. In our current dataset, there were three link sires between YOB cohorts 2012 and 2013, 14 link sires between YOB cohorts 2016 and 2017, two link sires between YOB cohorts 2016 and 2018, and five link sires between YOB cohorts 2017 and 2018.
Phenotypes and genotypes
On the basis of previously described protocols (Hine et al. 2019), the immune competence phenotype of animals was assessed using measures of both Cell-IR and Ab-IR. In brief, calves were vaccinated with Ultravac 7in1 clostridial and leptospira vaccine (Zoetis) on the day they were weaned. Calves were then given time to respond to the vaccination and Cell-IR was assessed by measuring the magnitude of delayed-type hypersensitivity reactions induced by intradermal injection of the clostridial and leptospira vaccine in the caudal fold of the tail. The Cell-IR trait is expressed for each animal as the increase in skin-fold thickness at the test site receiving the vaccine relative to the increase in skin-fold thickness observed at the control site receiving saline. To assess Ab-IR, the production of tetanus toxoid-specific IgG1 serum antibody was measured between Day 8 and Day 21 post-vaccination (depending on prior vaccination history), by using an enzyme-linked immunosorbent assay and results are reported in optical-density units. All animals within a herd-testing cohort had an identical vaccination history and were assessed for immune competence on the same day post-vaccination. To approximate normality, the immune competence phenotypes of Cell-IR and Ab-IR were log- and square root-transformed respectively. Finally, values were multiplied by 100 for numerical convenience.
Following Reverter et al. (2021), Cell-IR and Ab-IR were combined to generate IDEX as follows:
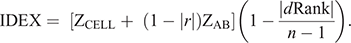
where ZCELL and ZAB are the Z-score standardisation of Cell-IR and Ab-IR respectively; r is the Pearson correlation coefficient between Cell-IR and Ab-IR; and dRank is the difference in ranking of individuals for each metric.
In addition, genotypes for 45 364 autosomal SNPs were available for the 3715 animals included in the study, and were used to compute the genomic relationship matrix (G) following Method 1 of VanRaden (2008) with the modification of Karoui et al. (2012) to make it invertible, as follows:
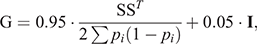
where S is the centred matrix relating SNP genotypes (recoded as 0, 1 or 2) in columns with animals in rows, and pi is the frequency of the second allele of the ith SNP, and I is an identity matrix included to make Genomic Relationship Matrix invertible by enlarging the diagonal elements.
Genomic predictions and cross-validation models
Variance components, heritability (h2), genetic (rg) and residual (re) correlations were estimated on the basis of GBLUP methodology, by using the Qxpak5 software (Pérez-Enciso and Misztal 2011). For the genomic prediction models, we performed GBLUP analyses using a tri-variate (Cell-IR, Ab-IR and IDEX) mixed-effect model that contained the fixed effects of contemporary group (CG), and the linear covariates of age at measurement in days and the logarithm of the fold change in skin thickness at the control site. For each phenotype, CG contained animals of the same sex, YOB cohort, month of birth, property of origin, and date of measurement.
Additionally, the random additive polygenic and residual effects were fitted with assumed distributions N(0, G⊗V) and N(0, I⊗R) respectively, where G represents the genomic relationship matrix described earlier, V is the 3 × 3 genetic co-variance matrix, I is an identity matrix, R is the residual variance–covariance matrix and ⊗ represents the Kronecker product.
The tri-variate analysis was initially performed with the whole dataset of 3715 records. Then, for the cross-validation, the analysis was repeated five times, each after setting as missing values the records from animals of a given YOB cohort. The resulting GEBV from the analysis using the entire dataset are termed  to indicate that they are based on the whole dataset and will be used as the calibration. Similarly, the GEBV from the analyses that treated as missing values records from a given YOB cohort are termed
  to indicate that they are based on partial data and will be used as the validation.
Traditional (Bolormaa et al. 2013) and Method LR (Legarra and Reverter 2018) approaches were used to estimate accuracy, bias and dispersion of GEBV. The following four metrics were employed:
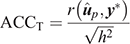
(1) Traditional accuracy (ACCT): in the context of cross-validation, the accuracy of a GEBV is traditionally computed from the Pearson correlation between a GEBV and the adjusted phenotype (y*; phenotype y adjusted for fixed effects) for individuals in the validation population, and divided by the square root of heritability:
(2) Method LR Accuracy (ACCLR): for individuals in the validation population, Method LR accuracy was computed as follows:
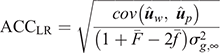
where  is the average inbreeding coefficient,
  is the average relationship between individuals, and
  is the genetic variance at equilibrium in a population under selection. Assuming the individuals in the validation population are not under selection, can be approximated by the additive genetic variance estimated from the partial dataset.
(3) Method LR Bias (BiasLR): difference between the average GEBV of individuals in the validation population using the partial data minus that using the whole data:
In the absence of bias, the expected value of BiasLR is zero, whereas positive and negative values indicate respectively overestimation and underestimation of GEBV for validation animals when their own observation was not included.
(4) Method LR Dispersion (DispLR): for individuals in the validation population, dispersion was measured from the slope of the regression of  on
on  :
:
In the absence of bias, the expected value of DispLR is 0. Values less than 0 indicate under-dispersion (or deflation) of into as phenotypes become available. Values >1 indicate over-dispersion (or inflation) of into .
Results and discussion
Phenotypes, genomic relationships and genetic parameters
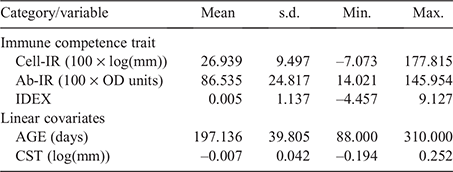
Table 1 provides summary statistics for all phenotypes and covariates used in analyses. To approximate normality, the immune competence phenotypes for Cell-IR and Ab-IR were log- and square root-transformed respectively, and were consistent with the values reported by Reverter et al. (2021), using a subset of 2853 animals. Across all 3715 animals from the current study, and using raw unadjusted measurements, the correlation between Cell-IR and Ab-IR was moderately positive at 0.195 ± 0.016 and slightly higher for steers (0.206 ± 0.020) than for heifers (0.138 ± 0.027).
|
In agreement with theoretical expectations, the 3715 diagonal elements of the genomic relationship matrix G averaged 0.997, with a standard deviation (s.d.) of 0.028, and ranged from 0.912 to 1.131. Meanwhile, the 6 898 755 off-diagonal elements of G averaged –0.000, with a s.d. of 0.030 and ranged from –0.105 to 0.648. The similarity in the variance of diagonal and off-diagonal elements indicates both that a sufficiently large number of SNP was used to estimate relationships and the presence of a single-breed population (Simeone et al. 2011).
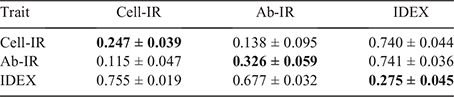
Genomic estimates of genetic variance (±standard error, s.e.) for Cell-IR, Ab-IR and IDEX were 17.093 (±2.852), 153.646 (±31.236) and 0.260 (±0.047) respectively. Table 2 provide estimates of h2, genetic and residual correlations across the three immune competence traits using the whole dataset. The estimates of h2 for Cell-IR and Ab-IR were 0.247 ± 0.039 and 0.326 ± 0.059 respectively. These values are comparatively lower than the pedigree-based estimates recently reported by Reverter et al. (2021) of 0.31 ± 0.06 and 0.42 ± 0.06 respectively, for the same traits. The lower estimates can be attributed to several factors, including the use of genomic data here, the larger sample size and the analytical models (i.e. trivariate here vs the average of bivariate in the earlier work).
|
The estimated rg between Cell-IR and Ab-IR was 0.138 ± 0.095, closer to zero and more precisely estimated because of the larger sample size than the 0.33 ± 0.12 (Reverter et al. 2021), 0.48 ± 0.19 (Hine et al. 2019) or the 0.40 ± 0.22 from Dominik et al. (2019) values reported previously. However, strongly positive estimates of genetic correlation were obtained between IDEX and Cell-IR (rg = 0.740 ± 0.044) and between IDEX and Ab-IR (rg = 0.741 ± 0.036). These high genetic correlation estimates between component traits and the composite trait are comparatively less extreme, but within two s.e., of the ones reported by Reverter et al. (2021) of 0.80 ± 0.05 (for IDEX and Cell-IR) and 0.85 ± 0.04 (for IDEX and Ab-IR). Taken together, these values anticipate the suitability of IDEX as a single phenotype to aid in the genetic improvement of immune competence and potentially general disease resistance in the current population.
Further research is needed to (re)evaluate the relationship between the immune competence phenotypes analysed here and productivity-based phenotypes related to growth, feedlot performance and carcass characteristics. In particular, it would be of interest to recapitulate the negative genetic correlation between the immune competence traits and the growth traits, such as –0.38 ± 0.14 between IDEX and the weaning weight estimated by Reverter et al. (2021). Such finding would agree with previous reports showing that selection for productivity, with no emphasis on health and fitness traits, has increased susceptibility to disease in many species of food-producing animals (Rauw et al. 1998).
Accuracy, bias and dispersion of GEBV
Table 3 shows the ACCT and ACCLR of GEBVs for the three immune competence traits when each consecutive YOB cohort was used as the validation population. While there was a strong correlation between ACCT and ACCLR across the 15 measures (r = 0.831 ± 0.154), on average, the ACCLR accuracies were 38% higher than the ACCT accuracies (0.420 vs 0.304). Averaged across the five YOB cohorts, the highest accuracy was observed for Ab-IR (ACCT=0.348, ACCLR = 0.443), which could be attributed to its higher h2 estimate (0.326 ± 0.059; Table 2). With a reference population of 4000 animals, a h2 of 0.3 and an effective population size (Ne) of 100, the expected GEBV accuracy is ~0.45 (fig. 3b in Goddard and Hayes 2009). Similarly, with a reference population of 1743 Australian Angus cattle, Bolormaa et al. (2013) reported a GEBV accuracy of 0.26 averaged across 16 traits. De Roos et al. (2008) estimated Ne in Australian Holstein–Friesian, Jersey and Angus cattle and found that the Ne for these breeds has decreased over the past 50 generations, to ~100. Therefore, averaged across the three traits, the ACCLR at 0.420 (compared with ACCT at 0.304) is closer to the theoretical expectation.
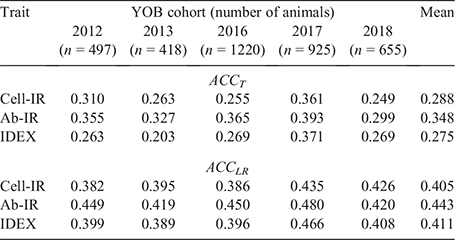
|
It is worth noting that the complete dataset was used to obtain estimates of CG fixed effects and covariates, and these estimates were used to adjust the phenotypes of individuals in the validation population, and with adjusted phenotypes needed in the computation of ACCT. Animals in validation and training sets were raised in different CGs. Therefore, the only linkage between them is through genomic relationships and no link was created as a consequence of using records in the validation sets to obtain the estimates to accomplish the precorrection.
Table 4 lists the estimates of GEBV bias and dispersion for the three IC traits when using each consecutive YOB cohort as the validation population. In 4 of the 15 instances (3 traits × 5 YOB cohorts), zero was not contained in the interval spanned by bias ± 1 s.e. Two of these four instances corresponded to Cell-IR using the 2012 and 2013 YOB cohorts with negative and positive bias respectively. This could be attributed to 2012 and 2013, being the smallest YOB cohorts and, hence, more prone to sampling variation. To aid in the interpretation of estimates of bias presented in Table 4, Fig. 1 shows the average GEBV by each YOB cohort for the three immune competence traits, Cell-IR (top panel), Ab-IR (middle panel) and IDEX (bottom panel), estimated using either the whole data (blue bars and termed ) or partial data (orange bars and termed ) where the phenotypes of the YOB cohort were treated as missing values. Only for Cell-IR and YOB cohort 2012 and 2013 were the GEBV on the basis of whole or partial data in opposite sign, on average.

|
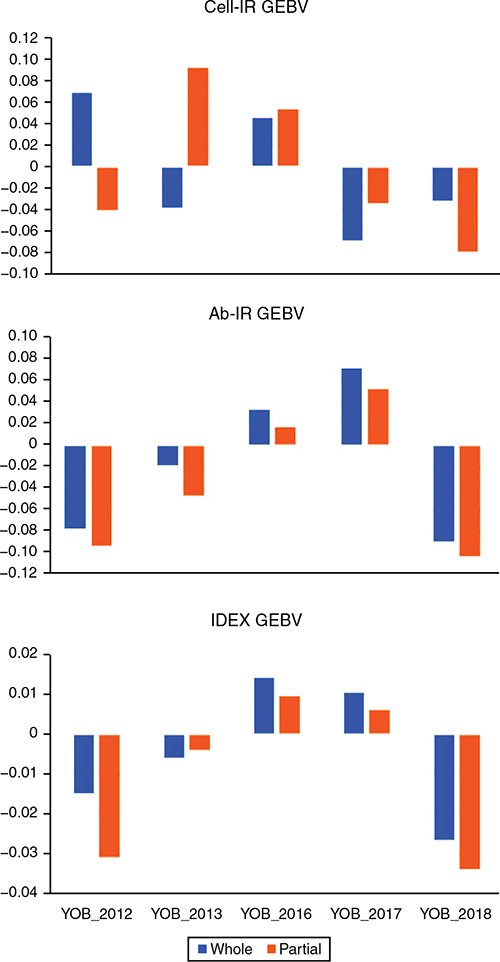
|
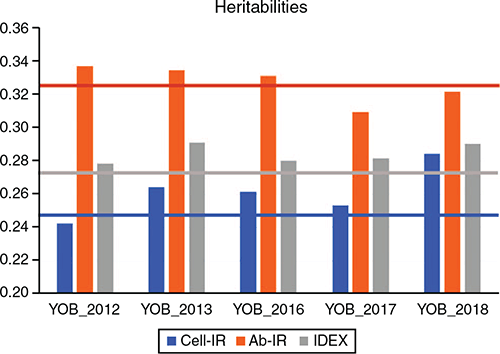
Similarly, the estimates of GEBV dispersion for Cell-IR and IDEX show that in four of the five YOB cohorts, the interval spanned by dispersion ± 1 s.e. was on the positive side, indicating overdispersion. This overdispersion can be attributed to higher h2 estimates when phenotypes of the YOB cohort were treated as missing values compared with h2 estimates using the whole dataset (Fig. 2).
|
Conclusions
In conclusion, the current study expands on our recently published study introducing ImmuneDEX (Reverter et al. 2021) in four major aspects, as follows: (1) that earlier work focused on the analytical methodology to combine both metrics of immune competence, cell- and antibody-meditated immune response into a single metric, namely ImmuneDEX; (2) the sample size has increased by 30% (or from 2853 before to 3715 now); (3) we now use genomic information to estimate genetic parameters; and (4) we place emphasis on the quality of the resulting GEBVs on the basis of their accuracy, bias and dispersion and using YOB cohorts in a cross-validation scheme to generate the testing populations that, while all comprising Australian Angus cattle, are very poorly related among themselves.
Taken together, and consistent with previous findings, immune competence phenotypes are moderately heritable and accurate GEBVs can be generated for immune competence to allow for selection of cattle with an improved ability to mount an immune response. Our analyses suggest that ImmuneDEX will provide a tool to underpin long-term genetic strategies aimed at improving the immune competence of animals in production systems, which in turn is expected to reduce the incidence of disease and our reliance on antibiotics to treat disease.
Conflicts of interest
The authors declare no conflicts of interest.
Acknowledgements
This work was co-funded by Meat and Livestock Australia (MLA) (MLA, on behalf of the Australian Lot Feeders’ Association), Angus Australia and CSIRO. The authors acknowledge Angus Australia for facilitating access to progeny from the Angus Sire Benchmarking Program for testing and associated data. We gratefully acknowledge cooperating herd owners, managers, and staff. Special thanks go to Sue Belson, Jim Lea, and Grant Uphill for their technical assistance.
References
Bolormaa S, Pryce JE, Kemper K, Savin K, Hayes BJ, Barendse W, Zhang Y, Reich CM, Mason BA, Bunch RJ, Harrison BE, Reverter A, Herd RM, Tier B, Graser H-U, Goddard ME (2013) Accuracy of prediction of genomic breeding values for residual feed intake, carcass and meat quality traits in Bos taurus, Bos indicus and composite beef cattle. Journal of Animal Science 91, 3088–3104.| Accuracy of prediction of genomic breeding values for residual feed intake, carcass and meat quality traits in Bos taurus, Bos indicus and composite beef cattle.Crossref | GoogleScholarGoogle Scholar | 23658330PubMed |
de Roos AP, Hayes BJ, Spelman RJ, Goddard ME (2008) Linkage disequilibrium and persistence of phase in Holstein–Friesian, Jersey and Angus cattle. Genetics 179, 1503–1512.
| Linkage disequilibrium and persistence of phase in Holstein–Friesian, Jersey and Angus cattle.Crossref | GoogleScholarGoogle Scholar | 18622038PubMed |
Dominik S, Porto-Neto LR, Duff CJ, Byrne AI, Hine BC, Ingham A, Colditz IG, Reverter A (2019) A method for developing a breeding objective trait from multiple components using the example of immune competence in Australian Angus cattle. Proceedings of the Association for the Advancement of Animal Breeding and Genetics 23, 402–405.
Goddard M, Hayes B (2009) Mapping genes for complex traits in domestic animals and their use in breeding programmes. Nature Reviews Genetics 10, 381–391.
| Mapping genes for complex traits in domestic animals and their use in breeding programmes.Crossref | GoogleScholarGoogle Scholar | 19448663PubMed |
Hine BC, Bell AM, Niemeyer DOD, Duff CJ, Butcher NM, Dominik S, Ingham AB, Colditz I (2019) Immune competence traits assessed during the stress of weaning are heritable and favourably genetically correlated with temperament traits in Angus cattle. Journal of Animal Science 97, 4053–4065.
| Immune competence traits assessed during the stress of weaning are heritable and favourably genetically correlated with temperament traits in Angus cattle.Crossref | GoogleScholarGoogle Scholar | 31581299PubMed |
Karoui S, Carabano MJ, Diaz C, Legarra A (2012) Joint genomic evaluation of French dairy cattle breeds using multiple-trait models. Genetics, Selection, Evolution 44, 39
| Joint genomic evaluation of French dairy cattle breeds using multiple-trait models.Crossref | GoogleScholarGoogle Scholar | 23216664PubMed |
Legarra A, Reverter A (2018) Semi-parametric estimates of population accuracy and bias of predictions of breeding values and future phenotypes using the LR method. Genetics, Selection, Evolution 50, 53
| Semi-parametric estimates of population accuracy and bias of predictions of breeding values and future phenotypes using the LR method.Crossref | GoogleScholarGoogle Scholar | 30400768PubMed |
Pérez-Enciso M, Misztal I (2011) Qxpak.5: old mixed model solutions for new genomics problems. BMC Bioinformatics 12, 202
| Qxpak.5: old mixed model solutions for new genomics problems.Crossref | GoogleScholarGoogle Scholar | 21612630PubMed |
Rauw WM, Kanis E, Noordhuizen-Stassen EN, Grommers FJ (1998) Undesirable side effects of selection for high production efficiency in farm animals: a review. Livestock Production Science 56, 15–33.
| Undesirable side effects of selection for high production efficiency in farm animals: a review.Crossref | GoogleScholarGoogle Scholar |
Reverter A, Hine BC, Porto-Neto L, Li Y, Duff CJ, Dominik S, Ingham AB (2021) ImmuneDEX: a strategy for the genetic improvement of immune competence in Australian Angus cattle. Journal of Animal Science 99, skaa384
| ImmuneDEX: a strategy for the genetic improvement of immune competence in Australian Angus cattle.Crossref | GoogleScholarGoogle Scholar | 33677583PubMed |
Simeone R, Misztal I, Aguilar I, Legarra A (2011) Evaluation of the utility of diagonal elements of the genomic relationship matrix as a diagnostic tool to detect mislabelled genotyped animals in a broiler chicken population. Journal of Animal Breeding and Genetics 128, 386–393.
| Evaluation of the utility of diagonal elements of the genomic relationship matrix as a diagnostic tool to detect mislabelled genotyped animals in a broiler chicken population.Crossref | GoogleScholarGoogle Scholar | 21906184PubMed |
VanRaden PM (2008) Efficient methods to compute genomic predictions. Journal of Dairy Science 91, 4414–4423.
| Efficient methods to compute genomic predictions.Crossref | GoogleScholarGoogle Scholar | 18946147PubMed |
Wilkie B, Mallard B (1999) Selection for high immune response: an alternative approach to animal health maintenance? Veterinary Immunology and Immunopathology 72, 231–235.
| Selection for high immune response: an alternative approach to animal health maintenance?Crossref | GoogleScholarGoogle Scholar | 10614513PubMed |