

Redefining residual feed intake to account for marbling fat in beef breeding programs
C. J. Duff A B C , J. H. J. van der Werf B , P. F. Parnell A and S. A. Clark B
A Angus Australia, 86 Glen Innes Road, Armidale, NSW 2350, Australia.
B School of Environmental and Rural Science, University of New England, Armidale, NSW 2351, Australia.
C Corresponding author. Email: christian@angusaustralia.com.au
Animal Production Science - https://doi.org/10.1071/AN21107
Submitted: 27 February 2021 Accepted: 27 May 2021 Published online: 21 July 2021
Journal Compilation © CSIRO 2021 Open Access CC BY-NC-ND
Abstract
Context: Improving meat quality traits such as marbling is a well established breeding objective for many beef producers. More recently, the inclusion of feed efficiency is being considered. The main driving factors being the direct feed cost, as well as consumer concerns related to environmental sustainability of beef production.
Aims: The main aim of this study was to examine modifying the definition of residual feed intake (RFI), by including an adjustment for intramuscular fat (IMF). The secondary aim was to further understand the genetic relationships between feed intake and a range of carcass traits.
Methods: Using a population of 4034 Australian Angus animals, feed intake and carcass traits, along with pedigree and fixed effects, were analysed. This included the calculation of three definitions of RFI, being the standard definition, accounting for average daily gain and metabolic mid-weight, and two amended versions accounting for ultrasound IMF (RFIu), or carcass IMF (RFIi). Variance components, heritabilities, and genetic and phenotypic correlations were estimated and compared.
Key results: All three definitions of RFI were moderately heritable (0.30–0.32) and highly correlated, both genetically (0.99) and phenotypically (0.99). Unfavourable genetic correlations were observed between RFI and carcass IMF (CIMF), and between RFIu and CIMF at 0.29 and 0.24 respectively. Similarly, there were unfavourable genetic correlations between RFI and ultrasound IMF (UIMF), between RFIi and UIMF, and between RFIu and UIMF at 0.30, 0,21 and 0.23 respectively.
Conclusions: RFI can be redefined to account for traits, other than average daily gain and metabolic mid-weight, such as IMF. However due to limitations of phenotypic linear regression, and only small amounts of variation in feed intake being explained by the IMF traits, the redefinition of RFI was a suboptimal approach to breeding candidate selection. Furthermore, the present study confirmed the challenges with selecting for both feed efficiency and meat quality traits as they are generally genetically antagonist.
Implications: For beef cattle breeding programs, the investigation of alternative selection approaches is warranted. This may include further understanding the genetic correlations among traits in the breeding objective and, according to their economic value, optimally weighting the related estimated breeding value.
Keywords: Angus, cattle, residual feed intake, intramuscular fat, marbling, genetic parameters.
Introduction
Improving meat quality is a well established breeding objective for many beef cattle producers. This can be achieved by selecting breeding candidates on estimated breeding values (EBVs) based on intra-muscular fat (IMF) or marbling score phenotypes. More recently, beef producers have also considered the inclusion of feed efficiency in their overall breeding objective. The main factors driving this are the direct cost of feed, a major expense across the beef cattle supply chain (Archer et al. 1999), as well as consumer concerns relating to the environmental sustainability of beef production (Meat and Livestock Australia 2020).
Residual feed intake (RFI) is a common measure of feed efficiency and is defined as the difference between the actual and predicted feed intake. In practice, it is estimated by adjusting daily feed intake for the variation in intake attributed to the maintenance of liveweight and growth rate over a given period. Previous studies have indicated that RFI has an antagonistic relationship on the genetic level with meat quality traits such as carcass IMF (Robinson and Oddy 2004; Torres-Vázquez et al. 2018). This poses a challenge for breeding programs with an objective to improve both meat quality and feed efficiency traits. A potential solution, which has not been addressed in previous studies, is to modify the definition of RFI to include meat quality traits such as carcass IMF.
While the common definition for RFI includes adjustments for maintenance of liveweight and growth rate, adjustments can also be included for other traits. Several studies have modified the definition of RFI, for example, Kelly et al. (2019) who included carcass weight and carcass fat score, Basarab et al. (2011) who included heifer backfat thickness and feeding frequency and Moraes et al. (2017) who included bull rump fat thickness. As explained by Kelly et al. (2019), the main reason for including adjustments for fat is to ensure that differences in RFI are not primarily the result of differences in body or carcass fat. For herds selected on low RFI, this approach will minimise the impact of leanness in harvested animals and in breeding females of self-replacing herds. Additionally, Kelly et al. (2019) included carcass weight in their definition of RFI as producers of finished cattle are more concerned with the end carcass weight than the metabolic liveweight (e.g. maintenance of liveweight).
The main aim of the present study was to examine modifying the definition of RFI, by including an adjustment for IMF, and to compare the outcomes to the standard definition of RFI. We hypothesised that this modified definition may better identify selection candidates that will improve feed efficiency without compromising meat quality. The secondary aim was to further understand the genetic relationships between the feed intake and a range of carcass quantity and meat quality traits.
Materials and methods
Animal care
Records collected during the feedlot feeding period were subject to animal ethics approval AEC12-082, University of New England, New South Wales, Australia. Data for carcass traits were collected as part of routine commercial animal management and, therefore, were not subject to animal care and animal ethics committee approval.
Animals, pedigree and phenotypes
All phenotypic data, associated fixed effects and pedigree data used in the study were supplied by Angus Australia and generated from the Angus Sire Benchmarking Program, also known as the Angus Beef Information Nucleus, described by Parnell et al. (2019). The animals in the study (n = 4034), born across 2011–2018 calving years, were either straight-bred steer (n = 3912) or heifer (n = 122) progeny of Angus sires (n = 339) and Angus dams (n = 3197) from 14 different co-operator herds located in New South Wales and Victoria, Australia. Of the dams, the majority had a single progeny represented, while 676 had two or more progeny included in the study.
All animals commenced their first feedlot phase (initial ~100 days on feed) at the University of New England Tullimba Feedlot, Kingstown, New South Wales, Australia. From feedlot entry, animals were fed a conditioning ration for ~21 days, following which they had ad libitum access to a ration composed of 74.8% tempered barley, 4.6% cotton hulls, 6% cottonseed, 5% mill run, 4.6% chopped hay and 5% liquid mineral supplement. As described by Torres-Vázquez et al. (2018), following the initial conditioning period, daily feed intake (DFI kg/day) was measured on each animal by using the GrowSafe automatic feeding system (GrowSafe Systems, Airdrie, Alberta, Canada) over a 70-day test period. During the test period, liveweights were recorded every 2 weeks, with average daily weight gain (ADG, kg/day) being calculated on each animal as the regression of weight on time, and metabolic mid-weight (MMWT) being calculated as the midpoint weight from the regression raised to the 0.73 power (Arthur et al. 2001).
From the data collected during feedlot test period, three versions of RFI (kg/day) were calculated. The first was the standard definition of RFI (herein reported as RFI), which is estimated by linear regression of DFI on ADG and MMWT, with contemporary group being included in the model. The contemporary group accounted for herd, age, birth type (twin vs single), management group (including feedlot pen) and observation date. Two additional versions of RFI were also estimated to be the same as the standard RFI, but with DFI additionally regressed for ultrasound IMF (UIMF), herein reported as RFIu, or carcass IMF (CIMF), herein reported as RFIi.
During the first feedlot phase, all animals were ultrasound scanned by accredited and experienced technicians (Upton et al. 1999) at the 12th and 13th rib site to predict UIMF. They were scanned within contemporary group, on the same day, with the Esaote Aquila system (Pie Medical, Maastricht, Netherlands) equipped with a 3.5-MHz, 18-cm transducer, to provide crush-side and real-time predictions of UIMF.
Following this first feeding phase, most animals (n = 3033) were relocated to Rangers Valley Feedlot, Rangers Valley, New South Wales, for phase two (i.e. final 170 days on feed) to complete the feeding program. Here, they were fed a similar ration as in phase one, under a normal, controlled commercial feeding program for a long-fed market end-point. The balance of the animals (n = 1001) was slaughtered soon after finishing their initial mid-fed feeding period at Tullimba feedlot.
At the end of the feeding period, animals were slaughtered, on the same day, within contemporary groups (i.e. no selective harvesting). On the day of harvest, hot standard carcass weight (CWT) and hot carcass rump fat (CRUMP) measured on the P8 site were collected. The following day, the chilled carcasses were graded by experienced Meat Standards Australia (MSA) graders (Polkinghorne et al. 2008) for a full suite of traits, including eye muscle area (CEMA), ossification score (COSS) and MSA marbling score (CMS; AUS-MEAT, 2020). All carcass-grade data were collected by the one grader on each animal carcass. Additionally, meat samples were collected from the grading site, at the 12th and 13th rib from the longissimus dorsi muscle, and assessed for IMF (CIMF) using soxhlet calibrated near-infrared spectrophotometry, and shear force (CTND) as an indicator for tenderness, both described by Perry et al. (2001). CIMF was collected on all animals, apart from the 2014 calving-year group, while CTND was collected on the 2011, 2012 and 2013 calving-year groups only. The number of records and descriptive statistics for all traits are shown in Table 1.

|
Analysis models
The ASRemL software (Gilmour et al. 2009) was used to estimate phenotypic and genetic parameters from univariate and bivariate mixed-model analysis that included up to three generations of pedigree. Maternal grandparents of the steers were unknown from 11 of the 14 co-operator herds. Fixed effects fitted in all models included the contemporary group and dam age. Age at measurement was fitted by linear regression for the traits recorded during the feedlot test period and carcass weight, while carcass weight was fitted by linear regression for each of the other carcass traits. The contemporary group included animals from the same herd, year of birth, birth type (twin v single), breeder-defined management group and observation date (feed intake test-commencement date or harvest date). This resulted in 168 effective contemporary groups for the traits recorded during the feedlot test period, including an average of 23.4 animals and 145 effective contemporary groups for the carcass traits, including an average of 26.4 animals. In all cases, contemporary group was a significant (P < 0.001) fixed effect, while the level of significance varied for the other fixed effects. For consistency, the fixed effects as described above were included in all models. The univariate animal models can be expressed as
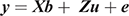
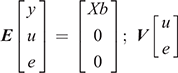
where y is the vector of the trait phenotype; X is the matrix that relates to the fixed effects; b is the vector of the fixed effect of the traits analysed; Z is the matrix which relates to the animal effect; u is the vector of the random additive genetic effect of the animal; and e is the vector of residual effects for the traits analysed. The expectations and variance matrices for random vectors are described as
The bivariate animal models can be expressed as
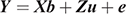
where Y is the vector of the trait phenotypes; X is the matrix that relates to the fixed effects; b is the vector of the fixed effects of the traits analysed; Z is the matrix that relates to the animal effect; u is the vector of the random animal effects; and e is the vector of residual effects for the traits analysed. The expectations and variance matrices for random vectors are described as
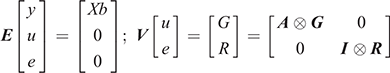
where G and R denote the 2 × 2 matrices containing additive genetic and residual variance components; A is the numerator relationship matrix; I is an identity matrix for the total number of observations; and ⊗ is the Kronecker product.
Heritability estimates from the univariate models, as well as phenotypic and genetic correlations from the bivariate models, were calculated from the resulting variance components.
Results and discussion
Summary statistics
Summary statistics for the feed efficiency measurements, ultrasound scan and carcass traits are shown in Table 1. On a phenotypic level, RFI, RFIu and RFIi are similar when compared by their descriptive statistics, with a standard deviation of 1.20 kg/day for all RFI definitions. Kelly et al. (2019) observed similar results when comparing a standard residual energy intake to residual energy intake adjusted for carcass weight and fat in beef steers and heifers.
The similarity of RFI to RFIi and RFIu is in part explained by the ANOVA, partial regression coefficients and root mean-square errors from the linear regression analysis (Table 2). Table 2 shows that for RFIi, and RFIu, CIMF and UIMF are significant variables (P < 0.001 and P < 0.01 respectively) in explaining differences in DFI. While CIMF and UIMF were significant, they explained only a small proportion of variation when compared with ADG and MMWT. The partial regression coefficients for ADG and MMWT change only minimally. The small root mean-square error values of 0.07–0.11 also indicate that there are minimal differences among the three RFI definitions.

|
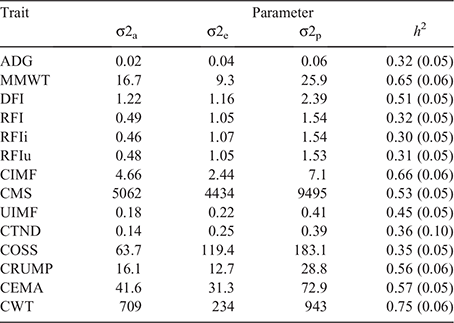
Variance component and heritability estimates
The variance components and heritability estimates are presented in Table 3. Consistent with past studies the feed efficiency traits (Arthur et al. 2001; Robinson and Oddy 2004; Torres-Vázquez et al. 2018; Kelly et al. 2019) and carcass traits (Börner et al. 2013; Torres-Vázquez et al. 2018; Kelly et al. 2019; Duff et al. 2021) were of moderate to high heritability.
|
The three RFI traits (RFI, RFIi, and RFIu) had similar heritabilities at 0.32, 0.30 and 0.31 respectively. These estimates are consistent with those form previous studies, which ranged from 0.18 to 0.50 (Arthur et al. 2001; Robinson and Oddy 2004; Torres-Vázquez et al. 2018; Kelly et al. 2019). The heritabilities for the RFI component traits of DFI, ADG and MMWT were 0.51, 0.32 and 0.65 respectively. These estimates were also consistent with those from the previous studies, apart from MMWT, which was higher in the present study than in most previous studies, except in Kelly et al. (2019), who reported a similar heritability of 0.66.
The heritabilities of the more regularly recorded carcass-related traits (UIMF, CWT, CIMF, CMS, CRUMP and CEMA) were generally higher than in past studies (Reverter et al. 2000; Börner et al. 2013), but more consistent with recent, similar studies (Torres-Vázquez et al. 2018; Kelly et al. 2019; Duff et al. 2021). The exception was CWT, which tended to have a higher heritability from this study at 0.75, although it is regularly reported above 0.60 from other studies.
The heritability estimates for the novel carcass traits of COSS and CTND were 0.35 and 0.36 respectively. Reverter et al. (2003) found lower heritability estimates for CTND at 0.09–0.11. The differences may be explained by the pooled temperate breed data used by Reverter et al. (2003), compared with exclusively Angus animals used in the present study. They may also reflect the genetic change of Angus animals over the 20-year time difference between the studies. A study undertaken by Jeyaruban et al. (2017), which involved a subset of animals used in the present study, predicted a similar CTND heritability of 0.43 and a lower COSS heritability of 0.22. These results confirmed that these traits can be improved through selective breeding and appropriate breeding program design.
Genetic correlations
The genetic correlations among the feed efficiency traits of ADG, MMWT, DFI, RFI, RFIu and RFIi are shown in Table 4. From the present study, all three definitions of RFI (RFI, RFIu and RFIi) could effectively be considered the same trait, with genetic correlations of 0.99. Kelly et al. (2019) also observed high correlations among different definitions of residual energy intake (REI), ranging from 0.89 to 0.99. The lowest correlation of 0.89 was observed by Kelly et al. (2019) when the standard MMWT was interchanged for CWT adjusted for fat. In the present study, ADG and MMWT were kept consistent to observe the impact of adding different measures of IMF to the existing definition of RFI.

|
The genetic correlations between the RFI and the component traits of DFI, ADG and MMWT of 0.80, 0.37 and 0.20 respectively, are consistent with those from the study conducted by Torres-Vázquez et al. (2018). This was expected, given the animals used in the Torres-Vázquez et al. (2018) study were a subset of those used in the present investigation. A study by Arthur et al. (2001), based on younger growing beef animals, found similar correlations between RFI and DFI of 0.69, but different correlation to ADG and MMWT of –0.0.4 and –0.06. The findings in the present study support the suggestion from Torres-Vázquez et al. (2018) that, although RFI is phenotypically independent of ADG and MMWT, it is not independent at the genetic level, particularly on the basis of older, finished animals used in the present study.
The genetic correlations among the carcass traits of CIMF, CMS, UIMF, CTND, COSS, CRUMP, CEMA and CWT are shown in Table 5. Many of the genetic correlations presented should be considered preliminary estimates as they are not significantly different from zero on the basis of their standard errors of estimate. The positive and moderate to strong genetic correlations among the marbling traits of CIMF, CMS and UIMF were consistent with those in Duff et al. (2021), who reported a genetic correlation between CIMF and CMS of 0.96. They also reported similar genetic correlations between UIMF (using the PIE ultrasound scanning system) and CIMF, ranging from 0.59 to 0.64, and between UIMF and CMS, ranging from 0.46 to 0.63.

|
Carcass IMF and CMS had a genetically favourable relationship with CTND (–0.40 and –0.36 respectively). The negative correlation in this instance meaning that breeding candidates selected for higher marbling (e.g. CIMF or CMS) will produce progeny with meat that is more tender. This is consistent with Reverter et al. (2003) who reported a genetic correlation between CTND and CIMF of –0.32 to –0.38.
The genetic correlations between the feed intake and the carcass traits are shown in Table 6.

|
As with previous studies, an antagonistic genetic relationship with meat quality traits such as CIMF has been identified in the present study, with the genetic correlation between RFI and CIMF, and RFI and UIMF of 0.29 and 0.30 respectively. None of the genetic correlations among the three RFI traits and CMS was significantly different from zero. Torres-Vázquez et al. (2018) reported a similar genetic correlation of 0.30 between RFI to CIMF, while Robinson and Oddy (2004) observed a lower, but also an antagonistic, correlation of 0.22 for the same traits.
The redefined RFI trait of RFIu had a similar genetic relationship to CIMF (0.24) and UIMF (0.23). For RFIi, the only significant genetic correlation was with UIMF (0.21). The genetic correlations with CIMF and CMS, while of reduced magnitude, were not statistically different from zero on the basis of their standard errors. This is consistent with Moraes et al. (2017) who redefined RFI to account for back fat thickness and observed a reduction in magnitude of the genetic correlation between RFI and back fat thickness (0.42–0.23).
The genetic correlations of the novel meat quality trait of COSS and the RFI component traits of ADG and DFI were 0.26 and 0.20 respectively; however, the genetic correlation with MMWT was not significantly different from zero. The 0.26 correlation between COSS to ADG, while relatively weak, was unfavourable, indicating that selection for higher growth rates will result in higher ossification score and reduction of meat eating quality.
Hot carcass rump fat (CRUMP) had a negative correlation with MMWT of –0.19, while not significantly different from zero with ADG and DFI. The correlation with MMWT was stronger than the correlation reported by Torres-Vázquez et al. (2018) of –0.03, but closer to the correlation they observed between rib fat and MMWT of –0.23. Most other studies (Robinson and Oddy 2004; Torres-Vázquez et al. 2018; Kelly et al. 2019) have observed a stronger, positive, yet unfavourable, genetic correlation between RFI and subcutaneous fat traits.
For CWT, there was a positive, unfavourable genetic correlation of 0.32 between CWT to RFI. This is consistent with Torres-Vázquez et al. (2018) who found a similar genetic correlation of 0.40. Our study, also consistent with the Torres-Vázquez et al. (2018), showed a strong, positive genetic correlation between CWT and the RFI component traits of ADG, MMWT and DFI of 0.71, 0.82 and 0.75 respectively. The correlations between CEMA and RFI, ADG, MMWT and DFI were not significantly different from zero on the basis of the standard errors.
An issue arising from this study is the number of genetic correlations that are not significantly different from zero on the basis of their large standards errors of estimate, particularly within the carcass traits and between the carcass and feed efficiency traits. This is primarily a function of the number of animals with phenotypes available for analysis being ~4000 for feed efficiency and carcass traits, apart from CTND which was lower at 1151. While this is a large population by industry standards, further phenotyping is planned for the same traits in reference population projects, such as the Angus Sire Benchmarking Program. This will result in more robust genetic correlation estimates for beef cattle in the future.
Phenotypic correlations
The phenotypic correlations are presented in Table 4 among the feed efficiency traits, Table 5 among the carcass traits and Table 6 between the feed efficiency and carcass traits.
The phenotypic correlations among RFI, RFIu and RFIi match the genetic correlations at 0.99 (Table 4). The biological basis for the similarity of the RFI definitions, with more variation in DFI being explained by ADG and MMWT compared with CIMF or UIMF, was suggested by Herd et al. (2004) to be due to the greater variation in efficiency of lean (protein) gain, due to greater variation in protein turnover than in fat gain.
The correlations between all three definitions of RFI and the component traits were as expected; namely, close to zero phenotypic correlation with ADG and MMWT, ranging from 0.01 to 0.02, and a strong positive correlation with DFI at a constant of 0.81. Additionally, as also expected, for RFIu, the phenotypic correlation with UIMF was 0.01, while for RFIi, the phenotypic correlation with CIMF was also 0.01. In comparison, for the standard RFI, the phenotypic correlation was 0.09 with CIMF and 0.06 with UIMF. This is consistent with Kelly et al. (2019) where the REI (similar to RFI) definition was revised to include carcass weight (REIcw); these authors observed the phenotypic correlation with CWT at 0.01 compared with the standard REI and CWT correlation of –0.12.
Selection for feed efficiency and eating quality
The results from the present study, being consistent with previous studies (Arthur et al. 2001; Robinson and Oddy 2004; Torres-Vázquez et al. 2018; Kelly et al. 2019), have highlighted the challenge to breeding programs, with a breeding objective to select for improved feed efficiency, such as lower RFI, and better meat quality, such as higher CIMF and UIMF. The unfavourable, moderate-strength genetic correlations between RFI and the meat quality traits of CIMF and UIMF highlights that single-trait selection for RFI will likely lead to negative outcomes for the meat quality traits, and vice versa, to the overall detriment of the beef supply chain.
The revised definitions of RFI to include either CIMF (RFIi) or UIMF (RFIu) offered a potential solution for breeding programs focussed on improving both feed efficiency and meat quality. However, the results from the present study showed the limitations of using a phenotypic linear regression approach to solve a genetic selection and breeding program design problem. For example, the unfavourable genetic correlation between RFI and CIMF of 0.29 was weakened to 0.17 with RFIi (albeit not being significantly different from zero, according to the standard errors), but the unfavourable genetic correlation persisted, while, in contrast, and as expected, the phenotypic correlation was reduced to 0.01.
A more effective solution for breeding programs may be further understanding the genetic correlations among the traits in the breeding objective and, according to their economic value, optimally weighting the related EBV. Ensuring that the relevant traits are recorded, such as feed intake and carcass IMF or marbling score, for genetic evaluation, is also imperative to this approach.
Conclusions
Residual feed intake (RFI) can be redefined to account for traits, other than ADG and MMWT, that are of value to the beef supply chain, such as IMF and marbling. However, due to limitations of phenotypic linear regression, and only small amounts of variation in DFI being explained by CIMF or UIMF, compared with ADG and MMWT, an alternative approach is warranted. This may involve further understanding the genetic correlations among the traits in the breeding objective and, according to their economic value, optimally weighting the related EBV. Furthermore, the study has also highlighted and confirmed the challenges with selecting for both feed efficiency and meat quality traits in beef breeding programs as they are generally antagonist at the genetic level.
Conflicts of interest
The authors declare that there are no conflicts of interest to disclose that relate to the research described in this paper.
Acknowledgements
The research was supported by Meat and Livestock Australia (MLA) through funding support for feed intake data collection (B.SBP.0089) and through MLA Donor Co. matching funds in project PSH.0528. Generous support has also been provided by numerous Angus bull breeders, co-operator herds, supply chain partners, technicians and research organisations. Nick Butcher and Bob Dent are also gratefully acknowledged for their dedicated work
References
Archer JA, Richardson EC, Herd RM, Arthur PF (1999) Potential for selection to improve efficiency of feed use in beef cattle: a review. Crop and Pasture Science 50, 147–162.| Potential for selection to improve efficiency of feed use in beef cattle: a review.Crossref | GoogleScholarGoogle Scholar |
Arthur PF, Archer JA, Johnston DJ, Herd RM, Richardson EC, Parnell PF (2001) Genetic and phenotypic variance and covariance components for feed intake, feed efficiency, and other postweaning traits in Angus cattle. Journal of Animal Science 79, 2805–2811.
| Genetic and phenotypic variance and covariance components for feed intake, feed efficiency, and other postweaning traits in Angus cattle.Crossref | GoogleScholarGoogle Scholar | 11768108PubMed |
AUS-MEAT (2020) ‘Handbook of Australian Beef Processing. Version 7.’ (AUS-MEAT: Murarrie, Qld, Australia) Available at https://www.ausmeat.com.au/WebDocuments/Producer_HAP_Beef_Small.pdf [Verified 27 February 2021]
Basarab JA, Colazo MG, Ambrose DJ, Novak S, McCartney D, Baron VS (2011) Residual feed intake adjusted for backfat thickness and feeding frequency is independent of fertility in beef heifers Canadian Journal of Animal Science 91, 573–584.
| Residual feed intake adjusted for backfat thickness and feeding frequency is independent of fertility in beef heifersCrossref | GoogleScholarGoogle Scholar |
Börner V, Johnston DJ, Graser HU (2013) Genetic relationships between live animal scan traits and carcass traits of Australian Angus bulls and heifers. Animal Production Science 53, 1075–1082.
| Genetic relationships between live animal scan traits and carcass traits of Australian Angus bulls and heifers.Crossref | GoogleScholarGoogle Scholar |
Duff CJ, van der Werf JHJ, Parnell PF, Clark SA (2021) Comparison of two live-animal ultrasound systems for genetic evaluation of carcass traits in Angus cattle. Translational Animal Science 5,
| Comparison of two live-animal ultrasound systems for genetic evaluation of carcass traits in Angus cattle.Crossref | GoogleScholarGoogle Scholar | 33748681PubMed |
Gilmour AR, Gogel BJ, Cullis BR, Thompson R (2009) ‘ASReml user guide release 3.0.’ (VSN International: Hemel Hempstead, UK)
Herd RM, Oddy VH, Richardson EC (2004) Biological basis for variation in residual feed intake in beef cattle. 1. Review of potential mechanisms. Australian Journal of Experimental Agriculture 44, 423–430.
| Biological basis for variation in residual feed intake in beef cattle. 1. Review of potential mechanisms.Crossref | GoogleScholarGoogle Scholar |
Jeyaruban MG, Johnston DJ, Walmsley BJ (2017) Genetic and phenotypic characterization of MSA Index and its association with carcass and meat quality traits in Angus and Brahman cattle. Proceedings of the Association for the Advancement of Animal Breeding and Genetics 22, 313–316.
Kelly DN, Murphy C, Sleator RD, Judge MM, Conroy SB, Berry DP (2019) Feed efficiency and carcass metrics in growing cattle 1. Journal of Animal Science 97, 4405–4417.
| Feed efficiency and carcass metrics in growing cattle 1.Crossref | GoogleScholarGoogle Scholar | 31593986PubMed |
Meat and Livestock Australia (2020) Consumer sentiment research: Australian perceptions about the red meat industry. Available at https://www.mla.com.au/marketing-beef-and-lamb/consumer-sentiment-research/ [Verified 27 February 2021]
Moraes GFD, Abreu LRA, Ferreira IC, Pereira IG (2017) Genetic analysis of residual feed intake adjusted for fat and carcass and performance traits in a Nellore herd. Ciência Rural 47, 20151505
| Genetic analysis of residual feed intake adjusted for fat and carcass and performance traits in a Nellore herd.Crossref | GoogleScholarGoogle Scholar |
Parnell PF, Duff CJ, Byrne AI, Butcher NM (2019) The Angus Sire Benchmarking Program: a major contributor to future genetic improvement in the Australian beef industry. Proceedings of the Association for the Advancement of Animal Breeding and Genetics 23, 492–495.
Perry D, Shorthose WR, Ferguson DM, Thompson JM (2001) Methods used in the CRC program for the determination of carcass yield and beef quality. Australian Journal of Experimental Agriculture 41, 953–957.
| Methods used in the CRC program for the determination of carcass yield and beef quality.Crossref | GoogleScholarGoogle Scholar |
Polkinghorne R, Thompson JM, Watson R, Gee A, Porter M (2008) Evolution of the Meat Standards Australia (MSA) beef grading system. Australian Journal of Experimental Agriculture 48, 1351–1359.
| Evolution of the Meat Standards Australia (MSA) beef grading system.Crossref | GoogleScholarGoogle Scholar |
Reverter A, Johnston DJ, Graser HU, Wolcott ML, Upton WH (2000) Genetic analyses of live-animal ultrasound and abattoir carcass traits in Australian Angus and Hereford cattle. Journal of Animal Science 78, 1786–1795.
| Genetic analyses of live-animal ultrasound and abattoir carcass traits in Australian Angus and Hereford cattle.Crossref | GoogleScholarGoogle Scholar | 10907820PubMed |
Reverter A, Johnston DJ, Ferguson DM, Perry D, Goddard ME, Burrow HM, Oddy VH, Thompson JM, Bindon BM (2003) Genetic and phenotypic characterisation of animal, carcass, and meat quality traits from temperate and tropically adapted beef breeds. 4. Correlations among animal, carcass, and meat quality traits. Australian Journal of Agricultural Research 54, 149–158.
| Genetic and phenotypic characterisation of animal, carcass, and meat quality traits from temperate and tropically adapted beef breeds. 4. Correlations among animal, carcass, and meat quality traits.Crossref | GoogleScholarGoogle Scholar |
Robinson DL, Oddy VH (2004) Genetic parameters for feed efficiency, fatness, muscle area and feeding behaviour of feedlot finished beef cattle. Livestock Production Science 90, 255–270.
| Genetic parameters for feed efficiency, fatness, muscle area and feeding behaviour of feedlot finished beef cattle.Crossref | GoogleScholarGoogle Scholar |
Torres-Vázquez JA, van der Werf JHJ, Clark SA (2018) Genetic and phenotypic associations of feed efficiency with growth and carcass traits in Australian Angus cattle.1. Journal of Animal Science 96, 4521–4531.
| Genetic and phenotypic associations of feed efficiency with growth and carcass traits in Australian Angus cattle.1.Crossref | GoogleScholarGoogle Scholar | 30124864PubMed |
Upton WH, Donoghue KA, Graser HU, Johnston DJ (1999) Ultrasound proficiency testing. Proceedings of the Association for the Advancement of Animal Breeding and Genetics 13, 341–344.