

The pattern of breeding and management within the New Zealand Thoroughbred breeding industry 2005–2015. (II) The mare population
Y. Y. Chin A * , C. W. Rogers B C , E. K. Gee B , K. J. Stafford C and E. Z. Cameron A
A School of Biological Science, University of Canterbury, Private Bag 4800, Christchurch 8041, New Zealand.
B School of Veterinary Science, Massey University, Private Bag 11-222, Palmerston North 4474, New Zealand.
C School of Agriculture and Environment, Massey University, Private Bag 11-222, Palmerston North 4474, New Zealand.
Handling Editor: Wayne Bryden
Abstract
The New Zealand Thoroughbred breeding industry is heavily focused on producing horses for the export market and there has been a reduction in the number of horses racing in the past 20 years. The impact of these production constraints, and changes in production focus, have not been described at a national herd level.
To describe the breeding management, reproductive performance, and careers of the New Zealand Thoroughbred broodmare herd during the 2005/06–2015/16 breeding seasons.
The demographics, population structure, reproductive efficiency, breeding management and career descriptors of Thoroughbred mares were examined using descriptive analysis. Gestation length was modelled using a linear mixed effects model. The impact of different variables on breeding career were quantified by calculating odds ratio.
There was a consistent reduction in the size of the national broodmare herd over the 10 years investigated. Half of the mares not retained for breeding were mares that were breed to low-cost stallions. Despite a short (∼100 days) commercial breeding season few (20%) mares were mated early in the season (September), with most mating (70%) occurring between October and November. The 27 days mean foaling to conception interval (FCI) suggests that FCI was artificially shortened and most pregnancy was achieved within first oestrus cycle post-partum. Mare career length and lifetime productivity was positively associated with the stud fee of the first stallion that the mare was mated to and number of foals registered for racing.
Mare replacement and loss within the national herd was disproportionately associated with mares that were producing foals for a contracting domestic racing market. There was a constricted breeding season with most mares being mated within the first oestrous cycle post-partum. Mare retention and breeding success were positively associated with the service fee of the sire and progeny that had raced, reflecting the commercial pressure of the industry on mare management.
The changes in the broodmare herd and management reflects the increasing proportion of the industry focusing on breeding foals that will appeal to the export market. The economic drivers for early born foals provide management challenges as these are not aligned with the optimal reproductive season of the horse.
Keywords: agribusiness, animal production, breeding, economics, equine, farm management, horses, population dynamics.
Introduction
A large proportion of the New Zealand Thoroughbred breeding industry has a commercial focus on breeding horses for the export market. Each year, approximately 40% of the foal crop will be exported, either as yearlings, or to a lesser extent, as racehorses (Fenessey 2010; Waldron et al. 2011). The majority of Thoroughbreds are marketed as yearlings, at the annual yearling sales in February, and a smaller proportion are sold as 2-year-olds. Traditionally the export market was supplied with the progeny by stallions with higher stud fees, whereas the domestic market was predominantly supplied by the progeny of the low-cost stallions (Rogers and Gee 2011). In the past few decades, there has been a reduction in the domestic racing population and an associated consolidation of the New Zealand breeding herd, believed to be due to a reduction of the breeding population supplying the domestic market (Rogers et al. 2009; Legg et al. 2021).
In the southern hemisphere, the official breeding season begins on 1 September and the official birthdate for all Thoroughbreds is 1 August (https://loveracing.nz/stud-book/information-centre). Thus, when yearlings are marketed at the annual yearling sales series (in February), there will be some age variation (13–17-month olds), with a financial premium for yearlings that were early born foals (born August–September and, hence, 16–17 months old at the time of the sales; Waldron et al. 2011). These older yearlings appear physically better developed and are perceived to have a greater chance of entering race training and racing as a 2-year-old, which has been associated with greater racing career success and longevity (Tanner et al. 2013; Velie et al. 2013; Huntington et al. 2020; Rogers et al. 2020).
The sale of yearlings at auction represents a major revenue stream for Thoroughbred breeders. To optimise auction sales price, and thus revenue, yearlings by higher service fee-category stallions and from mares with a successful racing career, and, if possible, successful progeny performance, are necessary (Vickner and Koch 2001; Stowe and Ajello 2010; Stowe 2013). There is an increase in auction sales price associated with physically mature yearlings, those born earlier in the season and older at the time of sale (Waldron et al. 2011). Thus, breeders will aim to breed mares as close to 1 September as possible, so as to increase the chance of a foal born early in the season.
Mares are seasonal long-daylength breeders, and this results in the peak number of mares cycling between late spring and summer (November–March in the southern hemisphere; Osborne 1966). The probable evolutionary programming of this is to ensure that foaling coincides with peak pasture availability and conditions that favour offspring survival (Ransom et al. 2013). However, the commercial breeding season starts on 1 September and effectively finishes in December, resulting in disparity between the ideal commercial breeding season and what is the optimal breeding season on the basis of biology. This disparity, in association with the restriction to natural service, requires careful management of the mare population during the breeding season.
Greatest productivity and profit can be gained by a mare having a foal each year. Data based on mares in Kentucky indicated that a mare must produce six foals within seven seasons to be profitable (Bosh et al. 2009). However, as a long-daylength breeder with a long gestation length of approximately 342 days, there is ‘breeding drift’ as the mare foals and then, subsequently, conceives later in each subsequent breeding season. To avoid breeding drift, the mare must conceive within a 25-day period post-partum (Gee et al. 2017). Inability to have the mare conceive within this short post-partum period will, over several seasons, result in multiparous mares foaling and breeding too late in the season, and they will often require a season when not mated to be able to be bred early in the subsequent season.
The selection, management and reproductive performance of mares are therefore important and are influenced by both commercial pressure and mare biology. At present, this has not been investigated longitudinally at an industry level. The aim of this study was to investigate and describe the breeding management, reproductive performance, and reproductive career of Thoroughbred mares during 2005/06–2015/16 seasons.
Materials and methods
Data collection
The data collection method is described in detail in a companion paper (Chin et al. 2022). Briefly, breeding records of all Thoroughbred stallions covering >10 mares in the 2005/06–2015/16 breeding seasons were extracted, and the mares they covered were identified. The lifetime breeding records of all these mares covered by these stallions were extracted from the New Zealand Thoroughbred racing website (https://loveracing.nz/stud-book/search.aspx) by using a customised R script. The two datasets were then combined to generate a database of stallion- and mare-centric information. Information available from the full database that was used in this analysis included season, sire mated to, stallion’s advertised stud fee, sire geographic location, mare year of birth, breeding outcome, foaling date, last service date (conception date), and foal sex. Stallions were categorised for each season on the basis of their advertised stud fee and resident country into low (<NZ$5000), medium (NZ$5001–10 000), high (>NZ$10 000) and shuttle (stallions transported between northern and southern hemispheres to breed two seasons in one calendar year) categories.
On the basis of the data obtained, the following derived categories and measures were obtained:
Mare parity = number of foals born.
Mare age = year − mare year of birth.
Mare age to stud = year to stud − mare year of birth.
Mare age at end of reproductive career in New Zealand = year ceased breeding − mare year of birth. The end of reproductive career of mare was when a mare was deregistered from NZTR stud book, a mare was deceased, or had no reproduction record for two consecutive years or more.
Status at conception – foaled mares were mares that had foaled in the current season (lactating mares with foal at foot). Maiden mares were mares first presented for breeding. Empty mares were mares that had not foaled due to pregnancy loss or were not served in the previous season.
Gestation length = days between conception date and subsequent foaling date.
Start of mating to conception interval = number of days from date of foaling to the date of subsequent conception (lactating mares), or for maiden and empty mares was the number of days from 1 September (official start of breeding season) to the date of conception.
Number of years active = year ceased breeding − year to stud.
Number of seasons mated throughout breeding career.
Total number of foals produced throughout breeding career.
Number of years not served throughout breeding career.
Number of consecutive years mated before first breeding rest.
Only mares that had the end of reproductive career recorded on or before the end of observation period of this study (n =11 662) were used to calculate number of years active, number of times mated to a stallion, total number of foals born, and number of years not served. Number of consecutive years mated before the first breeding rest were calculated for mares that started breeding between 2005 and 2010. Calculations for mare reproductive-efficiency measures are provided in Table 1.
| Mare reproductive-efficiency measure (%) | Calculations | |
|---|---|---|
| End of season pregnancy rate | (Conceived/covered) × 100 | |
| Conceived = all observations − not served – missed − no outcome | ||
| Covered = all observations − not served − no outcome | ||
| Foaling rate | Live foal/total number mated | |
| Total number mated = all observations − not served − no outcome – exported − no return | ||
| Mortality rate | (Dead foals/live foals) × 100 |
Observation where mare was exported in-foal and no return were excluded in foaling rate calculations because there was no further knowledge of the mating outcome, other than that mating and conception had occurred.
Statistical analyses
Data visualisation and descriptive analyses were used to examine the data, check for errors, and examine the distribution of the data. The normality of the data was examined using histogram, qqplot and by examining means and medians as normality tests are recommended for sample sizes of smaller than 50 and significant test of skewness and kurtosis are not recommended for large datasets (>200; Ghasemi and Zahediasl 2012). Differences among groups with parametric data were examined using a one-way ANOVA and pairwise comparisons were tested using a Tukey’s post hoc test. Differences among groups with non-parametric data were tested using Mood’s median test and pairwise median test. Median time (days) to conception from 1 September in empty mares were obtained using Kaplan Meier survival analysis for each region (Upper North Island, Lower North Island, South Island). Differences among regions were tested using the log-rank test.
A linear fixed-effects model was constructed to identify significant predictors for gestation length in mares. The variables included in the model-building process were year, region, month of conception, foal sex, reproductive status at conception and mare age. Mare-level variables and the association with the binomial outcome of mares being not served in a season and mares being retired from breeding were investigated using generalised linear model. The mare-level variables investigated are presented in Supplementary Table S1. The outcome of mares being not served in a season was modelled separately for empty mares (non-lactating mares) and foaled mares (lactating mares) so that variables exclusive to foaled mares can be investigated. For all models, univariate analysis was conducted. Significance of each variable was obtained using Wald’s test. Significant variables identified in the univariate analysis were then added into the model in a forward, stepwise approach. For each new significant variable being retained in the model, model fit was compared between the new model and the previous model.
All data manipulation and analysis were conducted in Rstudio (R Core Team 2017).
Results
Mare population
There was a total of 16 066 mares and 67 962 breeding records in this dataset (2005/06–2015/16 breeding seasons). For each season investigated, there were 6703 ± 699 registered mares, and 905 ± 145 (14.3 ± 1.58%) mares that were not bred. At a population level, the total number of mares bred, proportion of mares bred to different sire price categories in each season and the reduction in the national broodmare herd have been previously reported in the companion paper (Chin et al. 2022).
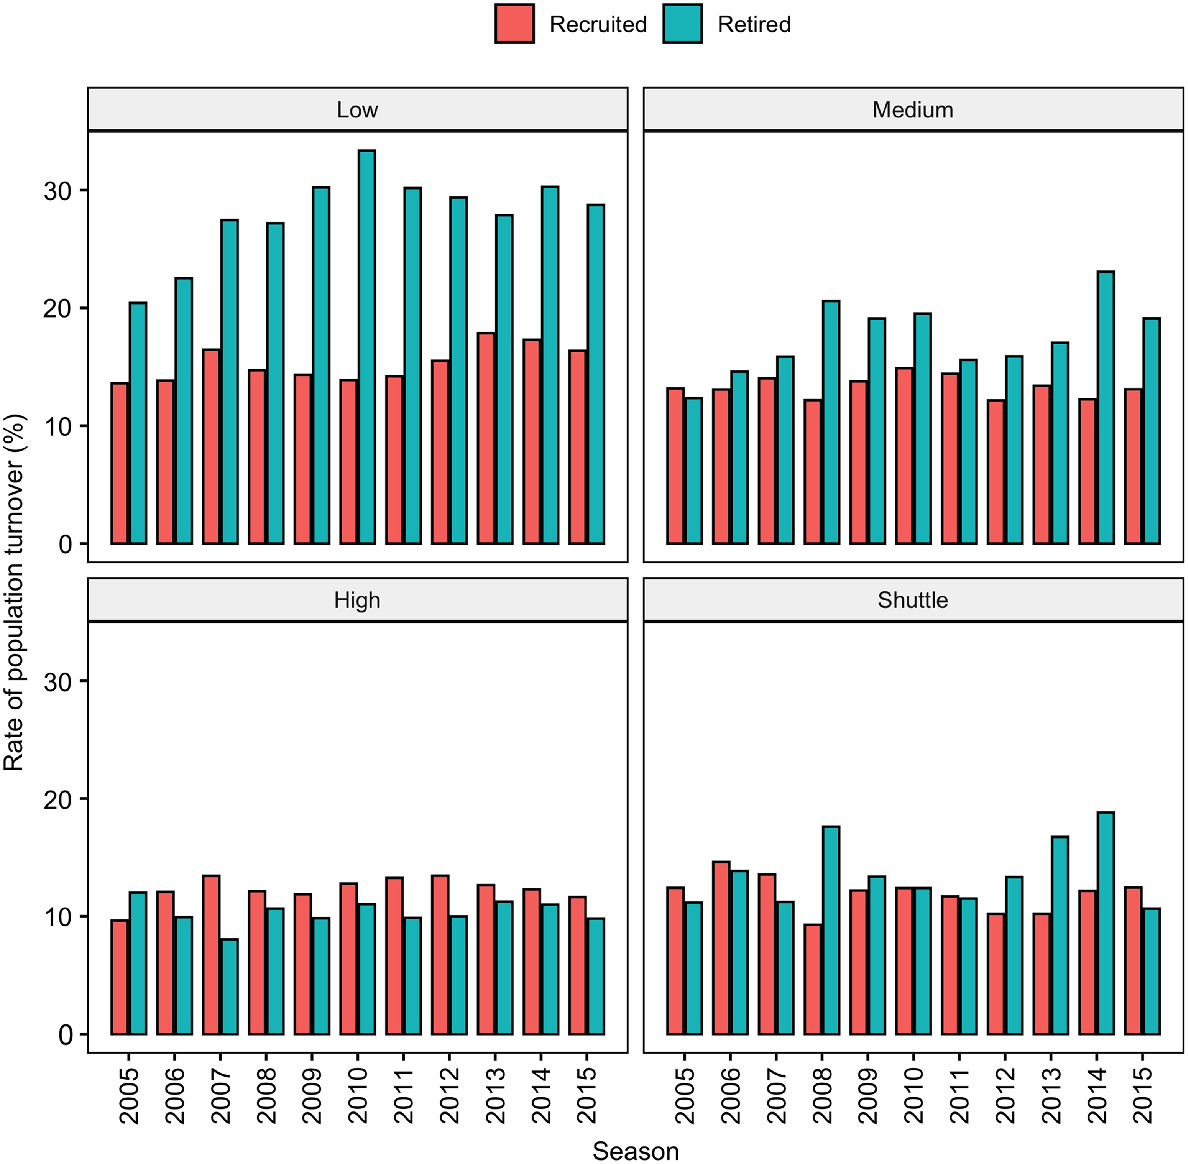
There was a consistent contraction within the national breeding herd, with annual mare replacements being fewer than the number of mares that ceased breeding (recruited/new mares 16 ± 1% vs 20 ± 2% ceased breeding). Annually 28 ± 4% of the mares bred to a low-priced stallion ceased breeding, with only 15 ± 2% of the mare population in this group being new mares entering the breeding herd. This imbalance resulted in a reduction of the proportion of the national herd mated to lower-cost stallions and this cohort accounted for approximately 50% of all the mares that ceased breeding within a given season (Fig. 1).
The percentage of maiden Thoroughbred mares started a breeding career and the proportion of Thoroughbred mares that ended her reproductive career in New Zealand categorised according to the stallion stud-fee category she was mated to [low (<NZ$5000), medium (NZ$5001–10 000), high (>NZ$10 000) and shuttle (stallions transported between northern and southern hemisphere to breed two seasons in one calendar year)].
There was little variation in the mean ± s.d. of the percentage of empty (non-pregnant), maiden (never previously mated), and foaled mares (lactating mares with foal at foot) between the seasons examined (32.2 ± 0.10%, 13.2 ± 0.64%, and 54.5 ± 0.85% respectively). The mean age of the breeding mare population was 10 ± 4 years. The mean age of foaling, empty and maiden mares was 10 ± 4, 11 ± 4 and 5 ± 2 years (P < 0.05) and remained consistent across the years examined (Table 2).
| Parameter | Foaled | Empty | Maiden | Total | |
|---|---|---|---|---|---|
| n | 3782 ± 368 | 1939 ± 240 | 866 ± 125 | 6703 ± 699 | |
| Mean age (years) | 10.2 ± 3.8 | 11.9 ± 4 | 5.6 ± 1.9 | 10 ± 4.1 | |
| Mean last service date | 10 November ± 27.2a | 27 October ± 32.3b | 25 October ± 30.2b | 4 November ± 30.4 | |
| Mean foaling date | 18 October ± 26.9a | 8 October ± 27.9b | 7 October ± 27.9c | 13 October ± 27.8 |
Results are presented as means ± s.d. Different letters within the same row indicate statistical significance (P < 0.05).
Breeding season
Most (99%) of the matings occurred between 1 September and 31 December and 90% of the conception dates (last date of service) were recorded as occurring by the first week of December (Supplementary Fig. S1). The median conception date (days from 1 September) for empty mares in the Upper North Island was 48 (48–49 95% CI) days, 53 (52–54 95% CI) days for Lower North Island and 68 (66–70 95% CI) days in the South Island (P < 0.05).
The mean last service date for the population was 4 November ± 30.4 days. The mean last service dates of empty and maiden mares were significantly earlier than those of foaled mares (P < 0.05; Table 2). The mean foaling date of the population was 13 October ± 27.8 days; with the addition of a foal heat period (∼12 days), many foaling mares would not return to the first fertile oestrus until 30 October ± 26.9, and this was reflected in the distribution of the last service date recorded for these mares (Table 2). For all mare classes, the mean foaling dates in 2015 were 7 days earlier than they were in 2005. The differences across years were significant for empty (P < 0.001) and foaled (P < 0.05) mares but not for maiden mares (P = 0.063). The last service dates in 2015 were 7 days earlier in empty (P < 0.001) and foaled (P < 0.05) mares, and 5 days earlier in maiden mares. The difference across years in maiden mares was not significant (P = 0.122).
Start of mating to conception interval
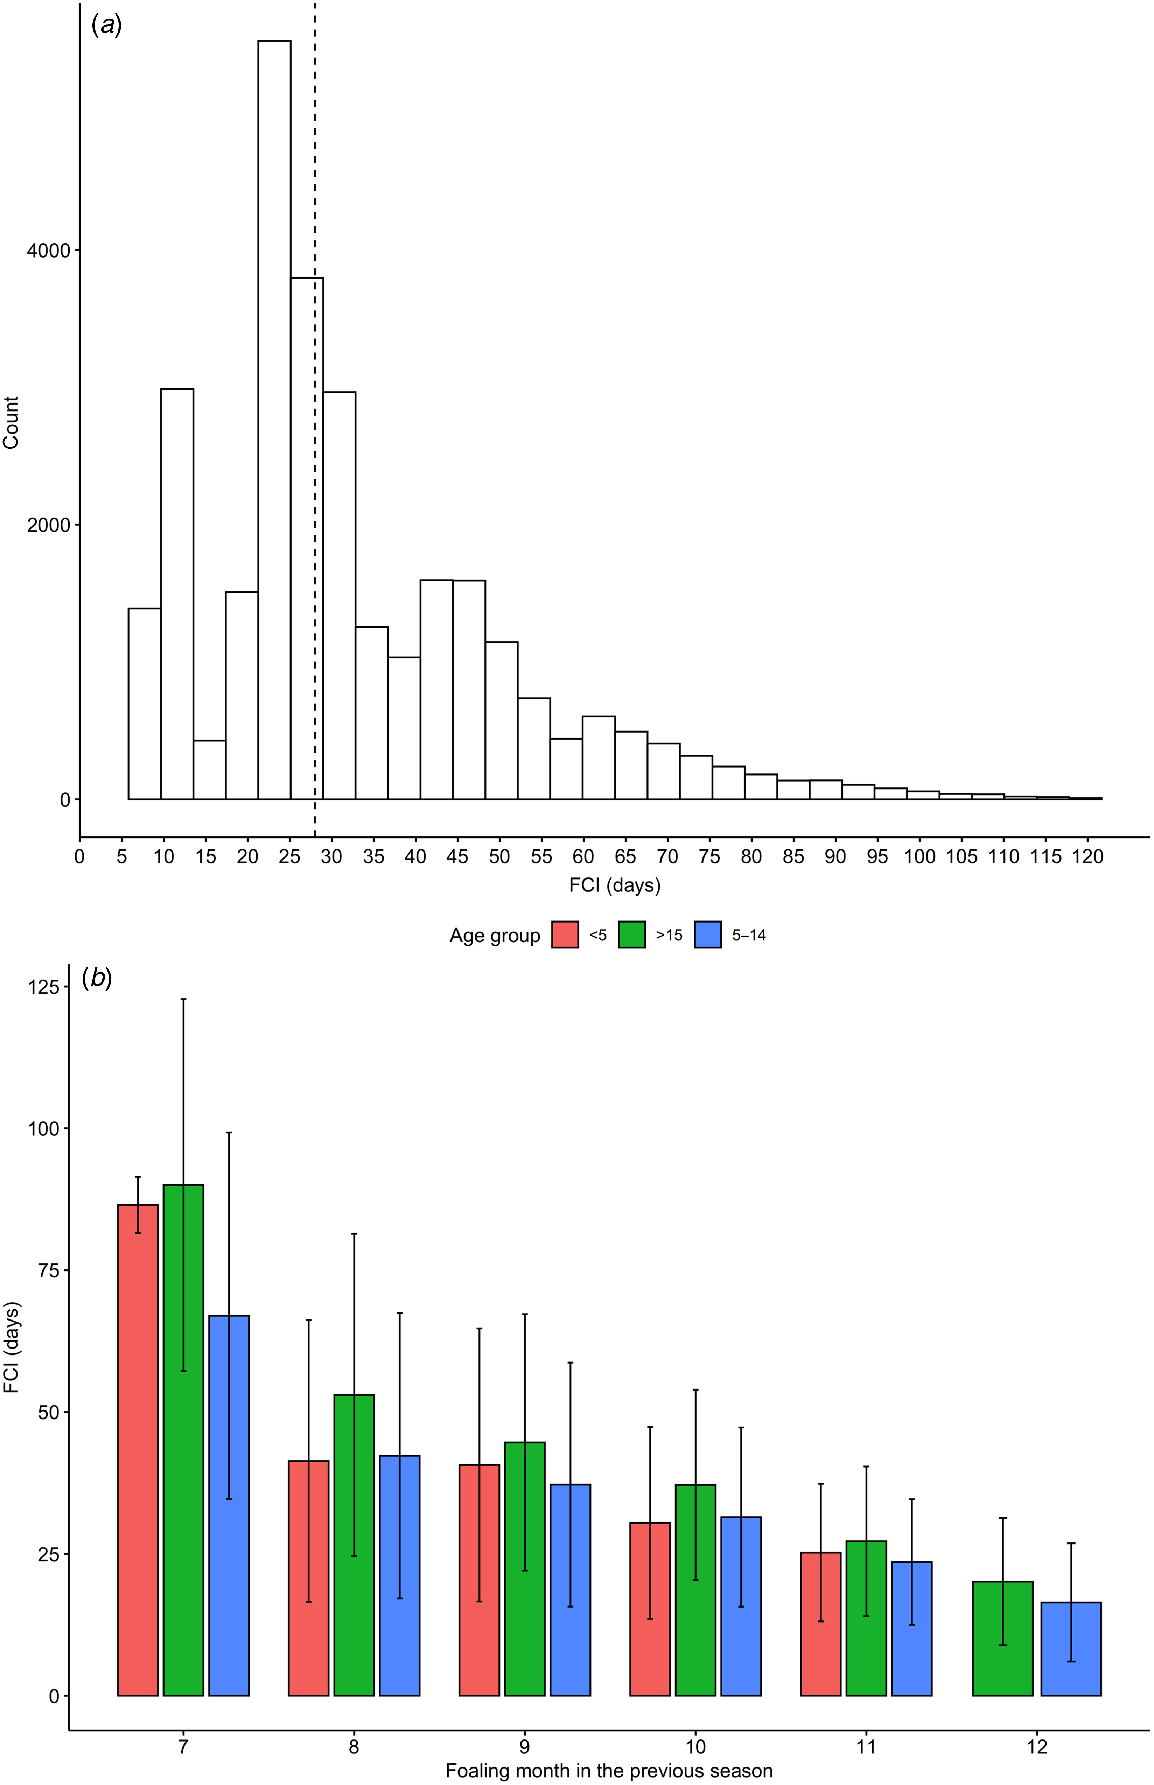
The foaling to conception interval (FCI) distribution had clustering at ~10 days (15%, consistent with post-partum oestrous or ‘foal heat’), between 20–35 days (51%, consistent with second oestrous cycle), and at 40–50 days (34%, consistent with third oestrous cycle), with most mares conceiving at 20–30 days post-partum (Fig. 2a). The distribution of the FCI was consistent across seasons, with a median of 27–28 days. The foaling to conception interval decreased with each increase in the month of foaling (Fig 2b). Older mares (>14 years old) had longer FCI than did the base population (P < 0.05; Table S2). For maiden and empty mares, the interval between foaling and conception cannot be calculated; thus, the time between breeding season start (1 September) and conception was calculated instead, which increased with mare age (P < 0.05; Table S2).
Gestation length
The mean gestation length of mares was 349.9 ± 11.15 days and was longer for colt (male) foals (351 ± 11.4) than for filly (female) foals (349 ± 10.7; P < 0.05; Table 3). Mares in the lower North Island had significantly longer gestation than did mares from the rest of the country. Gestation length decreased with the month of conception from September to December (P < 0.05), for both colts and fillies, and was shorter in mares suckling a foal at the time of mating, than in empty and maiden mares (Table 3). Multiparous mares older than 14 years had a longer gestation length than did mares less than 14 years of age (Table 3).
| Variable | Category | Coefficient (s.e.) | P-value | |
|---|---|---|---|---|
| RegionA | Upper North Island | Ref | ||
| Lower North Island | 1.94 (0.14) | *** | ||
| South Island | 0.61 (0.18) | *** | ||
| Month of conception | September | Ref | ||
| October | 0.11 (0.15) | n.s. | ||
| November | −2.70 (0.15) | *** | ||
| December | −7.27 (0.19) | *** | ||
| Foal sex | Filly | Ref | ||
| Colt | 2.70 (0.10) | *** | ||
| Status at conception | Empty | Ref | ||
| Foaled | −6.20 (0.12) | *** | ||
| Maiden | −1.58 (0.19) | *** | ||
| Mare age | ≤5 | Ref | ||
| ≥6–≤13 | 2.10 (0.18) | *** | ||
| ≥14 | 3.76 (0.23) | *** |
Coefficients represent number of days.
ARegion in upper North Island (Northland, Auckland, Waikato), lower North Island (Taranaki, Manawatu, Hawke’s Bay, Wairarapa, Wellington), South Island (Canterbury, Southland).
***P < 0.001.
Career pattern
Mares remained in the breeding herd for a median of 8 years (IQR 4–11; Table 4) and ceased breeding at a median age of 13 years (IQR 9–16). During their reproductive career, mares were mated a median of six times (IQR 4–10), produced four live foals (IQR 2–7), and were not bred for a median of 1 year (IQR 0–2; Table 4). Mares remained in the breeding herd for longer, were bred more often and had more foals, if mated to the higher-priced stallions in their first year of breeding (Table 4). This greater lifetime reproductive efficiency was due to 50% of the mares in this high price stallion category being presented to a stallion every season.
| Stud fee of first stallion mated to | Low-priced | Medium-priced | High-priced | Shuttle | Total | |
|---|---|---|---|---|---|---|
| Number of years active | 7 (4–11)a | 7 (4–11)b | 8 (5–12)c | 9 (6–13)d | 8 (4–11) | |
| Number of years served | 5 (3–8)a | 6 (3–9)b | 7 (5–11)c | 8 (5–11)d | 6 (4–10) | |
| Parity | 3 (2–6)a | 4 (2–7)b | 5 (3–7)c | 6 (3–8)d | 4 (2–7) | |
| Number of years not served | 1 (0–2)a | 1 (0–2)b | 0 (0–1)c | 1 (0–1)d | 1 (0–2) | |
| First year of breeding to first breeding rest | 2 (1–4)a | 3 (1–5)b | 4 (2–6)c | 3 (2–5)d | 3 (1–5) | |
| Percentage of mares retired after first breeding rest | 25.7 ± 8.9%a | 18.4 ± 8.86%ab | 11.9 ± 11.5%b | 15.9 ± 9.4%b | 17.6 ± 6.7% |
Different letters within the same row indicate statistical significance (P < 0.05).
Mares were mated for a median of three consecutive seasons (IQR 1–5) before the first breeding rest (season when not mated by a stallion; Table 4). The median length of breeding rest was 1 year (IQR 1–1) and this was not associated with the price category of the first stallion the mare was mated to. Of the mares that were not mated in a given season, 17.6 ± 6.7% failed to return to breeding in subsequent years (Table 4).
There was a progressive increase in odds of an empty mare not being bred, as the price category of the last sire the mare was bred to decreased (Table 5). Mare age appeared to be protective, with older empty mares having lower odds of not being mated in the multivariable model (Table 5). The same progressive increase in odds of a mare not being bred was observed in foaled mares, as the price category of the last sire that the mare was bred to decreased (Table 5). The greatest odds of not being bred were associated with a mare foaling in December (31.7, 95% CI 24.6–41.4). In contrast to the finding with empty mares, mare age appeared to have no association with the decision to not mate a mare when mares had foaled (Table 5).
| Variable | Category | Coefficient (s.e.) | Odds ratio (95% CI) | P-value | |
|---|---|---|---|---|---|
| Empty mares | |||||
| Stud fee category of sire in the previous season | High | Ref | 1.00 | ||
| Shuttle | 0.499 (0.111) | 1.65 (1.33–2.04) | *** | ||
| Medium | 0.992 (0.093) | 2.70 (2.25–3.24) | *** | ||
| Low | 1.340 (0.086) | 3.93 (3.33–4.67) | *** | ||
| Mare age | ≤12 | Ref | |||
| ≥13 | −0.215 (0.0513) | 0.81 (0.73–0.89) | *** | ||
| Foaled mares | |||||
| Stud fee category of sire in the previous season | High | Ref | 1.00 | ||
| Shuttle | 0.351 (0.053) | 1.42 (1.28–1.57) | *** | ||
| Medium | 0.513 (0.046) | 1.67 (1.53–1.83) | *** | ||
| Low | 1.06 (0.042) | 2.89 (2.66–3.14) | *** | ||
| Month of foaling in the previous season | August | Ref | 1.00 | ||
| September | 0.601 (0.102) | 1.82 (1.50–2.24) | *** | ||
| October | 1.151 (0.098) | 3.16 (2.62–3.85) | *** | ||
| November | 2.017 (0.098) | 7.51 (6.23–9.15) | *** | ||
| December | 3.458 (0.130) | 31.74 (24.65–41.14) | *** | ||
| Mare age | ≤12 | Ref | |||
| ≥13 | 0.087(0.033) | 1.09 (1.02–1.16) | n.s. | ||
***P < 0.001.
In the ‘retirement from breeding’ multivariable model (Table 6), increasing odds were observed with an increasing mare age and a decreasing sire service fee category. Reproductive capability (number of pregnancy losses) was mildly associated with increased odds, but the primary drivers for retirement decision-making based on odds ratios appear to be associated with measures of commercial or racetrack success, namely the number of named foals (named and thus likely to have had at least a race start).
| Variable | Category | Coefficient (s.e.) | Odds ratio (95% CI) | P-value | |
|---|---|---|---|---|---|
| Mare age | ≤12 | Ref | 1 | ||
| ≥13 | 1.061 (0.0567) | 2.89 (2.58–3.22) | *** | ||
| Stud fee category of last sire mated to | High | Ref | |||
| Shuttle | 0.552 (0.053) | 1.74 (1.56–1.93) | *** | ||
| Medium | 0.866 (0.046) | 2.38 (2.17–2.60) | *** | ||
| Low | 1.437 (0.042) | 4.17 (3.84–4.53) | *** | ||
| Number of pregnancy loss | 0.148 (0.010) | 1.16 (1.14–1.18) | *** | ||
| Number of named foals | ≤2 | Ref | |||
| 3–4 | −0.298 (0.041) | 0.74 (0.68–0.80) | *** | ||
| ≥5 | −0.448 (0.112) | 0.64 (0.51–0.79) | *** | ||
| Mare age × number of registered foal | ≥13:(3–4) | −0.063 (0.073) | 0.94 (0.81–1.08) | n.s. | |
| ≥13:(≥5) | −0.122 (0.127) | 1.13 (0.87–1.46) | n.s. |
***P < 0.001.
Reproductive efficiency
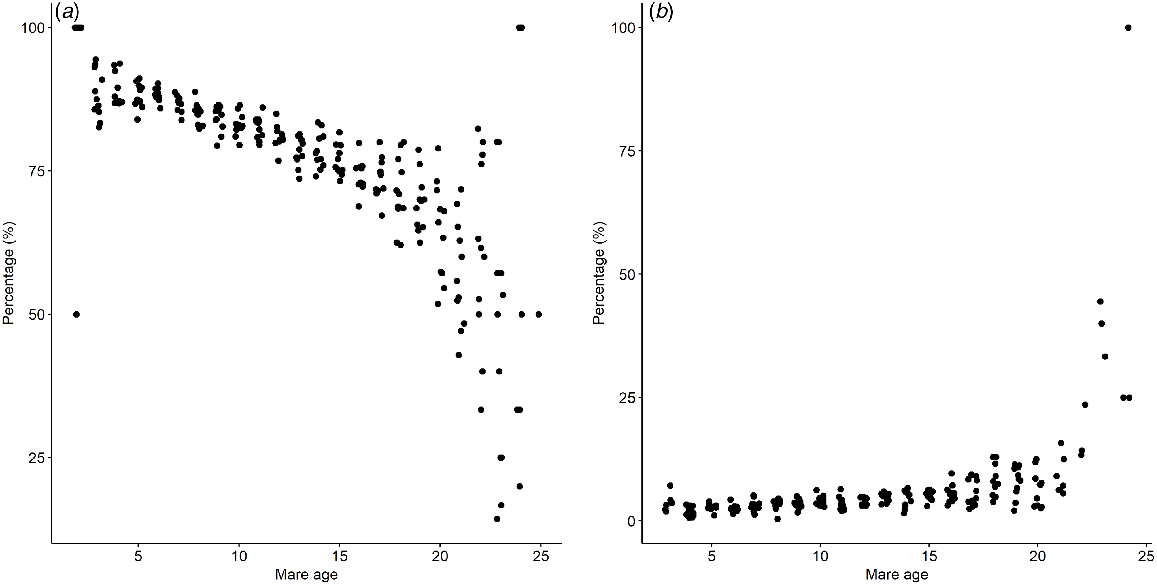
The mean end of season pregnancy rate was 83.5% ± 0.76%, mean foaling rate was 79.1% ± 1.04%, pregnancy losses after 43 days of gestation were 3.7% ± 0.24, mean foal mortality rate was 9.3 ± 1.02%, the mean foaling drift was 19 ± 20.8 days/season. The percentage of mares recorded as pregnant at 42 days decreased linearly with mare age up to 14 years old and decreased rapidly after the age of 14 years old (Fig. 3a). The rate of pregnancy loss after 42 days of pregnancy remained consistent for mares up to 15 years old, and, after this age, started to increase exponentially after 20 years old. (Fig. 3b).
Discussion
There has been a reduction in the Thoroughbred mare population in New Zealand that is consistent with changes in other major Thoroughbred racing and breeding jurisdictions (e.g. Australia, UK, Ireland, Japan, USA) and the reduction in total number of mares bred globally (IFHA 2010, 2015). Data reported here supported the hypothesis that the New Zealand breeding industry operates with two distinct populations, a domestic market (bred to race, or sell as a race trial winner (2 or 3-year-olds)) and a population breeding to sell as yearlings at auction, predominantly for the export market. Traditionally the domestic market was supplied with foals produced by low to moderate stud-fee stallions and the export market was predominately supplied by higher-priced stallions (Rogers and Gee 2011). The domestic market has seen a significant contraction as reflected by the observation that 50% of the reduction in the breeding herd was due to the reduction in the number of mares mated to low priced stallions and that 87% of the reduction in stallions were due to losses from the low-priced stud-fee category (Chin et al. 2022). The lack of increase in the number of mares mated to each of the stallions in the lower price category provided further support that there was a broad industry shift away from production within this category. The odds ratios calculated in the multivariate models clearly demonstrated this negative industry bias to low-cost sires (and by default lower-value mares mated to these sires), with the greater odds of a break in breeding, and retirement from breeding being observed in the mares previously mated to low-cost sires. Consistent with the increased industry focus on breeding foals to be sold as yearlings (providing pressure to produce early born foals) was an increasingly earlier foaling date and last service date.
During the 10-year observation period, there was a 2% per year reduction in the number of horses racing domestically (Legg et al. 2021), yet the associated reduction in the national breeding herd, and in the mares mated to low-priced sires, in particular, was proportionally greater. This may indicate a greater efficiency within the national herd, with fewer mares being required to provide enough foals for sale and racing (Gee et al. 2017). There has been a moderate increase in the number of fillies entering racing in New Zealand (Legg et al. 2021) and this may reflect fewer colts available for the domestic market, as a disproportionate number of colts are purchased as yearlings for export. The increasing number of fillies racing may also reflect greater commercial (export) focus and the need to demonstrate genetic merit of fillies on the race track to validate the cost of breeding and ensure commercial appeal of the resultant progeny (Rogers and Gee 2011).
The commercial and production advantages of an early foal effectively compress the New Zealand breeding season between September and November, and this provides a significant challenge for the stallion owner, given the industry constraint of being able to use only natural service. Ideally, maiden and empty mares should be mated earlier in the season, to provide a more even distribution of stallion mating workload throughout the season. However, the mean mating date for these categories of mares was mid-October, with significant variation around the mean. These data indicate that artificial-lighting programs to promote the early onset of oestrus were used selectively only on some mares, due to the management constraint and costs associated with stabling and yarding mares for these programs (Hanlon et al. 2012a). In recent years, ‘blue light masks’ have provided a cheap and pragmatic method to stimulate increasing daylength and promote early onset of oestrus (Murphy et al. 2014) and the widespread use of these may have, subsequently, resulted in a shift to an earlier date for the mating of maiden and empty mares.
Gestation length decreased significantly with a delay in the month of conception (September–December), reflecting that daylength provides one of the primary cues for parturition (Lutzer et al. 2022) and the underpinning biological driver for the mare to foal at the time when pasture supply and environmental conditions are optimal for nutrition and foal growth. The role of extended daylength also reflected the differences in the foaling and mating pattern between the northern (37.7826°S, 175.2528°E, Hamilton) and southern (43.5320°S, 172.6306°E, Christchurch) regions, where the seasonal increase in daylight length is delayed in the southern regions (Fig. S2). However, there was a confounder with this observation based on latitude as the mares bred in the southern region were mated to stallions with low and medium stud fees. Therefore, many of the farms and breeders in the South Island may not be breeding with the primary focus of selling the resultant progeny as a yearling, and are thus under less commercial pressure to breed early in the season (Chin et al. 2022).
Reducing foaling drift permits maintenance of an annual foaling pattern and maximisation of financial returns (Bosh et al. 2009). The short FCI observed in this study appeared to be an attempt to reduce seasonal breeding drift and this hypothesis was supported by the observation of decreased FCI with later foaling dates. Despite the pressure to prevent seasonal foaling drift, data in this study suggest that the use of foal heat breeding appeared to be limited. Similarly, records from commercial farms indicate that <32% of mares were bred on foal heat and the selection of mares to be bred on foal heat is dependent on criteria such as, foal heat occurring >10 days post-partum, and uterine conditions upon ultrasound examination (Hanlon et al. 2012a).
The recruitment of most mares into the breeding herd at 5 years of age reflects that most horses in New Zealand start racing as 3-year-olds and have a racing career of approximately 500 days (Legg et al. 2021). The length of the subsequent breeding career appears to be strongly associated with the greater stud fee of the stallion she was mated to in her first year of breeding. It was previously shown that a greater proportion of mares mated to elite stallions were female progeny of elite stallions and had race records (Rogers and Gee 2011), suggesting an effect of assortative mating.
The age profile of the mare breeding herd was truncated at approximately 13 years old, the age at which the book value of the mare reduces to zero according to New Zealand taxation law. Retirement of mares was also associated with a greater number of pregnancy losses and a higher percentage of pregnancy losses was observed in mares older than 14 years, being similar to previous reports from commercial farms (Hanlon et al. 2012b). Therefore, truncation of the breeding herd at 12 years of age is a combination of taxation law, reduced reproductive fitness and, probably most importantly, identification of genetic merit via progeny performance on the racetrack.
Conclusions
The data reported here supported the observation that similar to other Thoroughbred racing and breeding jurisdictions, the New Zealand Thoroughbred breeding industry had undergone contraction. In New Zealand, this contraction was predominantly within the sector that focused on the domestic market. The relative number of mares and their production and management data remained constant, or improved, for mares sent to the stallions with a greater commercial appeal (medium- and high-priced sires). The economic and production drivers for early born foals resulted in short foaling to conception intervals and a compressed breeding season. Survival within the breeding herd was strongly associated with initial perception of a mares genetic merit (value of the stallion service fee that the mare was first mated to) and the ability to produce progeny that were named, and thus raced. Increased reproductive output (breeding career length, number of foals born during career) and reproductive efficiency (greater successive seasons bred) were also positively associated with sire service fee.
Data availability
The data that support this study are available on request to the corresponding author.
References
Bosh KA, Powell D, Neibergs JS, Shelton B, Zent W (2009) Impact of reproductive efficiency over time and mare financial value on economic returns among Thoroughbred mares in central Kentucky. Equine Veterinary Journal 41, 889-894.
| Crossref | Google Scholar |
Chin YY, Rogers CW, Gee EK, Stafford KJ, Cameron EZ (2022) The pattern of breeding and management within the New Zealand Thoroughbred breeding industry 2005–2015. 1. The stallion population. Animal Production Science
| Crossref | Google Scholar |
Fenessey PF (2010) An overview of the New Zealand Thoroughbred industry. Proceedings of the New Zealand Society of Animal Production 70, 137-139.
| Google Scholar |
Gee EK, Rogers CW, Bolwell CF, Gee EK, Rogers CW, Bolwell CF (2017) Commercial equine production in New Zealand. 1. Reproduction and breeding. Animal Production Science 60, 2145-2154.
| Crossref | Google Scholar |
Ghasemi A, Zahediasl S (2012) Normality tests for statistical analysis: a guide for non-statisticians. International Journal of Endocrinology and Metabolism 10, 486-489.
| Crossref | Google Scholar |
Hanlon DW, Stevenson M, Evans MJ, Firth EC (2012a) Reproductive performance of Thoroughbred mares in the Waikato region of New Zealand: 1. Descriptive analyses. New Zealand Veterinary Journal 60, 329-334.
| Crossref | Google Scholar |
Hanlon DW, Stevenson M, Evans MJ, Firth EC (2012b) Reproductive performance of Thoroughbred mares in the Waikato region of New Zealand: 2. Multivariable analyses and sources of variation at the mare, stallion and stud farm level. New Zealand Veterinary Journal 60, 335-343.
| Crossref | Google Scholar |
Huntington PJ, Brown-Douglas CG, Pagan JD (2020) Growth and development of Thoroughbred horses. Animal Production Science 60, 2093-2102.
| Crossref | Google Scholar |
IFHA (International Federation of Horseracing Authorities) (2010) Annual report 2010. Available at https://www.ifhaonline.org/default.asp?section=Resources&area=2
IFHA (International Federation of Horseracing Authorities) (2015) Annual report 2015. Available at https://www.ifhaonline.org/default.asp?section=Resources&area=2
Legg KA, Gee EK, Cochrane DJ, Rogers CW (2021) Preliminary examination of the biological and industry constraints on the structure and pattern of Thoroughbred racing in New Zealand over thirteen seasons: 2005/06–2017/18. Animals 11, 2807.
| Crossref | Google Scholar |
Lutzer A, Nagel C, Murphy BA, Aurich J, Wulf M, Gautier C, Aurich C (2022) Effects of blue monochromatic light directed at one eye of pregnant horse mares on gestation, parturition and foal maturity. Domestic Animal Endocrinology 78, 106675.
| Crossref | Google Scholar |
Murphy BA, Walsh CM, Woodward EM, Prendergast RL, Ryle JP, Fallon LH, Troedsson MHT (2014) Blue light from individual light masks directed at a single eye advances the breeding season in mares. Equine Veterinary Journal 46, 601-605.
| Crossref | Google Scholar |
Osborne VE (1966) An analysis of the pattern of ovulation as it occurs in the annual reproductive cycle of the mare in Australia. Australian Veterinary Journal 42, 385-388.
| Crossref | Google Scholar |
R Core Team (2017) A language and environment for statistical computing. (R Foundation for Statistical computing: Vienna, Austria) Available at https://www.r-project.org/
Ransom JI, Hobbs NT, Bruemmer J (2013) Contraception can lead to trophic asynchrony between birth pulse and resources. PLoS ONE 8, e54972.
| Crossref | Google Scholar |
Rogers CW, Gee E (2011) Selection decisions in Thoroughbred broodmares. Proceedings of the New Zealand Society of Animal Production 71, 122-125.
| Google Scholar |
Rogers CW, Gee E, Vermeij E (2009) Retrospective examination of the breeding efficiency of the New Zealand Thoroughbred and Standardbred. Proceedings of the New Zealand Society of Animal Production 69, 126-131.
| Google Scholar |
Rogers CW, Bolwell CF, Gee EK, Rosanowski SM (2020) Equine musculoskeletal development and performance: impact of the production system and early training. Animal Production Science 60, 2069-2079.
| Crossref | Google Scholar |
Stowe CJ (2013) Breeding to sell: a hedonic price analysis of leading Thoroughbred sire stud fees. Applied Economics 45, 877-885.
| Crossref | Google Scholar |
Stowe CJ, Ajello B (2010) A hedonic price analysis of differentiated products of unknown quality: freshman sire stud fees in the Thoroughbred breeding industry. Journal of Agribusiness 28, 19-30.
| Crossref | Google Scholar |
Tanner JC, Rogers CW, Firth EC (2013) The association of 2-year-old training milestones with career length and racing success in a sample of Thoroughbred horses in New Zealand. Equine Veterinary Journal 45, 20-24.
| Crossref | Google Scholar |
Velie BD, Knight PK, Thomson PC, Wade CM, Hamilton NA (2013) The association of age at first start with career length in the Australian Thoroughbred racehorse population. Equine Veterinary Journal 45, 410-413.
| Crossref | Google Scholar |
Vickner SS, Koch SI (2001) Hedonic pricing, information, and the market for Thoroughbred yearlings. Journal of Agribusiness 19, 173-189.
| Crossref | Google Scholar |
Waldron K, Rogers CW, Gee EK, Bolwell CF (2011) Production variables influencing the auction sales price of New Zealand Thoroughbred yearlings. Proceedings of the New Zealand Society of Animal Production 71, 92-95.
| Google Scholar |