

Early lactation performance of primiparous dairy heifers reared with differing levels of early-life complexity
Laura Field A B * , Lauren Hemsworth A , Ellen Jongman A , David McGill C and Megan Verdon B
A
B
C
Abstract
The complexity of the early-life environment can affect personality development. In dairy cattle, traits such as nervousness are linked to higher stress and lower productivity.
This study explored productivity indices of dairy heifers in the first 28 d of lactation, with preliminary exploration of the effects of early-life complexity on these outcomes.
Groups of heifers were reared at different levels of complexity between 2 and 13 weeks of age. Two groups of 10 were group-reared as commercial controls, in covered, bedded pens (CC, n = 20). These commercial controls were compared to two treatments reared at pasture, housed either in two groups of 10 with no adult contact (−S, n = 20) or in two groups of 10 housed with three non-maternal mature dry cows per group (+S, n = 20). Forty-eight of the original 60-heifer cohort remained in the replacement herd at calving around 24 months of age. Calving occurred in two peak periods, commencing approximately 18 d apart. Productivity data (daily milk yield, liveweight and body condition score (BCS)) were collected twice-daily for the first 28 d of lactation following calving. Individual milk samples were collected at 7 d, 14 d and 28 d of lactation and analysed for cortisol concentration.
There was a significant treatment × calving peak × week effect on milk yield (P < 0.001) and BCS (P < 0.001). Heifer data followed converse patterns wherein as milk yield increased over the 28 d study period, BCS declined. The magnitude of weight loss tended to reduce over weeks of the 28 d study period (P < 0.001). Cortisol concentrations in milk samples taken at 14 d of lactation (i.e. the week following introduction to the main herd) were significantly higher than those taken at 28 d of lactation, after approximately 3 weeks in the main herd (P = 0.009).
Early-life treatments did not influence most outcomes measured in this study, likely due to low replication and limited sample sizes. Data presented do, however, comprehensively describe the experiences of primiparous heifers over their first month of lactation in a seasonal-calving pasture-based dairy system.
The first month of lactation may cause significant stress to primiparous heifers, particularly surrounding early social integration with the milking herd.
Keywords: calf welfare, cow-calf contact, early-life experience, environmental enrichment, first lactation, non-maternal contact, primiparous, social enrichment.
Introduction
The period encompassing a dairy animal’s final 3 weeks of pregnancy and the 3 weeks following entry to the milking herd is commonly termed the ‘transition period’ (Drackley 1999). The transition period presents numerous stressors to all lactating cattle, but particularly to primiparous dairy heifers commencing their first lactation. Such stressors include the act of calving and subsequent separation from the calf, adaptation to novel environments such as the milking parlour, more intensive handling by stockpeople, changes to diet and routine, and multiple regroupings, including with unfamiliar mature animals (reviewed by Drackley 1999; Proudfoot and Huzzey 2022; Verdon 2023). This can increase social stress and the amount of aggression received, and reduced heifer lying time and feed intake, with subsequent effects on milk yield (Brakel and Leis 1976; Von Keyserlingk et al. 2008; reviewed by Verdon 2023). In pasture-based systems, which are reliant on intensive grazing, this period of disruption may also reduce the heifer’s ability to graze competitively and access first-pick pasture (Phillips and Rind 2001; Stafford and Gregory 2008; Field et al. 2023a). The relationship between heightened grazing competition and reduced milk yield in lower-parity compared to higher-parity cows has been demonstrated (Verdon et al. 2018).
Across a range of species, early-life complexity, particularly social contact with adults, is integral to the development of social competence, and improves stress resilience, acceptance of novelty, and cognition (e.g. Veissier et al. 1994; Lévy et al. 2003; Bourjade et al. 2008; Arnold and Taborsky 2010; Duve et al. 2012; Wagner et al. 2013; Edgar et al. 2016). Despite the plethora of benefits provided by adult contact in early life, dairy calves globally are usually separated from their dams soon after birth. Adult and juvenile animals are housed separately, with calves reared by hand. In Australia, most artificially-reared calves are housed in groups of animals around the same age in space-restricted, covered or indoor bedded pens (Abuelo et al. 2019; Field et al. 2024a). Calves are weaned from milk onto pasture at 8–12 weeks of age and are managed extensively with same-age peers until around primiparturition, when they first mix with mature members of the herd (Phipps et al. 2018; Abuelo et al. 2019; Field et al. 2024a; reviewed by Verdon 2023). Little research has explored the longitudinal consequences of early-life experiences in dairy heifers (e.g. Wagner et al. 2012, 2015). It is possible, however, that given the potential for early-life experiences to improve social capability and stress resilience in cattle, early-life management may be engineered to improve first-lactation performance, for instance through reducing social stress during integration into the main herd.
Measures of productivity and successful physiological maintenance are the most commercially relevant indicators of heifer performance during early lactation. The daily milk yield (litres milk/day) of the typical pasture-based Australian dairy cow follows a ‘lactation curve,’ typified by swift peak in maximum daily yield 4–8 weeks after calving, followed by a gentle decline until dry-off, typically after a 10-month lactation (Keown et al. 1986; Garcia and Holmes 2001; Morton and McBride 2004; Auldist et al. 2007). To achieve peak lactation, the post-parturient dairy cow’s body prioritises milk synthesis in the mammary gland over most other bodily processes (Bauman and Currie 1980). Having ideally achieved peak body condition immediately prior to calving, the cow’s nutritional needs outstrip feed intake capabilities, precipitating a negative energy balance (NEB). The body’s fat and protein stores are metabolised alongside daily feed intake, a process causing rapid declines in both liveweight (LW) and body condition scores (BCS, Coffey et al. 2002; Morton and McBride 2004; Roche et al. 2006, 2007; reviewed by Bauman and Currie 1980; McNamara et al. 2008).
Greater NEB magnitude and/or duration increases risks to fertility, productivity, and health (e.g. increased risk of laminitis, milk fever or ketosis), with ongoing welfare, sustainability, and survivability implications (Collard et al. 2000; Pryce et al. 2001; Butler 2003; Wathes et al. 2007, 2008). While magnitude and duration of the NEB can be monitored through changes to LW, this measure can be heavily influenced by breed, energy stores, capacity for gut fill, height, and width and, in heifers, the time taken to reach physical maturity, making it a relatively inaccurate and incomparable measure across individuals (Gibb et al. 1992; Andrew et al. 1994). The use of BCS and magnitude of LW changes calculated through average daily gain (ADG) deliver more reliable points of comparison across animals and particularly across treatments (Mullins et al. 2019). Heifers which better maintain condition, as measured by these indices, for reasons external to metabolic processes – for instance through better coping with social stress, or ability to access quality feed in competitive feeding environments – may be better equipped to avoid experiencing such outcomes.
Physiological measures, such as changes in cortisol concentration, offer further insight into the level of stress experienced by heifers during the transition period. Cortisol concentrations in blood, saliva, hair, or milk indicate the magnitude of the body’s arousal in response to both positive and negative stimuli, such as sexual activity, exercise, hunger, or agnostic interactions (reviewed by Selye 1976; Crofton et al. 2015). Blood plasma cortisol is higher, for instance, in cattle milked in an unfamiliar environment compared to the familiar milking environment (Bruckmaier et al. 1993). The concentration of cortisol in milk specifically reflects the accumulation of plasma cortisol over a period of at least 2 h and potentially up to 8 h of milk synthesis in the udder (Shutt and Fell 1985; Verkerk et al. 1998; discussed by Verdon et al. 2021). The percentage of serum-bound cortisol is higher in colostrum (generally produced within the first 7 d of lactation) than in milk, suggesting comparisons between cortisol concentrations at these two stages of lactation should be avoided (Shutt and Fell 1985; Gellrich et al. 2015). Heifers that are more predisposed to stress, more reactive, more likely to receive aggression from peers or are less comfortable in novel situations may exhibit higher cortisol concentrations in milk samples (e.g. Van Reenen et al. 2002).
The heifers studied in the present paper were reared according to one of three treatments which applied varying levels of social and physical complexity to the early-life environment, though access to pasture and contact with non-maternal adults. We explored whether the benefits arising from increasing early-life complexity in these ways would translate to (a) improved experiences for the individual heifer when adapting to milking during the first month of lactation, and (b) tangible commercial benefits to the producer associated with the welfare benefits afforded to the enriched animal.
Previous behavioural testing indicated that heifers reared with greater physical and social complexity in this longitudinal experiment were less vigilant towards, and more likely to interact with, novelty at 18 months, and eased into a similar grazing pattern to mature cows more rapidly after mixing at 23 months, compared to those reared in indoor pens (Field et al. 2023a, 2024b). In both studies, providing pasture access but not non-maternal adult contact improved responses only compared to heifers reared indoors (Field et al. 2023a, 2024b). These previously observed treatment differences may translate to improved ability to cope with the various stressors experienced during the first-lactation transition period. In this study, differences in early lactation success were thus assessed over the first 28 DIM through the following productivity indices: total daily milk yield (litres), body condition score maintenance, liveweight maintenance (ADG in kg), and concentration of cortisol in milk samples. We hypothesised that early-life access to pasture and contact with non-maternal adults (i.e. the +S treatment) would reduce the stress these individuals would experience during this period, improving heifer adaptation to the milking herd during the first month of lactation, and that these improvements could be measured through all productivity indices.
Methodology
Animal management
This experiment was conducted at the Tasmanian Dairy Research Facility (TDRF) near Elliott in north-west Tasmania, Australia (41°080 S, 145°770 E; 155 m above mean sea level). All animal procedures were approved by the University of Tasmania Animal Ethics Committee (A0018141) under the Tasmanian Animal Welfare Act 1993. Sixty dairy heifer calves were enlisted in the initial treatment period of this experiment, which ran from August to November 2019, while heifers were aged 2–13 weeks. After the treatment period, heifers were mixed into a single replacement heifer group along with other unfamiliar non-experimental replacement heifers (~80), and all animals were managed identically by TDRF staff, following the farm’s commercial protocol. Data presented in the present paper were collected from 48 heifers who remained in the dairy herd between July and October 2021, when heifers were approximately 23–25 months old. This reflects a 20% dropout in experimental animals from treatment imposition to the period described in this study.
The following sections describe the management of heifers throughout the duration of this longitudinal study, with specific detail given to management over the transition period into the commercial milking herd. Table 1 offers a brief overview of the management of study heifers from birth until calving, and includes references to published studies undertaken at several points across this period.
| Age | Treatment | ||||
|---|---|---|---|---|---|
| +S An = 20 over two replicates | −S Bn = 20 over two replicates | CC Cn = 20 over two replicates | |||
| 0–2 weeks | Sheds | ||||
| 2–12 weeks | Treatment period – at pasture, with cows | Treatment period – at pasture without cows | Retained in sheds, without cows | ||
| (Published as Field et al. 2023b) | |||||
| 13 weeks−18 months | Mixed and housed at pasture | ||||
| 18 months | Behavioural Testing (Published as Field et al. 2024b) +S n = 16; −S n = 17; CC n = 17 | ||||
| 18−23 months | Mixed and housed at pasture | ||||
| 23 months | Drafted into two groups, early calvers (EC, due 20 July 2021) and late calvers (LC, due 3–31 August 2021). Integration testing with mature cows (2 d). (Published as Field et al. 2023a) | ||||
| Early calvers (EC) | Late calvers (LC) | ||||
| +S = 6, −S = 8, CC = 9 | +S = 10, −S = 9; CC = 8 | ||||
| 23–26 months | Entered lead feed with no mature cows on 27 June 2021. Calving 12–23 July 2021, joined by premature calving cows. (+S = 6, −S = 9, CC = 10) D | Staggered entry to lead feed based on expected calving date in mixed heifer-cow group from 11 July–8 August 2021. Calving 30 July–8 September 2021. (+S = 10, −S = 8, CC = 6). | |||
Between August and November 2019, one of three management protocols was imposed on 60 mixed-breed dairy heifers from the ages of 2–13 weeks. These were: (1) hand-reared calves group-housed in sheds (two commercial control groups of 10 calves, called CC); (2) hand-reared calves group-housed on pasture (two experimental control groups of 10 calves each, called −S); and (3) hand-reared calves group-housed on pasture with three non-familial dry cows per group (two experimental treatment groups of 10 calves each, called +S). The three rearing conditions imposed as treatments are described in further detail inField et al. (2023a, 2023b) and Field et al. (2024b).
The TDRF herd is comprised of several dairy breeds and their crosses, and the breed distribution of the 48 experimental heifers studied in the present paper reflects the mix of breeds present in the herd (Friesian +S = 10, −S = 8, CC = 6; Jersey +S = 1, −S = 2, CC = 1; Friesian × Jersey (FJ), Friesian × Jersey Friesian cross (FFFJ), Jersey × Jersey Friesian cross (FJJJ) or majority FJ × other dairy genetics +S = 5, −S = 7, CC = 9; Table 2).
| Calving peak | Treatment | Number of heifers/breed | Total | |||||||
|---|---|---|---|---|---|---|---|---|---|---|
| FA | JB | CBC | R/RCBD | |||||||
| FJ | FFFJ | FJJJ | Undetermined | |||||||
| 1 (EC) | +S | 3 | 1 | 0 | 1 | 1 | 0 | 0 | 6 | |
| −S | 4 | 1 | 1 | 2 | 0 | 0 | 1 | 9 | ||
| CC | 3 | 0 | 0 | 5 | 0 | 2 | 0 | 10 | ||
| 2 (LC) | +S | 8 | 0 | 2 | 0 | 0 | 0 | 1 | 10 | |
| −S | 4 | 1 | 0 | 0 | 0 | 2 | 1 | 8 | ||
| CC | 3 | 1 | 0 | 1 | 0 | 1 | 0 | 6 | ||
All heifer calves were gradually weaned over the duration of a week at the end of the treatment period (approximately 12–13 weeks of age). All weaned animals were then mixed along with non-experimental weaned heifers to form a single replacement heifer herd, which was managed together from 3 to 23 months of age. The herd was checked daily, weighed monthly, and provided supplementary silage and hay when necessary by TDRF staff; the herd was also regularly provided fresh pasture allocations. For discussion of typical Australian pasture-based replacement dairy heifer management, refer to Verdon (2023).
At approximately 13 months of age, the replacement heifer herd was subjected to the farm’s breeding program, involving heat synchronisation and artificial insemination for two cycles. During the second cycle, and for the following month, the heifer herd was housed with up to three Angus bulls to allow natural conception where artificial insemination was unsuccessful.
At 18 months of age, heifers underwent pregnancy diagnosis via transrectal palpation. After pregnancy diagnosis, 50 of the 60 original experimental heifers were retained by the farm and returned to graze pasture on land adjacent to the TDRF farm, where they remained until late June 2021.
The TDRF herd calves seasonally, with primiparous heifers commencing calving in early July. The farm’s breeding program results in two calving peaks: those animals who conceived to artificial insemination at first service, referred to hereon as ‘early calving peak’ (EC) heifers, and those who conceived to a second round of artificial insemination or to service by herd bull, referred to hereon as ‘late calving peak’ (LC) heifers. The main herd of multiparous cows followed a similar calving trend, with early calving cows commencing calving 2 weeks after early calving heifers.
In late June 2021, both heifer and mature cow groups were divided by their expected calving peak, as estimated at pregnancy diagnosis. The EC heifers were trained to the milking parlour environment in early July 2021, while being provided with lead feed in the milking stalls. Lead feed is a diet provided to transition animals to prepare their bodies for the various physiological stressors associated with calving and commencing lactation. In the case of the heifers described in the present study, this feed was provided in the form of pellets in addition to the ongoing grazing of pasture and provision of supplemental hay and silage as required. The LC heifers commenced lead feed approximately 2 weeks later, but lead feed commencement was staggered by expected calving date in these animals, and these lead feed groups included some mature cows.
In the fortnight leading up to expected calving date, heifers were housed on a calving pad adjacent to the milking parlour, with access to strip-grazed pasture, and hay ad libitum. On days of particularly poor weather, access to a shed bedded with wood chips was provided. Heifers who calved towards the end of the second calving peak (LC) were housed with early-calving mature cows in this environment, given the crossover in expected calving dates within these two groups. EC heifers, meanwhile, were unlikely to be housed with mature cows prior to entering the fresh herd after calving (numbers provided in Table 1).
Heifers were monitored several times daily before calving by farm staff. Calves were typically removed from heifers within 6–8 h of birth. Heifers were then moved to the milking parlour, a DeLaval 20-unit swing-over herringbone fitted with automatic cup removers, at the end of the next scheduled milking, where they would join the ‘fresh’ herd (i.e. the herd of freshly-calved cattle). Colostrum was harvested into buckets for 2–3 milkings, and for the following 5–7 days fresh cow milk was diverted to a separate tank to feed calves by hand. The single fresh herd was milked twice daily, immediately following the single main herd. Animals grazed pasture with supplementary silage or hay provided when necessary, and were offered concentrate in the bail (2–7 kg/heifer daily, 88% DM).
During the fresh period, heifers were monitored by farm staff for complications associated with calving and early lactation, as per TDRF standard practice. These complications included but were not limited to inhibited milk letdown, mastitis, metritis and metabolic disease. Once heifers were acclimatised to the milking routine, were letting down milk, showed no evidence of early-lactation illness and had passed the withdrawal period for antibiotic residue in milk, they transitioned into the main milking herd.
The TDRF main and fresh milking herds were housed at pasture in separate paddocks at all times, except during milking which occurred twice daily, at ~0600 h and ~1500 h local time, when each herd was brought separately to the parlour through a holding yard. After milking, both herds were provided fresh allocations of pasture comprising primarily perennial ryegrass (Lolium perenne L.; ≥ 80%). Paddocks grazed varied in distance from the milking parlour, with walking distance between parlour and paddocks averaging (± s.d.) 601 ± 352 m (range, 107–1175 m). At milking, the main herd was collected from the grazed paddock, with milking commencing approximately as the final cow entered the holding yard. After every animal on the active side of the herringbone finished milking, the 20 animals were released together to access the compacted laneway to the paddock, to graze until the next milking.
If heifers displayed any signs of illness or required treatment with medication, they were assessed by farm staff. Heifers displaying only mild symptoms expected to resolve within a few days were moved to the fresh herd for closer monitoring. Heifers requiring special attention, including treatment by a veterinarian, or with ongoing health issues, were temporarily managed in a sick herd, which was housed at pasture immediately adjacent to the milking parlour. Nine heifers from this study received medical treatment during their first 28 DIM. One heifer from each treatment was treated for udder oedema over 2 d in early lactation. Two +S heifers and two −S heifers were treated for metritis after checks were conducted by the herd veterinarian at 22–29 DIM. None of these heifers entered the sick herd. One +S heifer suffered from ongoing metritis and mastitis and was treated with a course of antibiotics in the sick herd. One −S heifer spent the entire first month of lactation in the sick herd with various issues associated with lameness and metritis; she was treated with a range of medications as per veterinary instruction and her data were not included in analysis.
Measures recorded
All data from the first month of lactation were collected without any interaction between researchers and animals, and experimental heifers were managed by the research farm identically to all other animals in the commercial milking herd in which they were housed. A timeline of data collection points is provided in Fig. 1.
Sampling timeline illustrating sampling periods for all variables measured in the present study. DIM, days in milk from day of calving; BCS, body condition score; LW, liveweight.
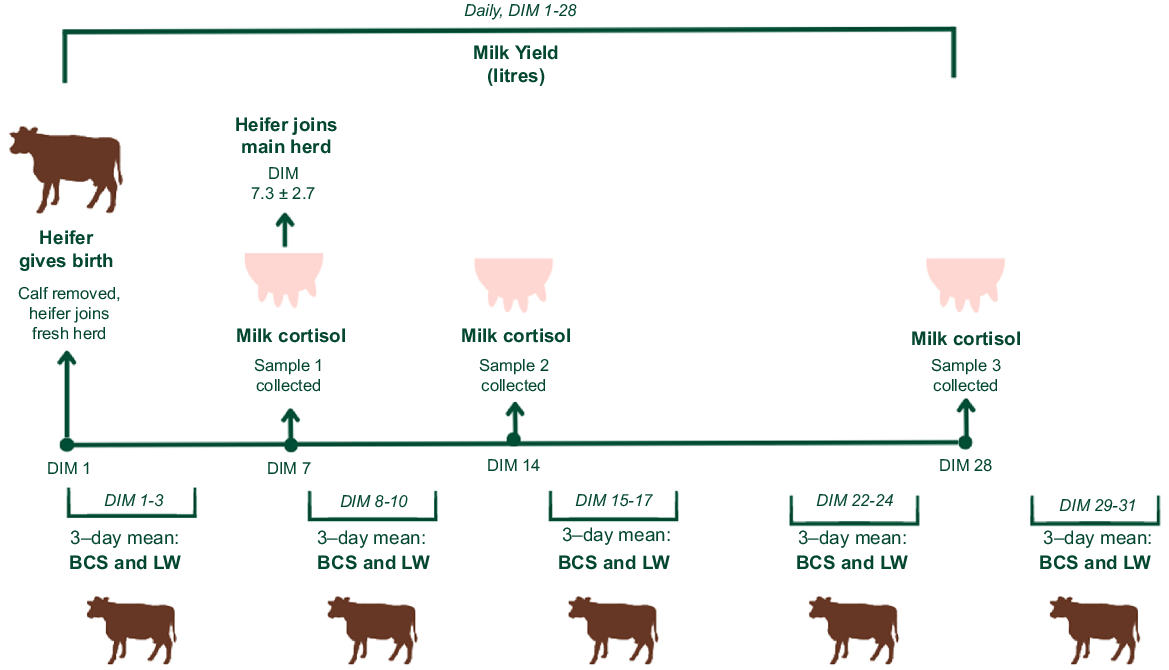
The individual milk yield of each heifer, in litres, was recorded at every milking across the data collection period using an automatic DeLaval Alpro milk metering system (DeLaval International AB), and was aggregated to a total daily yield (litres/heifer per day) by the DeLaval system. This daily aggregated value was used for analysis. Milk yield data were collected for the first 28 DIM for each heifer.
The LW and BCS of animals were automatically measured as animals exited the milking parlour. Liveweight was measured with walk-over scales situated in the exit race (DeLaval AWS100 automatic weighing system), fitted with software which discounts recorded liveweights when they differ significantly from the individual’s 7-day mean liveweight as previously recorded by the system (for instance when two or more animals were standing on the scale simultaneously). Given this, some LW records were missing from automatically collected data.
BCS was measured daily using a 3D BCS camera (DeLaval BCS automatic Body Condition Scoring system) which records BCS according to a 10-point scale in which an animal scoring 1 is emaciated and an animal scoring 10 is obese (described in detail by Roche et al. 2004). The efficacy of DeLaval’s automatic 3D camera BCS system has been validated (Mullins et al. 2019).
Twice-daily LW and daily BCS data were extracted from the program’s data output for each individual heifer’s first 31 DIM. These were used to calculate daily LW and BCS (averaged over the AM and PM data points per day). To account for potential discrepancies in daily data (e.g. due to differences in rumen fill or water intake), the daily LW and BCS values were then averaged over the first 3 d of each week in milk (i.e. days 1–3, days 8–10, and so on). These data were used to assess weekly changes in BCS and LW (by ADG) across the first 4 weeks of lactation.
Milk samples were collected from individual heifers at 7, 14 and 28 DIM to be analysed for cortisol concentration. Milk was collected at afternoon milking immediately following automatic cup removal, from a reservoir retained in the milking pipeline of each milking cluster. Samples were poured from the pipes directly into two labelled 12 mL centrifuge tubes. Collecting samples at the afternoon milking ensured that the milk cortisol results encompassed the period between the morning and afternoon milking. The timeline was chosen to allow a comparison of treatment cortisol concentrations when first entering the main herd, as well as an assessment of differences in adjustment to the milking routine over several weeks.
Samples were frozen within 45 min of collection. Whole milk was prepared and assayed by an external laboratory (Faculty of Veterinary and Agricultural Science, University of Melbourne, Melbourne, Australia) with an MP Biomedicals Cortisol RIA (radioimmunoassay) kit. Assay sensitivity was 0.31–0.42 ng/mL, the intra-assay coefficient of variability was 6.4% and the inter-assay coefficient of variability was 8.6% at 9.18 ng/mL.
Data management
The initial treatment was imposed on 60 heifers; at their first calving at approximately 23 months of age, 50 heifers remained in the TDRF replacement herd. Dropout of the 10 lost heifers was explained by failure to get in calf, or genetics outside the farm’s longitudinal breeding goals.
One CC heifer did not calve and was pregnancy diagnosed as empty at the beginning of September 2021; this animal was removed from the experiment. Twenty-five experimental heifers calved during the EC peak, between 12 July 2021 and 23 July 2021 (+S = 6, −S = 9, CC = 10). Twenty-four experimental heifers calved during the LC peak, between 30 July 2021 and 8 August 2021 (+S = 10, −S = 8, CC = 6). As calving occurred according to success of conception and ensuing gestation length experimental protocol could not balance or otherwise influence the distribution of breed across calving peaks; these data within treatments is presented in Table 2.
Accounting also for the EC −S heifer which remained in the sick herd for her first month of lactation, the data analysed therefore pertain to 48 experimental heifers (+S = 16, −S = 16, CC = 16). For other heifers which spent any proportion of their first month of lactation in the sick herd, data from the days which they were not in the main or fresh herds were removed from analysis.
Data were also discarded on three study days for various reasons. All data from 11 August and 8 September were discarded, as a routine herd testing processes caused significant disruption to the daily routine and management of the herd. This affected data from 37 heifers and 14 heifers respectively. Electrical supply issues on 9 September resulted in significant disruptions and delays to milking; this affected data from 15 heifers. A total of 10 milk cortisol samples were also discarded from these dates, comprising three week 1 cortisol samples and four week 4 cortisol samples from 11 August, two week 4 cortisol samples collected on 8 September and one week 4 milk cortisol sample collected on 9 September.
Once these data were removed, mean DIM at heifer entry to the main herd from the fresh herd was 7.3 ± 2.7 (range 4–19 DIM). Mean day of entry to the main herd by treatment was 7.8 ± 4.0 DIM for +S heifers (range 5–19 DIM), 6.7 ± 1.8 DIM for −S heifers (range 4–10 DIM), and 7.5 ± 2.0 DIM (range 5–12 DIM) for CC heifers.
Statistical analysis
All data were analysed in RStudio ver. 4.3.1 (2023 R Core Team: The R Foundation for Statistical Computing, Vienna, Austria) with linear mixed models. A Restricted Maximum Likelihood (REML) approach was used to fit all models, and account for missing data across the datasets. REML can be reliably applied to unbalanced data and analyses incorporating both fixed and random effects (Dieters et al. 1995).
In the following descriptions of the analyses, ‘Heifer’ denotes the individual animal from whom data was collected. In all analysis, ‘Heifer’ was nested within ‘Rearing group,’ and this was included in all statistical models as a random effect to account for the individual group a heifer was reared with (i.e. group 1–6 during rearing, wherein +S Replicate one heifers belonged to Group 1, +S Replicate two heifers belonged to group 4, and so on). ‘Treatment’ denotes +S, −S or CC early-life management protocol.
‘Calving Peak’ was included in most statistical models to account for potential differences in experiences between the EC and LC heifers during their first month of lactation (such as proportion of mature cows in the herd, and differences in pasture growth and quality), except for cortisol analysis, for which number of records precluded analysis to this level. Where appropriate, ‘Days in Milk’ (DIM) or ‘Week in Milk’ was included in the model to account for the day or week of lactation each data point corresponded with. For BCS, LW and ADG analysis, week differences were analysed using the previously described 3-day means, labelled in analysis as ‘Week_1st3DayDIMS.’ ‘Herd Number’ accounted for whether heifers were in the main or fresh herd. Within specific analyses, the interactions between two variables were also explored.
Each dataset was fitted to a linear mixed model. Variable-specific factors were initially chosen for inclusion in each full model, before ANOVA comparison of models were conducted to ascertain whether the inclusion or exclusion of each fixed factor had a significant effect on the outcome of the model. Final models were derived from the outcomes of these ANOVA comparisons.
In analysis of milk yield, BCS, LW and ADG, initial analysis tested the effects of treatment, week in milk (1–4; calculated for BCS, LW and ADG using mean values from the first 3 days of each week), and their interaction, treatment × week in milk; calving peak (1/EC or 2/LC), and the interaction of treatment × calving peak and treatment × calving peak × week on outcome variables.
Based on the outcomes of initial ANOVA comparisons, the final model for daily milk yield analysis was:
Based on the outcomes of initial ANOVA comparisons, the final model for BCS analysis was:
While ADG was the primary focus of this section of analysis, differences in LW were also analysed for descriptive purposes. As with BCS analysis, analysis was undertaken on 3-day means of the first 3 DIM in each week over the first month of lactation (1–5, with changes to LW and ADG thus encompassing the 4-week period). Based on the outcomes of initial ANOVA comparisons, the final model for LW analysis was:
ADG was calculated in the model as the mean daily rate of change in liveweight per heifer, based on means calculated from the first 3 DIM of each week. The final model for ADG analysis was:
Initial analysis of milk cortisol concentration tested the effects of cortisol number (1–3, corresponding to 7, 14 and 28 DIM), treatment, and the interaction of cortisol number × treatment, as well as herd number (1 = main herd, 2 = fresh herd) to account for potential differences in physiological, physical, and affective stress experienced within these two herds. There were not enough records for robust analysis with the inclusion of treatment, and not enough differences between treatment outcomes to make fitting such a model worthwhile. Thus, after ANOVA comparison the final model for milk cortisol analysis was:
Results
Daily milk yield
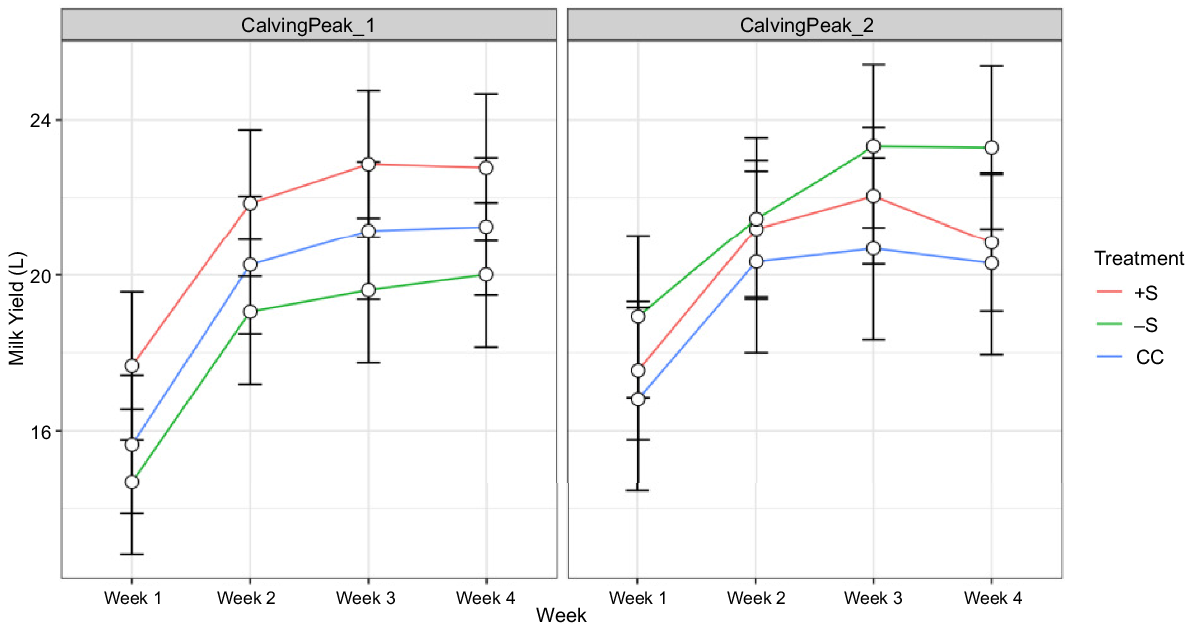
In data collected in this study, there was a significant interaction between treatment × calving peak × week on milk yield (P < 0.001). Across most treatments and calving peaks, milk yield generally followed an upward trend over the first 3 weeks of lactation (Fig. 2). Least-squares means (LS-means) for milk yields in week 4 were, however, slightly lower than in week 3 for all treatments in the LC peak, but only for the +S heifers in the EC peak (Table 3, Fig. 2).
Milk yield over weeks, by treatment and calving peak (graphed data represent LS-means ± s.e. from the linear mixed model MilkYield ~ Treatment × CalvingPeak × weekInMilk + (1|RearingGroup/Heifer)).
| Calving Peak A | Week of lactation | Treatment B | |||
|---|---|---|---|---|---|
| +S | −S | CC | |||
| 1 (EC) | 1 | 17.67 ± 0.88 | 14.69 ± 0.84 | 15.65 ± 0.74 | |
| 2 | 21.86 ± 0.87 | 19.06 ± 0.83 | 20.26 ± 0.74 | ||
| 3 | 22.87 ± 0.87 | 19.61 ± 0.83 | 21.15 ± 0.74 | ||
| 4 | 22.77 ± 0.88 | 20.01 ± 0.83 | 21.26 ± 0.74 | ||
| 2 (LC) | 1 | 17.55 ± 0.78 | 18.93 ± 0.89 | 16.81 ± 1.05 | |
| 2 | 21.20 ± 0.78 | 21.46 ± 0.89 | 20.34 ± 1.04 | ||
| 3 | 22.05 ± 0.78 | 23.33 ± 0.89 | 20.68 ± 1.04 | ||
| 4 | 20.84 ± 0.77 | 23.29 ± 0.89 | 20.31 ± 1.04 | ||
A significant interaction between treatment × calving peak across weeks (P = 0.011) is reflected in the values presented in Table 3, with −S heifers producing the least milk in the EC peak but the most in the LC peak.
Body condition score
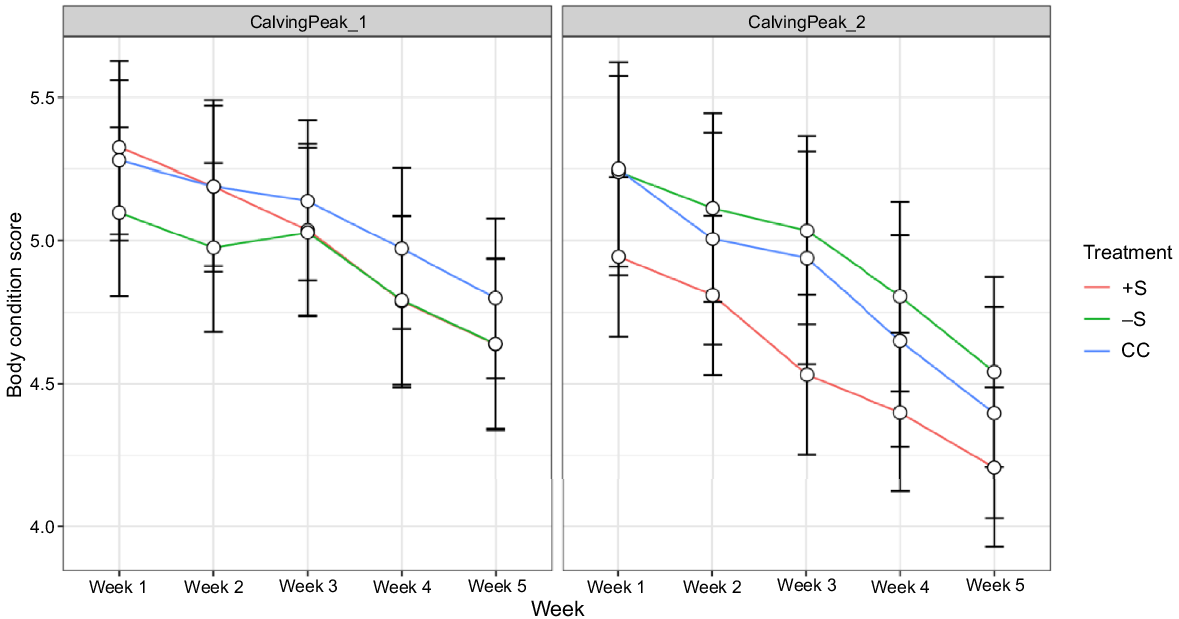
There was a significant interaction effect of treatment × calving peak × week on BCS (P = 0.001; Table 4). Heifer BCS generally followed a downward trend in most treatments and calving peaks across the 4-week period, with a more linear and greater magnitude of decline observed in LC than EC heifers (Fig. 3). The −S heifers generally had the lowest BCS across the EC peak, but the highest across the LC peak.
| Calving Peak A | Week of lactation | Treatment B | |||
|---|---|---|---|---|---|
| +S | −S | CC | |||
| 1 (EC) | 1 | 5.33 ± 0.14 | 5.10 ± 0.13 | 5.28 ± 0.12 | |
| 2 | 5.19 ± 0.14 | 4.98 ± 0.13 | 5.19 ± 0.12 | ||
| 3 | 5.04 ± 0.14 | 5.03 ± 0.13 | 5.14 ± 0.12 | ||
| 4 | 4.79 ± 0.14 | 4.79 ± 0.13 | 4.97 ± 0.12 | ||
| 5 | 4.64 ± 0.14 | 4.64 ± 0.13 | 4.80 ± 0.12 | ||
| 2 (LC) | 1 | 4.94 ± 0.12 | 5.24 ± 0.14 | 5.25 ± 0.17 | |
| 2 | 4.81 ± 0.12 | 5.12 ± 0.14 | 5.01 ± 0.17 | ||
| 3 | 4.53 ± 0.12 | 5.04 ± 0.14 | 4.94 ± 0.17 | ||
| 4 | 4.40 ± 0.12 | 4.81 ± 0.14 | 4.65 ± 0.17 | ||
| 5 | 4.21 ± 0.13 | 4.54 ± 0.14 | 4.40 ± 0.17 | ||
Liveweights and average daily gain
Only week in milk significantly affected ADG (P < 0.001). While LW generally followed a downward trend across the first 4 weeks of lactation (effect of week on LW P < 0.001), weekly changes in ADG generally trended upwards but without following any linear pattern; LW was lost over the 28-day study period, but the magnitude of weight loss appeared to lessen with time (Table 5 and Supplementary S1). While the least-squares means for LW of EC +S and CC heifers were within 10 kg of their LC counterparts, the EC −S heifers entered lactation 57.5 kg lighter than LC −S heifers (LS-means 440.32 ± 10.58 vs 497.81 ± 11.35, Supplementary S2). This difference is reflected in a significant interaction effect of treatment × calving peak on LW (P = 0.004).
| Calving peak A | Week of lactation | Treatment B | |||
|---|---|---|---|---|---|
| +S | −S | CC | |||
| 1 (EC) | 1 | −2.02 ± 0.73 | −0.81 ± 0.68 | −2.37 ± 0.61 | |
| 2 | −1.59 ± 0.73 | −1.86 ± 0.68 | −1.20 ± 0.61 | ||
| 3 | 0.97 ± 0.73 | −0.29 ± 0.68 | 0.00 ± 0.61 | ||
| 4 | −0.41 ± 0.73 | 0.29 ± 0.68 | −0.44 ± 0.61 | ||
| 2 (LC) | 1 | −1.11 ± 0.64 | −1.76 ± 0.76 | −2.28 ± 0.81 | |
| 2 | −1.54 ± 0.64 | −1.81 ± 0.69 | −0.61 ± 0.81 | ||
| 3 | −0.62 ± 0.64 | −1.65 ± 0.76 | −1.36 ± 0.81 | ||
| 4 | 0.44 ± 0.64 | −0.43 ± 0.76 | −0.40 ± 0.88 | ||
Milk cortisol concentration
There was no significant interaction effect of week number (1, 2 and 4, corresponding to DIM 7, 14 and 28) with treatment on milk cortisol concentrations (P = 0.315), nor was there an effect of herd on cortisol concentration (i.e. fresh or main herd, P = 0.333).
Sample number had a significant effect on milk cortisol concentration for all heifers (P = 0.009; raw cortisol data presented in Supplementary S3). Cortisol concentrations were highest at 14 DIM (LS-means 1.491 ± 0.199) and lowest at 28 DIM (LS-means 0.716 ± 0.267), corresponding to a decrease of 70.2% between the two sampling periods. The initial samples, collected at seven DIM sat between these two concentrations (LS-means 1.008 ± 0.274).
Discussion
The present study describes physiological data collected across dairy heifers’ first 28 DIM following their first calving, with some preliminary exploration of the effects of providing heifers with early life social and physical complexity on these outcomes. Contrary to our hypotheses, heifers reared with the highest level of physical and social complexity (+S) did not have the highest milk yield, or the lowest cortisol concentrations or magnitude of weight or body condition loss across the study weeks and calving peaks, despite their potential for improved grazing and reduced stress outcomes during the transition period. The current study was conducted with limited replication, and with a 20% dropout rate from initial treatment to first calving associated with the longitudinal nature of the project. It is likely that such low sample size and replication were insufficient to detect treatment differences in the measures taken. Any treatment effects for productivity data described here should thus be considered exploratory, and requiring further exploration. Despite this, the results of this study present a comprehensive narrative detailing the physiological effects of the first 28 d of lactation on seasonally-calving, pasture-housed dairy heifers. For instance, while milk yield of all heifer groups tended to increase across the weeks of the study period, BCS tended to decrease, and this change over time differed based on interactions with both calving peak and treatment. Regardless of early-life treatment, meanwhile, cortisol concentration was highest in samples taken at 14 DIM and lowest in samples taken at 28 DIM, indicating that the period immediately following integration into the main herd caused heifers some degree of physiological stress.
Early-life treatment and physiological mobilisation
A calving peak × treatment × week interaction for both milk yield and BCS appeared to largely be due to differences between −S heifer groups between calving peaks. The greatest observable difference was discrepancies in LW at calving between −S EC and −S LC heifers. In means taken over the first three DIM, −S EC heifers were an average of 50.7 kg lighter (per LS-means) than their LC counterparts, compared to an approximately 10 kg difference between +S and CC calving peaks. Despite this, −S heifers across both calving peaks calved at a similar BCS. The −S heifers in the EC peak had the lowest milk yield and BCS (by LS-means) over the first 4 weeks of lactation, compared to heifers of the +S and CC treatments; however, the opposite was true for −S LC heifers. Given the mobilisation of body reserves necessary for dairy cattle to reach peak lactation, it is possible that −S LC heifers were more physically mature, or had greater body reserves to support establishing milk production and the physiological stress associated with the process. This may have supported these heifers to maintain a higher level of production across the first 4 weeks of lactation. Regardless, there is no apparent indication as to why this difference in −S groups across calving peaks occurred. Distribution of pure-breed animals was identical in −S groups across calving peaks. The most likely explanation is that these disparities are simply the result of naturally occurring variation between two small groups of animals.
Physiological mobilisation in early-lactation heifers
When exploring heifer data outside of treatment effects, we found that the LS-means for BCS in the first 3 d after calving in the present study ranged from 5.10–5.33 in EC heifers to 4.94–5.25 in LC heifers on a 10-point scale. This is slightly higher than the mean BCS of 4.72 at calving across all pasture-based Jersey and Friesian study animals reported by Roche et al. (2007). Industry body Dairy Australia (2015) recommend a target BCS between 4.5 and 5.5 at calving on an 8-point scale (approximately equivalent to 4.4–6.1 on a 10-point scale, per Roche et al. 2004). Research suggests that the ideal BCS on a 10-point scale at calving for ongoing milk yield is between 5.0 and 6.5 (Roche et al. 2007). The results of the present study thus indicate that study heifers across were in relatively good commercial condition, meeting both industry recommendations and BCS required to meet their yield potential in their first lactation.
Collectively, the physiological changes observed in heifers in this study are typical of those observed in commercial herds and other research (e.g. Morton and McBride 2004; reviewed by Bauman and Currie 1980; McNamara et al. 2008). The yield of our primiparous heifers generally followed an upward trend in the first 4 weeks following calving, while BCS declined along with their liveweight. Roche et al. (2007) observed a nadir (lowest point) in body condition score (BCS) at an average of 48 days post-calving in pasture-based Jersey and Friesian dairy cattle; these results are in keeping with the trend observed in our own. The rate of weight loss, as determined from ADG calculated from weekly changes in automatically collected daily liveweights, decreased in magnitude as the first month of lactation progressed.
Patterns of cortisol concentration during early lactation
Higher apparent fearfulness or nervousness in dairy cattle has separately been loosely correlated with reduced milk yield (Hedlund and Løvlie 2015). In previous tests with the heifers sampled in the present study, we found that increasing early-life complexity appeared to improve heifer responses to novelty and mixing with mature animals (Field et al. 2023a, 2024b). While we had hypothesised that, given these differences, heifers from more complex early-life treatments (+S and −S) would have lower concentrations of cortisol in their milk samples, the final statistical model for milk cortisol analysis ultimately did not include treatment in its terms.
In the present study, there was a significant effect of sample number (1–3, reflecting d 7, 14 and 28 of lactation) on milk cortisol concentration (ng/mL). The highest concentrations were recorded from milk collected at 14 DIM, approximately a week after the day of transition from the fresh to main milking herd, and the lowest concentration 2 weeks later, at 28 DIM. Previous research has found that milk cortisol concentration is significantly higher in early lactation than mid-late lactation (Shutt and Fell 1985; Fukasawa et al. 2008; Gellrich et al. 2015). Shutt and Fell (1985) recorded milk cortisol concentrations of 4.4 ± 1.3 ng/mL in the 1–2 d following parturition, which dropped to 0.35 ± 0.06 ng/mL as lactation established. Fukasawa et al. (2008), meanwhile, defined early lactation as any time between 7 and 90 DIM and found significant differences between cortisol concentrations in samples taken over this period compared to those collected months later, with no effect of parity. In the present study, the three samples were collected within a sampling timeline more comparable to that described in Gellrich et al. (2015). These authors sampled twice weekly in weeks 2 and 3 post-partum and weekly thereafter, but used a modified ELISA rather than an RIA kit, so concentration of cortisol in samples cannot be directly compared (Gellrich et al. 2015). Regardless, a similar trend was found in the results of these authors, wherein samples from the week encompassing 8–14 DIM were significantly higher than the relatively stable concentration of cortisol in samples collected in the following weeks.
There are two stressors most likely to have influenced the pattern observed in milk cortisol concentrations across 7, 14 and 28 DIM in this study. Firstly, the first sample was taken just before the mean date of entry to the main herd, while the second was taken after most heifers had been in the main herd for 1 week. The slight increase in cortisol concentration between these two sampling points, both higher than the sample collected at 28 DIM, may indicate higher social stress experienced by heifers as they transitioned from the relatively small fresh herd into the main milking herd. This transition would be characterised by ongoing destabilisations to the established social structure of the herd, each followed by increased agonistic interactions between animals allowing the group to effectively determine hierarchy and dominance relationships (von Keyserlingk et al. 2008). Aggression is usually highest between the first 1–2 h after mixing, although regrouping effects can last up to 15 d post-mixing, and aggression is usually directed towards subordinate animals such as smaller, less experienced heifers (Brakel and Leis 1976; Kondo and Hurnik 1990; Bøe and Færevik 2003; reviewed by Verdon 2023). Integration, and the associated increase in agonistic interactions, has previously been correlated with peaks in faecal cortisol concentrations (Wagner et al. 2012). The third sample in this study, taken approximately 21 d after entry to the main herd, was significantly lower than that taken after approximately 7 d in the main herd. This may reflect a stabilisation of individual heifer position within the herd’s social structure, resulting in fewer received agonistic interactions and thus reduced social stress.
Secondly, the pattern of cortisol concentration peaking and then subsiding observed in the present study may reflect the physiological stress associated with early lactation NEB, which mobilises the hypothalamic-pituitary-adrenal (HPA) axis response similarly to other stressors, triggering the release of cortisol into the body (Bremel and Gangwer 1978; Crofton et al. 2015). The NEB lasts approximately 3–4 weeks until physiological processes stabilise, and condition is regained as the animal metabolises more energy than is required for continued milk production and body condition maintenance once again (Roche et al. 2007; Mellor 2017; reviewed by McNamara et al. 2008). Previous research resulting in similar cortisol patterns indicates that the physiological stress of the NEB is a likely cause of heightened early-lactation concentrations compared to concentrations of samples taken even by the third week of lactation (Shutt and Fell 1985; Fukasawa et al. 2008; Gellrich et al. 2015; Sgorlon et al. 2015). Despite these conclusions, it would be expected that heifers in the present study would remain in a NEB for at least 12–20 d after sampling concluded, associated with continued heightened cortisol concentrations (Roche et al. 2007; Harder et al. 2019). Given the reducing magnitude of negative ADG over weeks in the present study, however, the magnitude of physiological stress may have been less significant at 28 DIM post-parturition compared to 14 DIM; such an effect would support the present results. It is likely that both social and physiological stressors influenced patterns of early lactation milk cortisol concentrations, but it is not possible to disentangle the effects of the two in the present study.
Limitations and experimental design in pastoral dairy research
Designing experiments conducted in real-world dairy systems is an inherently complex process, and the results of the present study must be interpreted with prudence (Tempelman 2009). Low replication and sample sizes in the present study likely account for the few treatment effects found, particularly in terms of production indices. Engstrom et al. (2010) contend that it is difficult to find treatment differences in productivity, particularly milk yield, using a single dairy herd. The authors suggest that 350 cows per treatment may be needed to detect 1 kg differences in milk production (Fleiss 1981; Engstrom et al. 2010; Yandell 2017). This being said, significant effects of feeding treatment interactions on milk production and post-partum ADG have been found using 38 dairy cows (n = 13, 14 and 11 cows per treatment; Stein et al. 2006). Hedlund and Løvlie (2015), meanwhile, found personality effects on behaviour during milking, including indicators of fear, stress and discomfort, using data from 56 milking cows of two breeds. These effects were correlated with lower milk yields during first lactation (Hedlund and Løvlie 2015). Alongside low-level replication and small sample sizes, the effects of early-life treatments in the present study were likely too weak to influence heifer personality and response to the stressors present in early lactation to the point of differences in productivity parameters as identified in these previous studies. Greater replication would better-placed to detect robust longitudinal treatment effects.
Achieving group-level replication in pasture-based dairy systems is significantly more complex than when cows are housed indoors, hence the dearth of welfare research arising from pastoral systems compared to outputs from housed systems. Weather patterns, forage quantity and quality, and individual grazing behaviour are difficult to replicate across experimental units, while the greater space requirements and logistical complications associated with rotationally grazing cattle, and a tendency for block calving in herds managed at pasture are barriers to achieving high rates of group replication (Bransby 1989; Tempelman 2009; Bello et al. 2016). These conditions present challenges to producing replicable and easily interpreted results from pasture-based dairy research (Lean and Lean 2010). Pastoral dairy researchers must evaluate trade-offs between achieving high group-level replication and sufficient statistical power, and what is realistic and feasible in practice (Bello et al. 2016). Compromises in replication, while sometimes necessary, result in claims of pseudoreplication or insufficient statistical power (Oksanen 2001). Tempelman (2009) suggests that statistical robustness requires that at least two pens are used per treatment group in a single-dairy study; while lower than reported in research conducted in housed dairy systems (n = 2 groups/treatment) rearing two groups per treatment in the present study thus provided low-level replication. Further replication would be preferable, and would provide more biologically valid results. It is important to note here that in the present study, variability as a result of group effects within treatment was close to zero for most variables, suggesting that despite this statistical requirement, the potential effect of rearing group on the results obtained was negligible (Tempelman 2009).
Given the aforementioned complexities, it is important to acknowledge that before definitive conclusions can be drawn from novel research such as that described in the present study, similar replicated studies must be repeated with other animal cohorts and in other environmental settings. In this way, future research can elucidate the tangible welfare benefits afforded by potential treatment differences which are biologically valid and can be repeated in varying contexts and across a wider sample of herds. The data collected in this novel exploration into the effects of early-life experiences on first-lactation performance should be carefully interpreted until such a time as similar studies explore this topic with greater replication.
Lastly, in the present study, treatment effects may not have existed, or may have been diminished by the stress associated with early lactation, and particularly the physiological demand on the body. The relationships between stressors faced by lactating cattle, milk cortisol concentrations both chronic and acute, and behavioural indicators of stress and stress-prone individuals require further investigation. Despite little effect of treatment found with low sample size and replication, understanding the experiences of first-lactation heifers during their transition to the milking herd and productive life is important. The present study effectively describes the experiences of a group of pasture-housed dairy heifers during their first month of lactation. The early-life treatments and data collection methodology described in this study may inform future studies able to achieve greater replication, as research expands into this novel area.
Conclusions
The complexity of the early-life environment can influence long-term behavioural development, and the way individuals perceive the world around them, as demonstrated in treatment differences in behavioural data collected from the heifers studied in this present paper at 18 and 23 months of age (Field et al. 2023a, 2024b). Despite this, productivity data collected in the present study from groups of 24-month-old heifers reared according to one of three levels of early-life complexity found no treatment effects on milk yield, body condition or milk cortisol. Given individual variability in metabolic processes associated with early lactation, future research may choose to explore similar hypotheses in larger groups and with more robust levels of replication. Although early-life experiences did not influence outcomes in the present study, the data describes the experiences of a group of pasture-housed dairy heifers during their first month of lactation at a relatively unprecedented breadth, and indicates that heifers experience stress during this period. Future research may choose to explore ways of reducing or mitigating this stress, and exploring subsequent effects on similar productivity indices.
Declaration of funding
This work was supported by a DairyTas Small Grant, the 2019 RSPCA Hugh Wirth Scholarship, and an Australian Government Research Training Program Scholarship. No input into the study was given by funding bodies beyond this financial support, and these bodies did not play any role in study design, data collection, analysis, or interpretation, writing of the paper or the authors’ decision to submit to Animal Production Science.
Acknowledgements
We acknowledge that every part of Australia is, always was and always will be, Aboriginal land. We acknowledge the Palawa people as the Traditional Custodians of lutrawita (Tasmania), including the land, community, sea, and waters upon which this research was conducted. This study would not have been possible without the contribution of time and resources by the Tasmanian Institute of Agriculture’s Dairy Research Facility (TDRF). Particular thanks must be given to Bradley Millhouse, Oliver Radford, Jake Walker and Sam Greene from the TDRF for their support across the duration of this project.
References
Abuelo A, Havrlant P, Wood N, Hernandez-Jover M (2019) An investigation of dairy calf management practices, colostrum quality, failure of transfer of passive immunity, and occurrence of enteropathogens among Australian dairy farms. Journal of Dairy Science 102(9), 8352-8366.
| Crossref | Google Scholar |
Andrew SM, Waldo DR, Erdman RA (1994) Direct analysis of body composition of dairy cows at three physiological stages. Journal of Dairy Science 77(10), 3022-3033.
| Crossref | Google Scholar |
Arnold C, Taborsky B (2010) Social experience in early ontogeny has lasting effects on social skills in cooperatively breeding cichlids. Animal Behaviour 79(3), 621-630.
| Crossref | Google Scholar |
Auldist MJ, O’Brien G, Cole D, Macmillan KL, Grainger C (2007) Effects of varying lactation length on milk production capacity of cows in pasture-based dairying systems. Journal of Dairy Science 90(7), 3234-3241.
| Crossref | Google Scholar |
Bauman DE, Currie WB (1980) Partitioning of nutrients during pregnancy and lactation: a review of mechanisms involving homeostasis and homeorhesis. Journal of Dairy Science 63(9), 1514-1529.
| Crossref | Google Scholar |
Bello NM, Kramer M, Tempelman RJ, Stroup WW, St-Pierre NR, Craig BA, Young LJ, Gbur EE (2016) Short communication: on recognizing the proper experimental unit in animal studies in the dairy sciences. Journal of Dairy Science 99(1), 8871-8879.
| Crossref | Google Scholar |
Bøe KE, Færevik G (2003) Grouping and social preferences in calves, heifers and cows. Applied Animal Behaviour Science 80(3), 175-190.
| Crossref | Google Scholar |
Bourjade M, Moulinot M, Henry S, Richard-Yris M-A, Hausberger M (2008) Could adults be used to improve social skills of young horses, Equus caballus? Developmental Psychobiology 50(4), 408-417.
| Crossref | Google Scholar |
Brakel WJ, Leis RA (1976) Impact of social disorganization on behavior, milk yield, and body weight of dairy cows. Journal of Dairy Science 59(4), 716-721.
| Crossref | Google Scholar |
Bransby DI (1989) Compromises in the design and conduct of grazing experiments. Grazing Research: Design, Methodology, and Analysis 16, 53-67.
| Crossref | Google Scholar |
Bremel RD, Gangwer MI (1978) Effect of adrenocorticotropin injection and stress on milk cortisol content. Journal of Dairy Science 61(8), 1103-1108.
| Crossref | Google Scholar |
Bruckmaier RM, Schams D, Blum JW (1993) Milk removal in familiar and unfamiliar surroundings: Concentrations of oxytocin, prolactin, cortisol and β-endorphin. Journal of Dairy Research 60(4), 449-456.
| Crossref | Google Scholar |
Butler WR (2003) Energy balance relationships with follicular development, ovulation and fertility in postpartum dairy cows. Livestock Production Science 83(2–3), 211-218.
| Crossref | Google Scholar |
Coffey MP, Simm G, Brotherstone S (2002) Energy balance profiles for the first three lactations of dairy cows estimated using random regression. Journal of Dairy Science 85(10), 2669-2678.
| Crossref | Google Scholar |
Collard BL, Boettcher PJ, Dekkers JCM, Petitclerc D, Schaeffer LR (2000) Relationships between energy balance and health traits of dairy cattle in early lactation. Journal of Dairy Science 83(11), 2683-2690.
| Crossref | Google Scholar |
Crofton EJ, Zhang Y, Green TA (2015) Inoculation stress hypothesis of environmental enrichment. Neuroscience & Biobehavioral Reviews 49, 19-31.
| Crossref | Google Scholar |
Dairy Australia (2015) Assessing a herd’s body condition and using results. Southbank Victoria, Australia. Available at https://www.dairyaustralia.com.au/resource-repository/2020/07/09/assessing-a-herds-body-condition [verified 20 November 2023]
Dieters MJ, White TL, Littell RC, Hodge GR (1995) Application of approximate variances of variance components and their ratios in genetic tests. Theoretical and Applied Genetics 91, 15-24.
| Crossref | Google Scholar |
Drackley JK (1999) Biology of dairy cows during the transition period: the final frontier? Journal of Dairy Science 82(11), 2259-2273.
| Crossref | Google Scholar |
Duve LR, Weary DM, Halekoh U, Jensen MB (2012) The effects of social contact and milk allowance on responses to handling, play, and social behavior in young dairy calves. Journal of Dairy Science 95(11), 6571-6581.
| Crossref | Google Scholar |
Edgar J, Held S, Jones C, Troisi C (2016) Influences of maternal care on chicken welfare. Animals 6(1), 2.
| Crossref | Google Scholar |
Engstrom M, Sanchez W, Stone W, St-Pierre NR (2010) Applications of population data analysis in on-farm dairy trials. Journal of Animal Science 88(suppl_13), E25-E31.
| Crossref | Google Scholar |
Field LA, Hemsworth LM, Jongman E, Patrick C, Verdon M (2023a) Contact with mature cows and access to pasture during early life shape dairy heifer behaviour at integration into the milking herd. Animals 13(13), 2049.
| Crossref | Google Scholar |
Field L, Hemsworth LM, Jongman E, Hunt I, Verdon M (2023b) Observations on the effects of non-maternal adult contact on the behavioural patterns of pre-weaned dairy heifers. Animal Production Science 63(7), 652-663.
| Crossref | Google Scholar |
Field L, Verdon M, Jongman E, Hemsworth L (2024a) A survey of stockperson attitudes and youngstock management practices on Australian dairy farms. Animal Production Science 64, AN23249.
| Crossref | Google Scholar |
Field L, Hemsworth L, Jongman E, McGill D, Verdon M (2024b) Early-life contact with non-maternal adult cows and a pasture-based rearing environment influence behavioural responses of dairy heifers to novelty. Animal Welfare 33, e18.
| Crossref | Google Scholar |
Fukasawa M, Tsukada H, Kosako T, Yamada A (2008) Effect of lactation stage, season and parity on milk cortisol concentration in Holstein cows. Livestock Science 113(2–3), 280-284.
| Crossref | Google Scholar |
Garcia SC, Holmes CW (2001) Lactation curves of autumn- and spring-calved cows in pasture-based dairy systems. Livestock Production Science 68(2–3), 189-203.
| Crossref | Google Scholar |
Gellrich K, Sigl T, Meyer HHD, Wiedemann S (2015) Cortisol levels in skimmed milk during the first 22 weeks of lactation and response to short-term metabolic stress and lameness in dairy cows. Journal of Animal Science and Biotechnology 6, 31.
| Crossref | Google Scholar |
Gibb MJ, Irvings WE, Dhanoa MS, Sutton JD (1992) Changes in body components of autumn-calving Holstein-Friesian cows over the first 29 weeks of lactation. Animal Production 5(3), 339-360.
| Crossref | Google Scholar |
Harder I, Stamer E, Junge W, Thaller G (2019) Lactation curves and model evaluation for feed intake and energy balance in dairy cows. Journal of Dairy Science 102(8), 7204-7216.
| Crossref | Google Scholar |
Hedlund L, Løvlie H (2015) Personality and production: nervous cows produce less milk. Journal of Dairy Science 98(9), 5819-5828.
| Crossref | Google Scholar |
Keown JF, Everett RW, Empet NB, Wadell LH (1986) Lactation curves. Journal of Dairy Science 69(3), 769-781.
| Crossref | Google Scholar |
Kondo S, Hurnik JF (1990) Stabilization of social hierarchy in dairy cows. Applied Animal Behaviour Science 27(4), 287-297.
| Crossref | Google Scholar |
Lévy F, Melo AI, Galef BG, Jr, Madden M, Fleming AS (2003) Complete maternal deprivation affects social, but not spatial, learning in adult rats. Developmental Psychobiology 43(3), 177-191.
| Crossref | Google Scholar |
McNamara S, Murphy JJ, O’Mara FP, Rath M, Mee JF (2008) Effect of milking frequency in early lactation on energy metabolism, milk production and reproductive performance of dairy cows. Livestock Science 117(1), 70-78.
| Crossref | Google Scholar |
Mellor DJ (2017) Operational details of the five domains model and its key applications to the assessment and management of animal welfare. Animals 7(8), 60.
| Crossref | Google Scholar |
Morton JD, McBride SD (2004) Drying-off thinner cows earlier in late lactation – is it beneficial? Proceedings of the New Zealand Grassland Association 66, 177-181.
| Google Scholar |
Mullins IL, Truman CM, Campler MR, Bewley JM, Costa JHC (2019) Validation of a commercial automated body condition scoring system on a commercial dairy farm. Animals 9(6), 287.
| Crossref | Google Scholar |
Oksanen L (2001) Logic of experiments in ecology: is pseudoreplication a pseudoissue? Oikos 94(1), 27-38.
| Crossref | Google Scholar |
Phillips CJC, Rind MI (2001) The effects on production and behaviour of mixing uniparous and multiparous cows. Journal of Dairy Science 84, 2424-2429.
| Crossref | Google Scholar |
Phipps AJ, Beggs DS, Murray AJ, Mansell PD, Pyman MF (2018) A survey of northern Victorian dairy farmers to investigate dairy calf management: calf-rearing practices. Australian Veterinary Journal 96(4), 107-110.
| Crossref | Google Scholar |
Proudfoot KL, Huzzey JM (2022) A first time for everything: the influence of parity on the behavior of transition dairy cows. JDS Communications 3, 467-471.
| Crossref | Google Scholar |
Pryce JE, Coffey MP, Simm G (2001) The relationship between body condition score and reproductive performance. Journal of Dairy Science 84(6), 1508-1515.
| Crossref | Google Scholar |
Roche JR, Dillon PG, Stockdale CR, Baumgard LH, VanBaale MJ (2004) Relationships among international body condition scoring systems. Journal of Dairy Science 87(9), 3076-3079.
| Crossref | Google Scholar |
Roche JR, Berry DP, Kolver ES (2006) Holstein-Friesian strain and feed effects on milk production, body weight, and body condition score profiles in grazing dairy cows. Journal of Dairy Science 89(9), 3532-3543.
| Crossref | Google Scholar |
Roche JR, Lee JM, Macdonald KA, Berry DP (2007) Relationships among body condition score, body weight, and milk production variables in pasture-based dairy cows. Journal of Dairy Science 90(8), 3802-3815.
| Crossref | Google Scholar |
Selye H (1976) Forty years of stress research: principal remaining problems and misconceptions. Canadian Medical Association Journal 115(1), 53-56.
| Google Scholar |
Sgorlon S, Fanzago M, Guiatti D, Gabai G, Stradaioli G, Stefanon B (2015) Factors affecting milk cortisol in mid lactating dairy cows. BMC Veterinary Research 11, 259.
| Crossref | Google Scholar |
Shutt DA, Fell LR (1985) Comparison of total and free cortisol in bovine serum and milk or colostrum. Journal of Dairy Science 68(7), 1832-1834.
| Crossref | Google Scholar |
Stafford KJ, Gregory NG (2008) Implications of intensification of pastoral animal production on animal welfare. New Zealand Veterinary Journal 56(6), 274-280.
| Crossref | Google Scholar |
Stein DR, Allen DT, Perry EB, Bruner JC, Gates KW, Rehberger TG, Mertz K, Jones D, Spicer LJ (2006) Effects of feeding propionibacteria to dairy cows on milk yield, milk components, and reproduction. Journal of Dairy Science 89(1), 111-125.
| Crossref | Google Scholar |
Tempelman RJ (2009) Invited review: assessing experimental designs for research conducted on commercial dairies. Journal of Dairy Science 92(1), 1-15.
| Crossref | Google Scholar |
Van Reenen CG, Van der Werf JTN, Bruckmaier RM, Hopster H, Engel B, Noordhuizen JPTM, Blokhuis HJ (2002) Individual differences in behavioral and physiological responsiveness of primiparous dairy cows to machine milking. Journal of Dairy Science 85(10), 2551-2561.
| Crossref | Google Scholar |
Veissier I, Gesmier V, Le Neindre P, Gautier JY, Bertrand G (1994) The effects of rearing in individual crates on subsequent social behaviour of veal calves. Applied Animal Behaviour Science 41(3–4), 199-210.
| Crossref | Google Scholar |
Verdon M (2023) A review of factors affecting the welfare of weaned replacement heifers in pasture-based dairy production systems. Animal Production Science 63(8), 723-741.
| Crossref | Google Scholar |
Verdon M, Rawnsley R, Raedts P, Freeman M (2018) The behaviour and productivity of mid-lactation dairy cows provided daily pasture allowance over 2 or 7 intensively grazed strips. Animals 8(7), 115.
| Crossref | Google Scholar |
Verdon M, Langworthy A, Rawnsley R (2021) Virtual fencing technology to intensively graze lactating dairy cattle. II: effects on cow welfare and behaviour. Journal of Dairy Science 104(6), 7084-7094.
| Crossref | Google Scholar |
Verkerk GA, Phipps AM, Carragher JF, Matthews LR, Stelwagen K (1998) Characterization of milk cortisol concentrations as a measure of short-term stress responses in lactating dairy cows. Animal Welfare 7(1), 77-86.
| Crossref | Google Scholar |
Von Keyserlingk MAG, Olenick D, Weary DM (2008) Acute behavioral effects of regrouping dairy cows. Journal of Dairy Science 91(3), 1011-1016.
| Crossref | Google Scholar |
Wagner K, Barth K, Palme R, Futschik A, Waiblinger S (2012) Integration into the dairy cow herd: Long-term effects of mother contact during the first twelve weeks of life. Applied Animal Behaviour Science 141(3–4), 117-129.
| Crossref | Google Scholar |
Wagner K, Barth K, Hillmann E, Palme R, Futschik A, Waiblinger S (2013) Mother rearing of dairy calves: Reactions to isolation and to confrontation with an unfamiliar conspecific in a new environment. Applied Animal Behaviour Science 147(1–2), 43-54.
| Crossref | Google Scholar |
Wagner K, Seitner D, Barth K, Palme R, Futschik A, Waiblinger S (2015) Effects of mother versus artificial rearing during the first 12 weeks of life on challenge responses of dairy cows. Applied Animal Behaviour Science 164, 1-11.
| Crossref | Google Scholar |
Wathes DC, Fenwick M, Cheng Z, Bourne N, Llewellyn S, Morris DG, Kenny D, Murphy J, Fitzpatrick R (2007) Influence of negative energy balance on cyclicity and fertility in the high producing dairy cow. Theriogenology 68(1), S232-S241.
| Crossref | Google Scholar |
Wathes DC, Brickell JS, Bourne NE, Swali A, Cheng Z (2008) Factors influencing heifer survival and fertility on commercial dairy farms. Animal 2(8), 1135-1143.
| Crossref | Google Scholar |