

Australian cattle herd: a new perspective on structure, performance and production
Geoffry Fordyce A E , Richard Shephard B , Tim Moravek C and Michael R. McGowan D
A The University of Queensland, Queensland Alliance for Agriculture and Food Innovation, PO Box 976, Charters Towers, Qld 4072, Australia.
B Herd Health Pty Ltd, 65 Beet Road, Maffra, Vic. 3860, Australia.
C Department of Agriculture and Fisheries, PO Box 6014, Red Hill Rockhampton, Qld 4701, Australia.
D The University of Queensland, Gatton, Qld 4343, Australia.
E Corresponding author. Email: g.fordyce@uq.edu.au
Animal Production Science - https://doi.org/10.1071/AN20342
Submitted: 4 June 2020 Accepted: 16 February 2021 Published online: 19 April 2021
Journal Compilation © Journal compilation © CSIRO 2021 Open Access CC BY 2021 Open Access CC BY-NC-ND
Abstract
Context: Businesses within the Australian cattle industries and associated research and advisory agencies require accurate data on production and performance of the national herd. Currently, these are derived from survey and statistical data; the latter is expected to be accurate, but the former needs to be tested in view of information suggesting significant under-reporting.
Aims: The research aimed to define the structure, performance and liveweight production of the Australian cattle herd and describe changes in reproduction, growth and survival over the past 40–50 years.
Methods: Interactive static herd modelling of beef and dairy herds was reconciled each year from 1976 to 2018, using slaughter and live export statistics and surveyed dairy cow numbers. A principle applied was that model performance should dictate input variables, moderating information derived from publications and professional opinion.
Key results: The Australian cattle herd fluctuated in size till the mid-1980s from when it settled into a range of 30–40 million beef cattle (12–16 Mt), exceeding survey data by 56–75%. The dairy herd remained at ~10% of the beef herd. Despite consistent herd size, productivity of the cattle herd increased from ~2.5 to 4.5 Mt of liveweight annually over 35 years. Half of this change was due to reductions in mortality, though ~1 million post-weaning-age cattle still die annually, in addition to >0.5 million calves from birth to weaning. Approximately a quarter each of the change was due to increased reproductive output and to steer growth. Liveweight production per beef animal increased from 70–75 kg/year to 130–135 kg/year, while liveweight production ratio increased by 0.08 and 0.12 kg/kg of cattle in male and female beef cattle respectively, to reach 0.31 kg/kg of cattle.
Conclusions: The main conclusion is the size, performance, production and productivity of the Australian cattle herd are quite different from that determined from surveys. Also, there is an on-going opportunity to derive benefit from improving cattle survival, reproduction and growth and from improving the feed base.
Implications: This research may have large impact on priorities for Australian beef business and associated environmental management. It is recommended that surveys be used to derive relative values to use in combination with absolute statistical data to derive accurate herd measures.
Keywords: calf wastage, lactation rate.
Introduction
Government and industry priorities for research and advisory activities are typically based on analysis of a system to identify opportunities and problems. For the Australian beef industry over the past 50 years, this has been based on analyses using limited statistics (primarily slaughter and live export data), survey data (primarily herd structure and performance data) and issues identified by businesses and research. An example of the latter is the very large ‘Cash Cow’ project, which defined prevailing performance and production of breeding cattle in northern Australia, highlights of which included very large variation in all measures, and high overall wastage of calves between confirmed pregnancy and weaning (McGowan et al. 2014). Several recent situation analyses such as that by McLean et al. (2014) have been published on the northern beef industry, highlighting a broad range of problems and opportunities. Although these are expected to be accurate, they are based on data from a sample of businesses only, and therefore cannot define whole-of-industry performance.
The veracity of much information describing the overall Australian cattle industry is unclear. There has been no analysis of liveweight production of cattle in Australia over an extended period. For example, during the 2012–2019 dry period, large numbers of cattle continued to be sold and slaughtered in contrast to survey data suggesting such numbers would not be available. In the period before 2000, anecdotes were very common about the discovery of large numbers of previously unaccounted-for cattle on newly purchased cattle properties in northern Australia. Indeed, it was almost ‘traditional’ in the 19th and 20th centuries to finance a new acquisition using this method. Smith et al. (2001) reported an average liveweight production ratio of 0.25–0.28 kg/kg of cattle over 4 years in a well managed low-input breeding herd in a low-nutrition environment where yearling growth averages 105 kg/year (McLennan 2014; Fordyce and Chandra 2019). More recently in a range of representative northern Australian environments, which has over 60% of the Australian beef herd (Australian Bureau of Statistics (ABS) 2020), Fordyce et al. (2021a) reported an average liveweight production ratio of 0.31–0.32 kg/kg of cattle for well managed breeding cattle over their lifetime, with a maximum achievable in high-productivity regions of ~0.42 kg/kg cattle (McGowan et al. 2014). The Australian cattle herd, which surveys suggest is at ~27 million, has been producing around 4.5 Mt of liveweight annually (2013–2018; ABS 2020). Assuming an average animal liveweight of 400 kg, the calculated liveweight production ratio of 0.42 kg/kg of cattle is well above expectation. This all suggests there may be chronic and substantial under-reporting in surveys of cattle numbers in Australia.
Another major question is what is the impact of new beef management systems on business performance? Such questions can be answered only if accurate industry data are available. The only accurate data available for the beef industry are numbers and weight of cattle (both beef and dairy) slaughtered and exported live. Therefore, the objective of the present study was to define the structure, performance and liveweight production of the Australian cattle herd over the past 40–50 years using slaughter and live export data.
Materials and methods
General
An interactive steady-state herd spreadsheet (Microsoft Excel) model was constructed to input published statistical data and calculate Australian cattle numbers and performance and production indices in the 1976–2018 period through reconciling reported inputs and outputs (Fig. 1). Beef is produced by both beef and dairy cattle herds, therefore requiring data from both to be incorporated. The model was constructed to calculate herd performance and production on an annual basis, without linking data from one year to the next. The primary reason for this was that the analyses worked backwards from known production, which did not allow output from one year to directly inform the next. Another major reason for using this approach was to avoid compounding error. Markets and seasonal conditions are both highly variable and leave little room for finesse in the modelling based on very limited reliable statistical data. As production is the outcome of reproduction, growth and survival and some animals are at least 10 years of age at slaughter, production is the result of what has occurred over the preceding 10 years. Therefore, the selected approach will lack precision, but trends over time will be accurate.

|
The model was constructed at a national level to avoid the complexity associated with interstate movement of cattle. However, fundamental differences in cattle, environments, husbandry systems and markets between northern and southern Australia required modelling of the female beef herd from both regions separately before combining outputs.
The complexity of the model was limited by the data available, which needed to be consistent for the study period. The model was constructed to analyse available data from each year separately. It was constructed to analyse each industry (beef/dairy) × animal sex (female/bull/steer) × age (year) group. Age was defined as birth to weaning, weaning to 1.5 years, 1.5 to 2.5 years, and then adding a year to this for each older age group. For each group, there was a calculation of numbers opening (at the start of a year), mortality, slaughtered, exported live, calves produced, carcass weight of slaughtered and exported cattle, and average liveweight at the start and during the year. Typical herd structure, that is, proportion in each age × sex group, was used for the dairy industry (Sergeant et al. 2005) and the beef industry (Holmes et al. 2011).
Iteration was used to derive inputs that achieved minimal deviation from statistics from the ABS (2020) and published by Meat & Livestock Australia (MLA 2020) and the Australian Lot Feeders Association (ALFA 2020; Table 1), plus dairy cow numbers derived from the ABS (2020) survey; the latter was the one survey-derived variable assumed to have reasonable accuracy. Data available to achieve the objective were available only from 1976 to 2018; for example, for 1970–1975, sex at slaughter was not reported. Model outputs were used to guide inputs. The model could not be reconciled using survey data published by the ABS and the Australian Bureau of Agricultural Resource Economics and Sciences (ABARES 2020); so, other than for dairy cow numbers and some ratios, these data were ignored during analyses and then used for comparison at completion.
|
Derivation of specific input parameters
The basic model structure data were numbers and weights annually × animal class for cattle population, slaughter, live export, feed lotting, weaning and survival. Rates for survival, reproduction and slaughter or live export were derived from reliable sources. In almost all instances, published data for representative animals of the period had to be adjusted using professional opinion derived from recognised industry specialists with experience in Australian beef and dairy cattle performance and production as no other option was available. Above all, the principle applied was that the requirements to reconcile the model should dictate input variables, resulting in changes to most published data and professional opinions. This approach was used for both constant and changing variables (Tables 2, 3). For input variables changing over time, linear and curvilinear changes were assessed in their ability to accurately reconcile the model, with curvilinear change used if it improved prediction over linear change (Table 4).

|

|

|
Six input variables were adjusted to minimise the difference between predicted and reported statistical values, that is, reconcile the model each year. The first stage was to adjust the dairy herd inputs, as follows:
-
Annual slaughter rates of cows were set so that calves weaned matched those entering the herd.
-
Yearling heifers retained was set so that predicted and reported cow numbers matched.
-
Number of bulls kept entire as weaners was set so that bull : female mating ratios matched reported levels.
Beef herd inputs were then adjusted, as follows:
-
Slaughter and export rates of all female classes were adjusted by the same proportion, so that calves weaned matched those entering the herd (Table 3).
-
Calves weaned were adjusted so that predicted and reported slaughter numbers × sex matched.
-
Number of bulls kept entire as weaners was set so that bull : female mating ratios matched reported levels.
Outputs
Performance and production were calculated as described in Table 5. Differences between dairy and beef systems were needed as dairy calves are weaned immediately after birth. Part of the model check was to calculate liveweight production by using two independent methods. One was as described in Table 5. The second method was to calculate for each age × sex group and then sum within sex, as follows: annual liveweight change of those that survived + weaner (calf for dairy) weight produced – weight of mortalities. The model was operating correctly when the methods produced the same result. As predictions of cattle populations and mortalities were much higher than were survey results, attempts were made to reconcile the final model when mortality rate was halved, that is, reducing levels closer to that suggested by survey data.

|
Final values of all statistical and survey-derived parameters used in reconciling the model were tabulated and graphed for presentation.
Final model inputs from 1985, 1995, 2005 and 2015 were adapted for BreedCow (Queensland Government Department of Agriculture and Fisheries 2020), which is a standard system for economic analyses of beef business in Australia. Although BreedCow is not ideal for this analysis, attempts were made to produce outputs for mortalities, herd liveweight, and numbers and weight of males and females slaughtered and exported for comparison with those from the model. Because BreedCow is a well recognised accurate calculator, first it provided a sounding board as an independent check on the model. As well, it determined whether the same output trends occurred and, if so, strengthened main arguments of the paper.
Results
Population
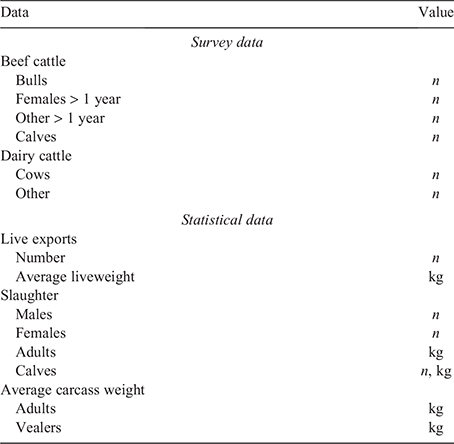
Prediction error of slaughter and live export statistics by the final model was variable, especially in the 1976–1980 period, but averaged 0–2%, except for carcass weight of slaughtered calves, which is minor in absolute terms (Fig. 2). This outcome suggests that other model inputs and outputs have good accuracy.
|
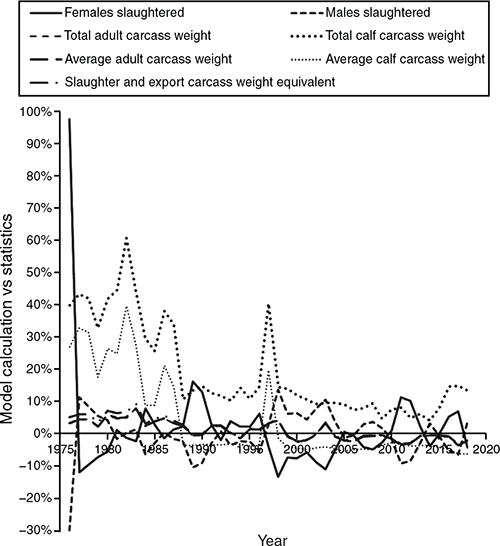
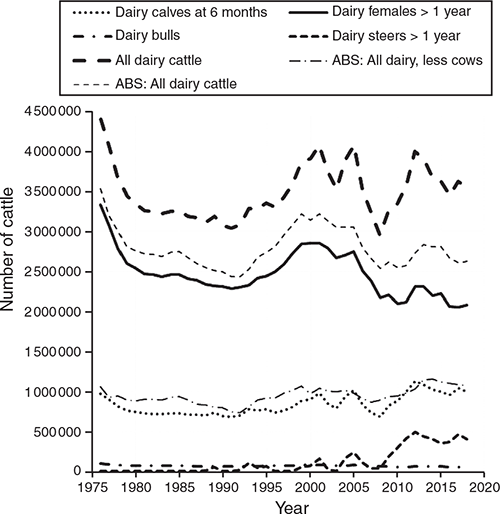
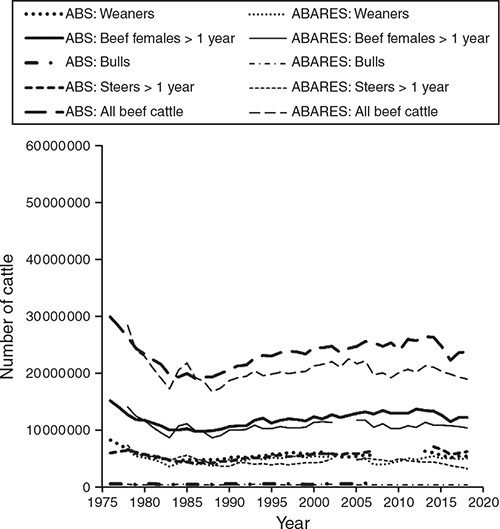
Calculated numbers of total dairy cattle and other dairy cattle exceeded MLA survey data by 25% and 73% respectively (Fig. 3). The calculated numbers of beef cattle exceeded survey data published by both ABS (2020) and ABARES (2020) by an average of 56% and 75% respectively (Figs 4, 5). Estimates of beef cattle numbers averaged 14%, 11%, 27% and 23% higher in ABS surveys for weaners, females >1 year, steers >1 year and bulls respectively, than in ABARES surveys (Fig. 5).
|
|
|
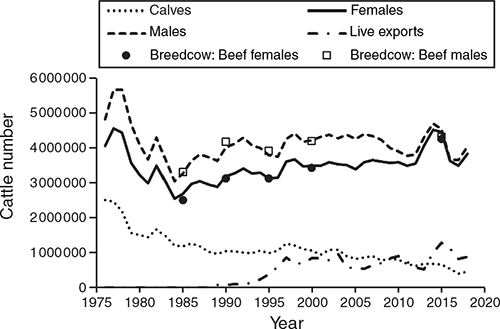
Since 1985, the total calculated Australian beef cattle herd varied in the range of 30–40 million, with an average of 9.8 million calves weaned annually from 18.6 million females over 1 year of age that are mated to 0.9 million bulls. In addition, there was an average of 5.6 million steers over 1 year of age in the national beef herd.
In the dairy industry, the long-term average herd size has been 3.5 million cattle, with 2.5 million of these being females aged over 1 year, 0.07 million are bulls, 0.8 million are dairy calves older than 6 months of age, and 0.1 million are dairy steers.
Reproduction
Over the study period, lactation rate of the national beef herd increased from 61% to 72%. In southern Australia, lactation rate (Table 5) increased from 74% to 85%. In northern Australia, lactation rate increased from 45% to 72%. In the same period, ABARES (2020) surveys suggested that national branding rates, a surrogate for lactation rate, varied between 70% and 80%.
Mortality
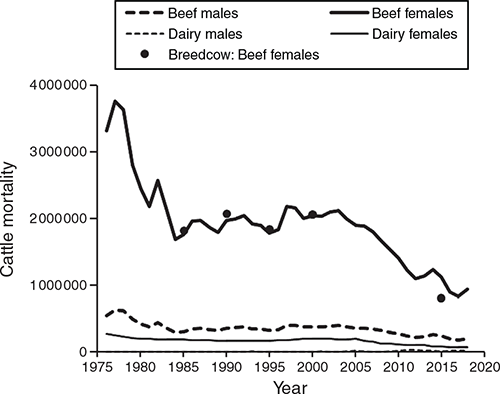
The input variables used to reconcile the model suggested that mortality of calves between birth and 6 months of age consistently exceeds 0.5 million annually.
Annual post-weaning-age mortalities dropped from ~4.5 million (~1.5 Mt liveweight) to 2.2 million (~0.9 Mt liveweight) between 1976 and 1985, where it remained steady till 2005, from which point it dropped to an estimated 1.2 million (0.4 Mt of liveweight) by 2015 (Fig. 6). An average of 9% of the loss was calculated to have occurred in the dairy cattle herd. Over the study period, the average liveweight loss per mortality was 355 kg. Calculated annual beef herd morality reduced from 7.8% in the mid-1970s to 6.5% by the mid-1900s, and from the mid-2000s to 3.6% by the late 2010s. Calculated annual dairy herd mortalities have consistently been ~90% of that in the beef herd. ABARES (2020) surveys suggested mortalities were ~5% in the mid-1970s, decreasing to 2–3% by 1990 and remaining there.
|
Growth
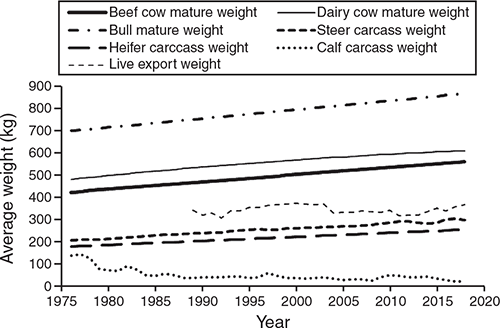
Liveweights at maturity and slaughter of beef cattle increased by approximately one-third in the 1976–2018 period (Fig. 7); for example, for cow mature liveweight, the calculated increase was almost 140 kg. The increase for dairy cow mature liveweight was estimated to be 27% in this period. Average liveweights at export remained in the 300–350 kg range, as required by prevailing markets. Likewise, average calf carcass weight remained in the 40–60 kg range.
|
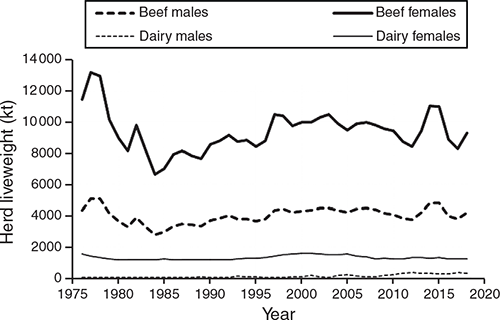
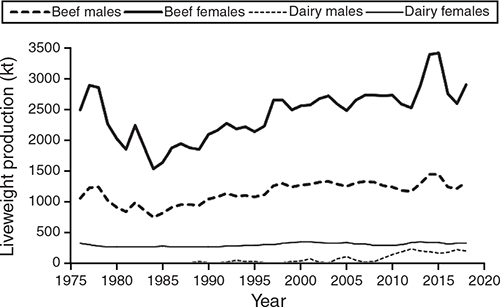
After dropping from high to low levels between the mid-1970s and mid-1980s, total beef herd liveweight then rose steadily until the late 1990s, from when it stabilised at ~14 Mt (Fig. 8). From 1997, the female and male beef herd liveweights averaged 9.8 and 4.3 Mt respectively. Dairy female and male herd weights averaged 1.4 and 0.2 Mt respectively, over 1997–2018 (Fig. 8).
|
Average age at slaughter or live export of beef females reduced from 5.8 to 4.8 years over the study period, and from 4.3 to 3.7 years for dairy females. Slaughter or live export average age remained constant for beef steers at ~1.8 years. It increased from close to zero to about 1 year of age for dairy male cattle.
Production
Numbers of cattle slaughtered and exported live also dropped from high levels between 1976 and 1984 (Fig. 9). The number of male cattle slaughtered then quickly rose and stabilised at about ~4.1 million annually. From 1976 to 1984, females slaughtered fell from ~4.5 million to ~2.5 million, and then, subsequently, gradually rose over 30 years to ~4 million annually. Live exports rose from negligible levels in 1990 to average ~0.8 million between 1997 and 2018. Over the study period, calf slaughter fell from 2.5 million to ~0.5 million.
|
Annual liveweight production of Australian female beef cattle decreased from ~2.5 to ~1.5 Mt between the mid-1970s and 1984. The 1976–1984 decrease for male liveweight production was from ~1.2 to 0.8 Mt annually. From then, over the next 35 years, female beef cattle production doubled and male beef cattle production increased by 50% (Fig. 10). Up till the last 10 years of the study period, annual liveweight production of dairy cattle has averaged ~0.3 Mt, most of which was due to female cattle. In the last 10 years of the study, dairy male liveweight production contributed extra production in excess of 0.1 Mt annually.
|
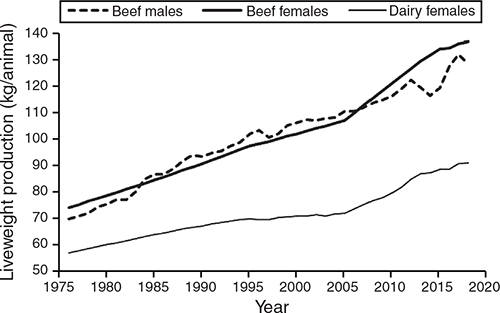
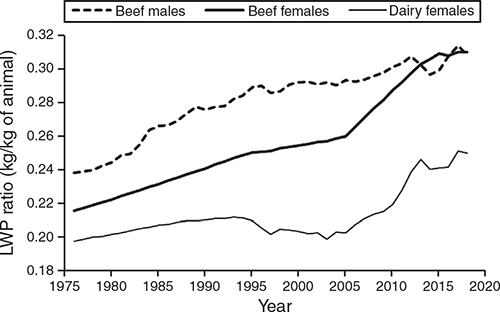
During the 1976–2018 period, average annual liveweight production of Australian beef cattle has steadily increased from 70–75 kg/animal to 130–135 kg/animal (Fig. 11). Average annual female dairy cattle liveweight production increased from 60 to 90 kg/animal. Liveweight production of male dairy cattle was generally negative before 2000; from this time, it was in the same order as for male beef cattle, but highly variable. In the same period, liveweight production ratio increased by 0.12 kg/kg of cattle (45%) in female beef cattle, and by 0.08 kg/kg of cattle (29%) in male beef cattle (Fig. 12) to reach 0.31 kg/kg of cattle. In the same period, efficiency of production increased by 0.05 kg/kg cattle in dairy females (Fig. 12).
|
|
Model check
Input data derived for 5 years transferred into BreedCow (Queensland Government Department of Agriculture and Fisheries 2020) calculated, on average, the same post-weaning-age populations of female and male cattle as did the research model (Fig. 4). The same matching occurred for beef female mortalities (Fig. 6) and both beef female and beef male slaughter and export numbers (Fig. 9) and total weights. Reliable total beef male mortalities and herd liveweights were difficult to produce from BreedCow.
Attempts to reconcile the model by halving mortality rate were unsuccessful. The primary outcomes were as follows: the difference between calculated and survey numbers of beef cattle more than halved; the calculated dairy herd increased by a third; and, the numbers of female to male cattle slaughtered increased and reduced by a fifth; for example, the overestimate of females slaughtered was as high as 1 million, similar to underestimates for slaughtered male cattle.
Discussion
The present study has produced a new perspective on performance and production of the Australian cattle herd. A primary outcome is demonstrating that the Australian beef cattle herd has been at 30–40 million and averaged 35 million cattle weighing ~12–16 Mt and averaging 14 Mt for the past 35 years. The dairy herd has fluctuated at ~10% of the beef herd. Fordyce et al. (2021a) reported a liveweight production ratio of 0.31–0.32 for well managed breeding cattle groups grazing the primary country types of northern Australia. This is just above the value calculated for the national herd at the same time. This result is primary corroborating evidence that the only way for the national herd to produce the reported slaughter weight and liveweight at live export is to have a much-larger herd than that suggested by surveys (ABARES 2020; ABS 2020). Production of the same predictions for the Australian beef herd performance and production using BreedCow (Queensland Government Department of Agriculture and Fisheries 2020) strongly supports the accuracy of calculations in this study. The inability to construct a model using herd sizes derived from surveys, even when performance parameters are varied greatly, is further evidence that the calculations reported here are accurate.
Means from the broad modelling method used were expected to be accurate across years, although they lack precision; that is, there is recognised error, but longer-term trends will be true. For example, in the drought period from mid-2012, calculated herd size initially increased and then decreased, presumably in response to livestock selling as the seasonal situation deteriorated, but over a 5-year period, the herd size remained close to the long-term trend averaging 35 million cattle. A primary source of error is modelling the liveweight harvest for 1 year, which is the sum of performance in the preceding 10 years. A second source is the application of consistent inputs that allow the model to reconcile but do not accommodate year-to-year variation for specific classes of animal in how they may be marketed, for example. Even so, the patterns of animal numbers for each class of animal closely match those of surveys; this further supports accuracy of the method and that under-reporting is similar for many classes of cattle.
It was expected the size of the herd would exceed surveys (ABARES 2020; ABS 2020) as strong anecdotal evidence is that beef businesses consistently under-report the size of their herds. The consistent substantial under-estimates of cattle populations by both ABS and ABARES surveys (36% and 43% respectively, since 1980) have demonstrated the need for survey agencies to ‘apply truth serum’ to their survey data. It is recommended that robust models be developed that use known statistics to adjust survey data. The basic method used in the present research has been in use for at least 35 years (Wicksteed 1986) and is a standard strategy used by business analysts and economists to understand beef business they advise in the absence of any reliable data other than sales. The power of suitable modelling shown in the present study indicates the need for full surveys may be obviated if accurate data for slaughter and live export of cattle continues to be available. Surveys remain valuable in defining relative rather than absolute values. The precision of the modelling used here was limited by no records being available of sex × liveweight differences in cattle exported live. If this could be introduced in some form, it would further increase the accuracy of any herd performance and production calculations.
It should be no surprise that the Australian cattle herd has remained within a consistent range for many years. The size of herds is limited by feed available. Unless feed resources change significantly and cost-effectively, it is not possible to increase the herd size. In the 1970s, wild fluctuations occurred in the beef herd, which peaked near a calculated 60 million cattle, in contrast to surveyed peak herd size of 34 million (ABS 2020). This reflected extreme market conditions, that is, failure of Australia’s main beef market (USA), which caused producers to hold cattle from sale for several years. The huge increase in herd size was possible because the mid-1970s was close to the wettest period in Australia’s past 130 years, thus providing feed to sustain extra cattle. Price recovery in 1978 was associated with a major sell-off of cattle, which was potentiated by drought conditions that worsened till El Nino conditions dissipated in mid-1983, from which point there was recovery to a sustainable herd size. It is interesting to note that in the dry early 1980s when herd size fell below 30 million, calculated mortalities did not drop to the same degree below the level it was to track at (~2 million/year) for the next 20 years; that is, the dry years contributed to a higher mortality rate.
Even though the Australian herd size has remained in a constant range, annual liveweight production has steadily increased to be ~2 Mt, that is, ~80%, higher than in the mid-1980s. Over the period, calculated annual mortalities, which are dominated by females, have reduced lost production by ~1 Mt annually, which explains half of the change. At the same time, calculated reproductive rates and calf weights from the national herd have steadily increased, increasing weaner production by approximately a third, that is, ~0.5 Mt, which explains most of the balance of change in female production. Therefore, changes in growth explain a quarter of the production gain, which was confirmed by increased annual liveweight gain by steers being ~0.5 Mt. The low contribution of average annual female cattle growth to national herd liveweight production, because many are slaughtered well beyond maturity and this class contributes most mortalities, indicates that most of the benefit of their higher juvenile growth is through impact on male progeny growth.
Consistent increases in total production, in production per animal and in production efficiency must reflect changes in business practices, providing vindication to the enterprise of government and commercial agencies supporting business change. Even though there have been consistent improvements in Australia’s cattle herd performance, production and efficiency over many years, the opportunity to increase further appears substantial. This is highlighted by average annual liveweight production per animal being >40 kg lower than annual juvenile animal growth. Liveweight production per animal is higher than annual juvenile cattle growth in an efficient situation. For example, Fordyce et al. (2021a) found that liveweight production per animal in four well managed north Australian breeding herds matched or exceeded average annual juvenile cattle growth. Similarly, well managed breeding cattle in a southern Australian environment in which yearling growth exceeded 200 kg, achieved liveweight production of ~240 kg/animal at an efficiency of 0.37 kg/kg of cattle (Anderton et al. 2018; Copping et al. 2018). Long et al. (1975) also demonstrated that well managed cattle herds in the USA where average annual juvenile growth approaches 300 kg, have liveweight production in the vicinity of 350 kg/cow.
The relative contributions of mortality (about half), reproduction and growth (about a quarter each) to continually increasing national production are a clear guide that improving each will continue to improve production and efficiency. Clearly, cattle mortality has been, and continues to be, the most important limitation to beef production in Australia. The scale of annual mortalities, especially in female cattle, corroborates a separate, although similar, analysis, which also indicated annual mortalities of ~1 million post-weaning-age cattle in Australia (Fordyce et al. 2021b). Although mortalities appear excessive across the nation, these authors and others (Henderson et al. 2013) indicated that the primary contributor to the problem is mortalities of female cattle in northern Australia. If prevailing losses of post-weaning-age beef cattle and in excess of 0.5 million calves annually can be halved, production may increase by >0.2 Mt, which at prevailing cattle values equates to an extra AU$0.5 billion farm income nationally. Strategies to further reduce mortalities of calves are likely to also reduce mortalities in older cattle, and vice versa, as they are inextricably linked (McGowan et al. 2017).
In addition to extra production, reducing mortalities will create substantial benefits in herd efficiencies and greenhouse-gas emissions (estimates of which may need revision in view of the herd being 40% larger than realised) through reduced loss of liveweight whose production has also incurred emissions. These benefits will be further improved by development and implementation of management, nutrition and genetics that enable more efficient conversion of available feed to liveweight, and, therefore, a higher liveweight production ratio, for example, females that can conceive more readily and are less prone to large annual fluctuations in liveweight and body condition.
It is interesting to speculate about what has driven the changes over the past 50 years in the Australian cattle industry, as this may affect structure and application of industry support services. For example, increases in cattle growth and mature weights are likely to be primarily a function of genetics and feedlots. Large reductions in mortalities and improved beef cattle reproduction may primarily be a function of improved management and nutrition, for example, infrastructure development including secure fences and waters, better weaning practices, improved disease control, better transport systems, and ever-improving access to supplementary feeds that are being applied in a more targeted manner. The long-term relative stability of the herd size and liveweight suggests that there has been no major long-term change to the feed base. Even if the opportunity is low to cost-effectively increase the feed base, strategies that preserve cost-effective feed production are vital in sustaining national cattle liveweight production.
The need for accurate data is vital to determine the rates of change in herd performance and production and the potential opportunities for improvement; this is pertinent for both business management and for research and advisory services investment. New methods to more accurately monitor the Australian herd should include analyses within jurisdictions and sectors, which was not attempted for the study reported here because of insufficient data being available to achieve this. Targeted information is required to drive future analytical methods. If the use of survey and statistical data can be transformed to accurately define prevailing levels and trends for multiple indices at the production-zone level, this provides a reference point for business evaluation. It has been standard practice to use statistical regions for presenting data and indices. Although this information is useful for population monitoring, it has limited value as a performance and production reference. To overcome this, a simple recommendation emanating from the Cash Cow project (McGowan et al. 2014) is that surveyed businesses be categorised using average annual yearling growth, rather than geographical categories such as vegetation and or soil (Fordyce et al. 2021a), and that analyses be based on data within these categories within state or territory. Analyses at a business level within category would introduce variation measures that would greatly enhance the reference points. This recommendation would simplify the process of ‘bench marking’ used in the cattle industry, by providing reliable and useful reference values that do not currently exist.
The method used in the present research exposes the reality of the prevailing situation and has shown that component research is limited in its ability to portray whole-of-industry perspectives. The high cost of objective industry-scale research to define performance and production almost preludes large long-term projects, an exception being the recent ‘Cash Cow’ project (McGowan et al. 2014). Data from that unique study, which defined the northern Australian situation, was invaluable for the current research, and, through that, the situation that is likely to prevail in southern Australia has been better defined. In addition, component research is often conducted on dedicated research stations where inputs and controls generally exceed those affordable in commercial situations, which elevates cattle performance and production, although still producing perfectly valid principles.
Expression of cattle performance and production within the industry also needs reassessment. The recommendation is to work from the simple concept that earnings before interest and tax are the product of production and product value less costs. In some cases, change in performance may be associated with no change in production and an increase in costs, thus reducing earnings before interest and tax. Attention to performance as a proxy for production is inappropriate when the link between the two is not defined. In relation to this, another expression issue is the use of percentages rather than absolute numbers. In the first instance, percentages are used for many performance measures that may or may not relate directly to profit, whereas absolute values as used in production can have more direct association with profit. A further issue with percentages is that they provide a perception that partially masks the scale of a problem or opportunity; for example, suggesting a strategy to reduce mortality by 2% could increase profit is less powerful to a business carrying 3000 cattle than stating that 60 fewer annual deaths of cattle weighing 350 kg will increase live production, and, therefore, annual sales, by ~20 t.
The main conclusion from the present research is that the size, performance and productivity of the Australian cattle herd are quite different from those portrayed by survey data, and that this can be altered by implementing alternate survey methods to combine with accurate statistics and more accurately derive existing herd parameters. The research also identified an on-going opportunity to derive benefit from improving cattle survival, reproduction and growth and from sustaining and improving the feed base.
Conflicts of interest
The authors declare no conflicts of interest.
Acknowledgements
This research did not receive any specific funding.
References
Anderton L, Accioly JM, Copping KJ, Deland PB, Hebart ML, Herd RM, Jones FM, Laurence M, Lee SJ, Speijers EJ, Walmsley BJ, Pitchford WS (2018) Divergent genotypes for fatness or residual feed intake in Angus cattle. 7. Low-fat and low-RFI cows produce more liveweight and better gross margins than do high-fat and high-RFI cows when managed under the same conditions. Animal Production Science 58, 103–116.| Divergent genotypes for fatness or residual feed intake in Angus cattle. 7. Low-fat and low-RFI cows produce more liveweight and better gross margins than do high-fat and high-RFI cows when managed under the same conditions.Crossref | GoogleScholarGoogle Scholar |
Australian Bureau of Agricultural and Resource Economics and Sciences (ABARES) (2020) Farm survey data for the beef, slaughter lambs and sheep industries. Available at https://www.agriculture.gov.au/abares/research-topics/surveys/farm-survey-data [Verified 23 March 2021]
Australian Bureau of Statistics (ABS) (2020) Agriculture. Available at https://www.abs.gov.au/Agriculture [Verified 9 March 2021]
Australian Lot Feeders Association (ALFA) (2020) Industry figures. Available at https://www.feedlots.com.au/figures [Verified 9 March 2021]
Copping KJ, Accioly JM, Deland PB, Edwards NJ, Graham JF, Hebart ML, Herd RM, Jones FM, Laurence M, Lee SJ, Speijers EJ, Pitchford WS (2018) Divergent genotypes for fatness or residual feed intake in Angus cattle. 3. Performance of mature cows. Animal Production Science 58, 55–66.
| Divergent genotypes for fatness or residual feed intake in Angus cattle. 3. Performance of mature cows.Crossref | GoogleScholarGoogle Scholar |
Fordyce G, Chandra K (2019) Growth of Beefmaster heifers to two years of age in the dry tropics. Animal Production Science 59, 148–159.
| Growth of Beefmaster heifers to two years of age in the dry tropics.Crossref | GoogleScholarGoogle Scholar |
Fordyce G, Saithanoo S, Goddard ME (1988) Factors affecting mature size and dry-season weight loss in Bos indicus cross cows in north Queensland. Australian Journal of Agricultural Research 39, 1169–1180.
| Factors affecting mature size and dry-season weight loss in Bos indicus cross cows in north Queensland.Crossref | GoogleScholarGoogle Scholar |
Fordyce G, Tyler R, Anderson VJ (1990) Effect of reproductive status, body condition and age of Bos indicus cross cows early in a drought on survival and subsequent reproductive performance. Australian Journal of Experimental Agriculture 30, 315–322.
| Effect of reproductive status, body condition and age of Bos indicus cross cows early in a drought on survival and subsequent reproductive performance.Crossref | GoogleScholarGoogle Scholar |
Fordyce G, Anderson A, McCosker KD, Williams PJ, Holroyd RG, Corbet NJ, Sullivan MS (2013) Liveweight prediction from hip height, condition score, fetal age and breed in tropical female cattle. Animal Production Science 53, 275–282.
| Liveweight prediction from hip height, condition score, fetal age and breed in tropical female cattle.Crossref | GoogleScholarGoogle Scholar |
Fordyce G, Barnes TS, McGowan MR, Perkins NR, Smith DR, McCosker KD (2021a) Live weight production of north Australian beef cows. Animal Production Science
| Live weight production of north Australian beef cows.Crossref | GoogleScholarGoogle Scholar |
Fordyce G, McCosker KD, Smith DR, Perkins NR, O’Rourke PK, McGowan MR (2021b) Reproductive performance of northern Australia beef herds. 7. Risk factors affecting mortality rates of pregnant cows. Animal Production Science
| Reproductive performance of northern Australia beef herds. 7. Risk factors affecting mortality rates of pregnant cows.Crossref | GoogleScholarGoogle Scholar |
Henderson A, Perkins N, Banney S (2013) Determining property-level rates of breeder cow mortality in northern Australia. Final report B.NBP.0664. Meat & Livestock Australia, Sydney, NSW, Australia. Available at https://www.mla.com.au/research-and-development/reports/2013/breeder-mortality-determining-property-level-rates-in-northern-australia/# [Verified 9 March 2021]
Hennessy DW, Robinson GG (1979) The herbage intake, eating behaviour and calf production of beef cows grazing improved pastures on the northern tablelands of New South Wales. Australian Journal of Experimental Agriculture and Animal Husbandry 19, 261–268.
| The herbage intake, eating behaviour and calf production of beef cows grazing improved pastures on the northern tablelands of New South Wales.Crossref | GoogleScholarGoogle Scholar |
Holmes WE, Bertram JD, Best M, English BE, Hamlyn-Hill FJ, Jackson DC, Laing AR, Rolfe JW, Stirton A, Sullivan MT, Telford PB, Leigo S, MacDonald N, Oxley T, Schatz T, Huey AM, Jeffery M, Smith PC (2011) Representative herds templates for northern Australia V2.0: data files for BreedCow and Dynama herd budgeting software. FutureBeef. Available at https://futurebeef.com.au/knowledge-centre/representative-herd-templates-for-northern-australia/ [Verified 9 March 2021]
Holroyd RG (1987) Foetal and calf wastage in Bos indicus cross beef genotypes. Australian Veterinary Journal 64, 133–137.
| Foetal and calf wastage in Bos indicus cross beef genotypes.Crossref | GoogleScholarGoogle Scholar | 3632488PubMed |
Holroyd RG (1985) Aspects of reproduction in Bos indicus genotypes. PhD Thesis, James Cook University of North Queensland, Townsville, Qld, Australia.
Holroyd RG, O’Rourke PK, Clarke MR, Loxton ID (1983) Influence of pasture type and supplement on fertility and liveweight of cows, and progeny growth rate in the dry tropics of northern Queensland. Australian Journal of Experimental Agriculture and Animal Husbandry 23, 4–13.
| Influence of pasture type and supplement on fertility and liveweight of cows, and progeny growth rate in the dry tropics of northern Queensland.Crossref | GoogleScholarGoogle Scholar |
Hunter RA, Burrow HM, McCrabb GJ (2001) Sustained growth promotion, carcass and meat quality of steers slaughtered at three liveweights. Australian Journal of Experimental Agriculture 41, 1033–1040.
| Sustained growth promotion, carcass and meat quality of steers slaughtered at three liveweights.Crossref | GoogleScholarGoogle Scholar |
Ladds PW, Summers PM, Humphrey JD (1975) Pregnancy in slaughtered cows in north-eastern Australia. Australian Veterinary Journal 51, 472–477.
| Pregnancy in slaughtered cows in north-eastern Australia.Crossref | GoogleScholarGoogle Scholar | 1200929PubMed |
Long CR, Cartwright TC, Fitzhugh HA (1975) Systems analysis of sources of genetic and environmental variation in efficiency of beef production: cow size and herd management. Journal of Animal Science 40, 409–420.
| Systems analysis of sources of genetic and environmental variation in efficiency of beef production: cow size and herd management.Crossref | GoogleScholarGoogle Scholar |
McGowan MR, McCosker K, Fordyce G, Smith D, O’Rourke PK, Perkins N, Barnes T, Marquet L, Morton J, Newsome T, Menzies D, Burns BM, Jephcott S (2014) North Australian beef fertility project: Cash Cow. Final report, B.NBP.0382. Meat & Livestock Australia, Sydney, NSW, Australia. Available at https://www.mla.com.au/research-and-development/search-rd-reports/final-report-details/Productivity-On-Farm/Northern-Australian-beef-fertility-project-CashCow/370 [Verified 9 March 2021]
McGowan MR, Fordyce G, Smith D, McCosker K, Barnes T, Hegarty R, McNeil D, Perkins N, Miller J, Schooley K, Brodie W, Comiskey R, Lynch D, Murrell G, McClymont A (2017) Development of candidate management interventions to reduce foetal and calf loss in beef herds in northern Australia. Final report, Project B.GBP.0001. Meat & Livestock Australia, Sydney, NSW, Australia. Available at https://www.mla.com.au/research-and-development/search-rd-reports/final-report-details/Development-of-candidate-management-interventions-to-reduce-foetal-and-calf-loss-in-beef-herds-in-northern-Australia/3585 [Verified 9 March 2021]
McLean I, Holmes P, Counsell D (2014) The Northern beef report; 2013 Northern beef situation analysis. Final report, B.COM.0348. Meat & Livestock Australia, Sydney, NSW, Australia. Available at https://www.mla.com.au/research-and-development/search-rd-reports/final-report-details/Productivity-On-Farm/The-Northern-beef-report-2013-Northern-beef-situation-analysis/234 [Verified 9 March 2021]
McLennan SR (2014) Optimising growth paths of beef cattle in northern Australia for increased profitability. Final report, B.NBP.0391. Meat & Livestock Australia, Sydney, NSW, Australia. Available at https://www.mla.com.au/research-and-development/search-rd-reports/final-report-details/Productivity-On-Farm/Optimising-growth-paths-of-beef-cattle-in-northern-Australia-for-increased-profitability/372 [Verified 9 March 2021]
Meat & Livestock Australia (MLA) (2020) Statistics database. Available at http://statistics.mla.com.au/Report/List [Verified 9 March 2021]
Moate PJ, Deighton MH, Williams SRO, Pryce JE, Hayes BJ, Jacobs JL, Eckard RJ, Hannah MC, Wales WJ (2016) Reducing the carbon footprint of Australian milk production by mitigation of enteric methane emissions. Animal Production Science 56, 1017–1034.
| Reducing the carbon footprint of Australian milk production by mitigation of enteric methane emissions.Crossref | GoogleScholarGoogle Scholar |
O’Rourke PK, Entwistle KW, Arman C, Esdale CR, Burns BM (1991) Fetal development and gestational changes in Bos taurus and Bos indicus genotypes in the tropics. Theriogenology 36, 839–853.
| Fetal development and gestational changes in Bos taurus and Bos indicus genotypes in the tropics.Crossref | GoogleScholarGoogle Scholar | 16727053PubMed |
O’Rourke PK, Winks L, Kelly AM (1992) ‘North Australia beef producer survey 1990.’ (Department of Primary Industries: Brisbane, Qld, Australia).
Queensland Government Department of Agriculture and Fisheries (2020) BreedCow and Dynama software. Available at https://www.daf.qld.gov.au/business-priorities/agriculture/animals/beef/breedcow-dynama [Verified 9 March 2021]
Sergeant E, Shephard R, Allen T, Kennedy D, Cameron A (2005) A review of the structure and dynamics of the Australian dairy cattle industry. Report to Australian Department of Agriculture, Fisheries and Forestry, Canberra, ACT, Australia.
Smith DR, Fordyce G, Shaw KA, Smith PC, Laing AR (2001) Northern stocking rate demonstration. Final report, Project NHT.962011. National Heritage Trust, Canberra, ACT, Australia.
Wicksteed LT (1986) The ability to sell cull cows and heifers - the key to profitable cattle production in the extensive country of North Queensland. In ‘Field day proceedings, North Queensland Branch of the Australian Society of Animal Production’, ‘Byrne Valley’, Home Hill, 4 December 1986.