

The impact of reference composition and genome build on the accuracy of genotype imputation in Australian Angus cattle
Hassan Aliloo A B and Samuel A. Clark A
A School of Environmental and Rural Science, University of New England, Armidale, NSW 2350, Australia.
B Corresponding author. Email: haliloo@une.edu.au
Animal Production Science - https://doi.org/10.1071/AN21098
Submitted: 19 February 2021 Accepted: 13 July 2021 Published online: 23 September 2021
Journal Compilation © CSIRO 2021 Open Access CC BY-NC
Abstract
Context: Genotype imputation is an effective method to increase the number of SNP markers available for an animal and thereby increase the overall power of genome-wide associations and accuracy of genomic predictions. It is also the key to achieve a common set of markers for all individuals when the original genotypes are obtained using multiple genotyping platforms. High accuracy of imputed genotypes is crucial to their utility.
Aims: In this study, we propose a method for the construction of a common set of medium density markers for imputation, which relies on keeping as much information as possible. We also investigated the impact of changing marker coordinates on the basis of the new bovine genome assembly, ARS-UCD 1.2, on imputation accuracy.
Methods: In total, 49 754 animals with 45 364 single nucleotide polymorphism markers were used in a 10-fold cross-validation to compare four different imputation scenarios. The four scenarios were based on two alternative designs for the reference datasets. (1) A traditional reference panel that was created using the overlapping SNP from five medium density arrays and (2) a composite reference panel created by combining SNPs across the five arrays. Each of the reference datasets was used to test imputation accuracy when the SNPs were aligned on the basis of two genome assemblies (UMD 3.1 and ARS-UCD 1.2).
Key results: Our results showed that a composite reference panel can achieve higher imputation accuracies than does a traditional overlap reference. Incorporating mapping information on the basis of the recent genome build slightly improved the imputation accuracies, especially for lower density chips.
Conclusions: Markers with unreliable mapping information and animals with low connectedness to the imputation reference dataset benefited the most from the ARS-UCD 1.2 assembly and composite reference respectively.
Implications: The presented method is straightforward and can be used to setup an optimal imputation for accurate inference of genotypes in Australian Angus cattle.
Keywords: beef cattle, imputation accuracy, ARS-UCD1.2, composite reference.
Introduction
The accuracy of genomic prediction and the power to detect potential causal variants in genome-wide association studies is often dependent on the density of genotypic information (Goddard 2009). In most cases, the cost of genotyping all individuals at a high density is not feasible, so statistical approaches to impute genotypes from a lower density to a higher density have been widely examined (see review by Marchini and Howie 2010). Genotype imputation employs a reference group of individuals genotyped at a high density to fill in the missing genotypes of target individuals that have been genotyped for a subset of the variants by using population- or family-based information (Sargolzaei et al. 2014). It is also particularly useful for combining genotypes across different genotyping platforms when a common set of single-nucleotide polymorphisms (SNPs) is required for genome-wide association studies and genomic predictions. Genotype imputation techniques rely on information between adjacent variants (or between those in close proximity) to accurately impute individual genotypes. This means that the position where given variants are mapped on the genome may have large implications for imputation accuracy and subsequent analysis undertaken with the imputed data.
The UMD 3.1 bovine genome assembly (Zimin et al. 2009) has been the main genome map of cattle since 2009 and it has been used to help unravel the genetic mechanisms underlying phenotypic variation in many economically important traits. However, the UMD 3.1 assembly contains over 72 000 gaps in the annotation as well as regions that are known to be poorly assembled, mainly because of the limitation of sequencing technologies when it was released. The recently published ARS-UCD 1.2 bovine reference genome (Rosen et al. 2020) has been built using more modern sequencing technologies based on longer reads to improve continuity, accuracy and completeness of assembly. The ARS-UCS 1.2 bovine genome assembly has decreased the number of gaps across genome to fewer than 500 and improved the assembly of regions with known issues. It has already been incorporated in national genetic evaluations around the world including the USA dairy cattle genomic evaluation where it has been found that using the new reference map can improve the detection of animals that carry lethal recessive genotypes as well as increasing the accuracy of imputing carrier status (Null et al. 2019).
The accuracy of genotype imputation is also affected by the size of the reference population, where a larger reference that represents the genetic diversity of the target population generally results in a higher imputation accuracy (e.g. Ventura et al. 2016). One way to increase the size of the reference dataset is to combine genotypes from individuals who have been genotyped on different SNP arrays. Samples from different genotyping arrays may contain certain SNPs that are unique to specific panels and do not exist in other panels. Retaining such SNPs in the imputation process may increase the overall information content and, hence, improve the imputation accuracy compared with when a minimal overlap between the genotyped markers is kept. A composite reference set in this context may contain a better representation of existing haplotypes in the population and potentially capture a higher haplotypic diversity than does a reference set that only includes common SNPs between panels. This may also benefit the inference of missing genotypes, especially the imputation of rare alleles that are not matched by common haplotypes and, generally, have a low imputation accuracy.
The objective of this study was to investigate the impact of reference panel composition and bovine genome assembly on imputation accuracy of Angus cattle in Australia when a common set of medium density markers was required for all animals. We aimed to investigate the relationships between imputation accuracy and allele frequency of SNPs and animals’ connectedness with the reference set, to gain a better understanding of the underlying factors influencing the imputation accuracy of Australian Angus genotypes.
Materials and methods
Genotypes
The present study utilised genotype data from Angus Australia (Armidale, New South Wales, Australia). This dataset included genotypic records from over 100 000 animals genotyped between 2010 and 2020. The genotypes were from 24 commercially available or customised SNP panels for Angus cattle. For each panel used in the study, only autosomal SNP markers were retained for analysis. For panels where GeneCall information was available, the genotype calls with a score of <0.15 were assumed as missing (Edriss et al. 2013). Further quality control was undertaken using PLINK 1.9 (Chang et al. 2015) to remove SNPs with a call rate lower than 90% from each panel. In addition, SNPs departing from the Hardy–Weinberg equilibrium at P < 1E–07 and animals with a call rate of less than 85% and markers with a minor allele frequency (MAF) of less than 0.01 were removed. The mapping information for all markers was available on the basis of both UMD 3.1 (UMD; Zimin et al. 2009) and ARS-UCD 1.2 (ARS; Rosen et al. 2020) genome assemblies.
Imputation
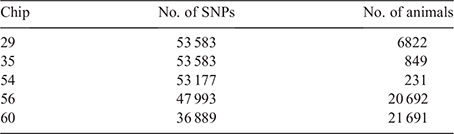
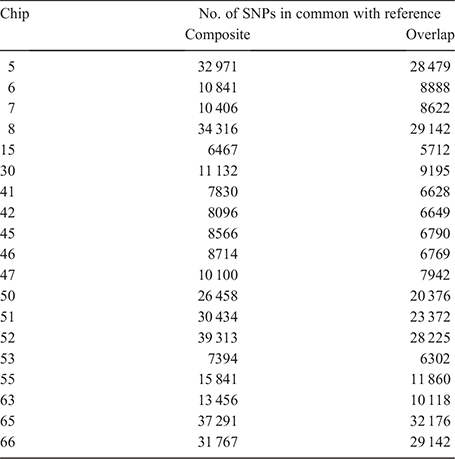
To investigate the impact of the reference composition on imputation accuracy, two reference panels were created. The first reference panel was a medium density composite reference panel (comp) created by combining SNPs across five medium density arrays, i.e. Chips 29, 35, 54, 56 and 60 (Table 1), keeping only the markers with known genotypes on at least 80% of all individuals. The resultant comp reference dataset consisted of 45 364 SNPs on 49 754 animals. The second reference panel was created by extracting 32 404 common markers across the same five SNP arrays for the same 49 754 individuals and is referred to as the overlap reference (ovlp) hereafter. The comp and ovlp reference sets were used to assess the locus- and individual-specific average imputation efficacy for the remaining 19 panels (Table 2) in a cross-validation scheme. The 49 754 animals with known genotypes were randomly divided into 10 groups. At each rotation, the overlapping SNPs between reference sets and each panel were extracted for 10% of animals (n = ~4975) used as the target set and the remaining 90% (n = ~44 779) with full genotypes were used as a reference to impute them. Table 2 shows the number of markers across the different SNP chips used for target set imputation. FImpute v.3 (Sargolzaei et al. 2014) with the default parameter settings was used as the imputation software. The correlations between real and imputed genotypes were averaged across 10 correlations to obtain the accuracy of imputation for each panel. The individual-specific correlations were corrected for allele frequencies as suggested by Mulder et al. (2012). The imputation accuracies were calculated using only the 32 404 common markers between the two reference sets. The standard errors of the mean (s.e.m.) were calculated for all scenarios of imputation and used to define significance levels (95% confidence interval = ±1.96 s.e.m.).
|
|
To assess the impact of changing the reference map that is used to order markers across genome, two reference genome assemblies (ARS or UMD) were used to determine the SNP position on the genome. The imputation process described above was then used to estimate the imputation accuracy for each genome build. In total, the following four imputation scenarios were designed such that each combination of two different reference sets with two different reference maps were implemented: (1) comp_ARS, (2) comp_UMD, (3) ovlp_ARS and (4) ovlp_UMD.
Factors affecting imputation accuracy
To understand potential factors underlying the imputation accuracies, we investigated the impact of a difference of 500 kilo base pair (kbp) and higher in physical position (within a chromosome) of SNPs among assemblies or a change in their chromosome. The relationships between allele frequency of markers and their imputation accuracies were further examined.
The connectedness between reference and target sets was further examined to evaluate its impact on individual-specific imputation accuracies. For each animal in the target set, the average of top 100 genomic relationship coefficients, obtained from the off-diagonal elements of a genomic relationship matrix based on VanRaden (2008), with animals from the reference set that were used in their imputation, was calculated. The SNPs and animals with an accuracy of less than 0.95 from the scenario with the highest average imputation accuracy with both UMD and ARS reference maps, were deemed as poorly imputed and reasons behind their poor imputations were further examined.
Results
Imputation accuracies
The locus- and individual-specific average imputation accuracies are shown in Fig. 1. The accuracies were high and the difference between different imputation scenarios was minimal. The imputation accuracy s.e.m. values were all smaller than 0.001 and 0.00001 for locus- and individual-specific correlations respectively. All chips except Chips 5, 8, 50, 51, 52, 65 and 66 showed a small but significant difference in correlations obtained from comp and ovlp reference sets regardless of the bovine genome assembly. However, there was a trend that the scenarios with markers ordered on the basis of ARS bovine genome assembly achieved the highest imputation accuracy, compared with other imputation scenarios for all tested chips. The difference among different imputation scenarios was more evident for lower density chips, showing that the composite reference set and ARS reference map were especially beneficial for imputation of low density chips. The average imputation accuracies generally increased with an increasing number of common SNPs between reference and target chips (from left to right in Fig. 1). However, chips with the highest number of common SNPs with the reference set did not always achieve the highest accuracies. For example, Chip 50 obtained higher locus- and individual-specific accuracies than did Chip 51, while it had ~4000 and 3000 fewer common SNPs with the comp and ovlp reference sets respectively. Chips 66, 5 and 8 had a higher imputation accuracy than did Chip 65, although they had a lower number of SNPs in common with both reference sets.

|
The impact of different factors on imputation accuracy
Reference map
We identified 12 483 SNPs, which were either aligned to different chromosomes or had a base pair position difference of 500 kbp and higher between ARS and UMD bovine genome assemblies (Fig. 2). For the majority of these SNPs (~90%), the difference in imputation accuracies from the two reference maps was very small (<0.001). Comparing the SNPs with a difference of 0.05 and higher in imputation accuracies across imputation scenarios, the mapping information based on ARS predominantly resulted in a higher correlation between real and imputed genotypes than did that based on UMD, regardless of the type of reference set. However, the imputation accuracies were low for some SNPs across both reference maps. Interestingly, we found four SNPs that were imputed more accurately when using the UMD map (Fig. 2).

|
MAF
On the basis of results from comp_ARS scenario, correlations were slightly smaller for low MAF groups and increased up to a MAF of 0.15 (Fig. 3). At MAFs of >0.15, there was no relationship between the correlation and MAF. The same pattern was observed for all other imputation scenarios (Fig. S1, available as Supplementary material to this paper). The choice of reference map (ARS or UMD) did not have an impact on the imputation accuracy across different groups of MAF. However, the accuracies of imputation obtained from the composite reference were slightly higher than those from the ovlp across all classes of MAF (Fig. S1).

|
Connectedness to reference
When the relationship between target and reference sets increased, the comp_ARS scenario achieved higher correlations (Fig. 3). The rate of increase in average imputation accuracies was higher for low relationships (<0.15) but then it stabilised, before showing a high variation for higher accuracies. Imputation accuracies fluctuated more when the average kinship values were higher than 0.35 because of the smaller number of animals in these groups. Similar results were found for other imputation scenarios (Fig. S1). The individual-specific accuracies were not influenced by the use of different bovine reference maps across all relationships and the difference between scenarios using either ARS or UMD was negligible. However, imputation accuracies were improved when a composite reference set was used, compared with scenarios with an ovlp set. The difference between accuracies from comp and ovlp sets was larger for animals with a smaller relatedness to reference, but this difference diminished as relationships increased, such that for animals with a kinship coefficient of 0.4 or higher, the imputation accuracies were almost identical across all scenarios of imputation.
SNPs and animals with poor imputations
Results from scenarios with the composite reference (i.e. comp_ARS and comp_UMD) were used to identify poorly imputed SNPs and animals, as these scenarios provided the most accurate imputations for all chips. For comp_ARS, the majority of SNPs showed high correlations between real and imputed genotypes and there were only 300 markers with an average correlation of less than 0.95 across all target chips (Fig. S2). From these poorly imputed markers, 147 had a difference of 500 kbp or larger in physical positions between ARS and UMD. The least accurate imputations (<0.30) were found for SNPs with the largest change in mapping information (>1.5 Mbp) between the two genome assemblies. The largest number of poorly imputed SNPs was found on Chromosome 19 (n = 52) and Chromosomes 3, 11 and 21 each contained 26 poorly imputed SNPs. The poorly imputed SNPs corresponded to 47 putatively misplaced genomic segments, each with at least two SNPs, where the distance between consecutive SNPs was 500 kbp or smaller (Table S1, available as Supplementary material to this paper). For comp_UMD, we found 338 poorly imputed SNPs, which corresponded to a higher number (n = 53) of genomic segments deemed as misplaced because of low imputation accuracy (Table S2). The majority of SNPs (86%) with a low accuracy from UMD still showed a low accuracy on the basis of ARS and the latter improved imputation of only 14% of SNPs. The average correlations between real and imputed genotypes within the putatively misplaced regions were almost identical for comp_ARS and comp_UMD scenarios. However, there were six regions from comp_UMD scenario, where the comp_ARS improved the imputation accuracies by 0.02 or more (Table S2).
There were 374 animals with an accuracy of less than 0.95 from comp_ARS scenario (Fig. S2), which were found to have relatively low relationships with their imputation reference set (an average top 100 relationships of 0.1669 compared with an average of 0.2179 across the whole dataset). When the individual-specific imputation accuracies were obtained from comp_UMD, 11 more animals were identified (n = 374 + 11) with an accuracy of <0.95. However, the imputation accuracies of these additional animals only slightly improved (a maximum improvement of 0.003) when the mapping information was updated to ARS.
Discussion
Genotype imputation has been a successful method in inferring highly accurate genotypes that are not directly assayed or sporadically missing. To further increase the accuracy of imputation, novel approaches such as a multi-breed reference population (Hozé et al. 2013; Rowan et al. 2019) or a two-step imputation strategy (van Binsbergen et al. 2014) have been suggested. Here, we proposed an alternative procedure to construct the reference for imputation and showed that a composite reference reached higher imputation accuracies across all tested chips than did a traditional overlap reference. Incorporating mapping information based on the recent genome build further improved the imputation accuracy especially for lower density chips, but the rate of increase was marginal. The results of the current study confirmed that an optimal imputation strategy for Australian Angus cattle can be achieved by using a composite reference in which markers are ordered on the basis of ARS-UCD 1.2 bovine genome assembly. The optimal imputation is characterised by higher correlations between real and imputed genotypes, especially for markers with unreliable physical locations and individuals with the smallest connectedness with reference.
The overall imputation accuracies found in the present study were high, especially for less dense chips, given the densities of imputed and reference chips. For example, the correlations between real and imputed genotypes were between 0.974 and 0.977 (across the 4 imputation scenarios) for Chip 15, with ~6000 SNPs being imputed up to medium density. With similar densities of starting and end panels, Berry et al. (2014) reported a correlation of 0.962 between the actual and imputed genotypes for Aberdeen Angus. The high accuracies in the current study reflect the very large size of the reference population used for imputation. The impact of the reference population size on imputation accuracies has been shown in several studies, with a larger reference population resulting in higher accuracies (Hozé et al. 2013; Ventura et al. 2016). In addition, we showed that even a highly accurate imputation can be further improved by altering the SNP composition of the reference through keeping all of the available genotypes from the multiple SNP arrays.
In contrast, the incorporation of map positions on the basis of ARS had very little impact on average imputation accuracies, compared with those from UMD. For the majority of SNPs, the physical locations were very similar between the two assemblies and change of assembly did not cause a change in their sequential order. Although the difference between overall accuracies on the basis of ARS or UMD was negligible, the alignment of SNPs on the basis of the former improved the imputation for several regions across the genome. We classified the clusters of consecutive markers with low imputation accuracies as putatively misplaced segments (Tables S1, S2) and showed that for six putative misplaced regions from UMD, the imputation accuracy improved when their position was updated to ARS. This implies more accurate physical locations of SNPs in these regions on the basis of the new bovine genome assembly. Utsunomiya et al. (2016) scanned the linkage disequilibrium patterns across cattle genome and reported 246 putatively misassembled regions on the basis of UMD. Several of our reported regions in Table S2, including all with an improvement in imputation accuracy on the basis of ARS, overlapped with those reported by these authors. A larger number of regions are expected to benefit from updating mapping positions to the new assembly if a higher density of markers is used. Using a genome scan of improved imputation accuracies in an imputation from 50 000 to 777 000, Hermisdorff et al. (2020) reported more misplaced regions for UMD assembly than those from our study. The current study focused on the imputation of many lower density chips to a medium density set and, therefore, the identified regions in our study are influenced by a lower SNP density and limited to those regions covered by the panels in the reference.
We observed the highest variations of accuracies across different imputation scenarios for SNPs with a large change in map positions between assemblies. Large changes in map position can cause substantial difference in the order of markers within specific regions across genome. This can lead to construction of different sets of haplotypes for those regions, which consequently changes the inference of missing genotypes during the imputation process. We found that for markers with large positional changes, the ARS assembly predominantly delivered a higher accuracy than did UMD, regardless of the type of reference. However, given that for some of the re-arranged SNPs, the imputation was still inaccurate, a large change between assemblies might indicate an uncertainty in the actual genomic locations of SNPs that has not been resolved yet. In addition, for some of the re-arranged SNPs between assemblies, the imputation accuracy was higher from UMD than from ARS, which potentially implies a more precise alignment on the basis of the former. As the current version of the ARS is new, more accurate alignments of variants across bovine genome are likely in future releases of this assembly.
The alternative construction of the reference, i.e. composite or overlap, was specifically beneficial for animals with low relatedness to the reference. The imputation of animals that are closely related to reference largely depends on detection of long-range haplotypes (Kong et al. 2008) that might not be largely affected by the inclusion of additional variants in the reference. However, for animals that are not well connected to the reference, the addition of extra markers helps better utilise the population linkage disequilibrium at shorter distances and captures higher numbers of existing haplotypes in the population. This, consequently, provides more information for imputation algorithms, leading to less errors in filling the gaps across genome with the identified haplotypes.
Conclusions
The overall imputation accuracies in Australian Angus are very high due to a very large size of the reference. The use of a composite reference mapped to the ARS-UCD 1.2 genome build further improved the imputation accuracy. The new reference map was specifically beneficial for the imputation of SNPs with unreliable map positions, while the composite reference benefited mostly the animals with a low relatedness to the reference. The presented procedure to construct a reference for imputation is straightforward for practical applications and does not incur additional costs.
Conflicts of interest
The authors declare that they have no conflicts of interest.
Acknowledgements
We thank Angus Australia for their support of this research and access to the data used in this study. We further acknowledge Peter Parnell, Andrew Byrne and Christian Duff for their valued feedback on this work.
References
Berry DP, McClure MC, Mullen MP (2014) Within- and across-breed imputation of high-density genotypes in dairy and beef cattle from medium- and low-density genotypes. Journal of Animal Breeding and Genetics 131, 165–172.| Within- and across-breed imputation of high-density genotypes in dairy and beef cattle from medium- and low-density genotypes.Crossref | GoogleScholarGoogle Scholar | 24906026PubMed |
Chang CC, Chow CC, Tellier LC, Vattikuti S, Purcell SM, Lee JJ (2015) Second-generation PLINK: rising to the challenge of larger and richer datasets. GigaScience 4, s13742-015-0047-8
| Second-generation PLINK: rising to the challenge of larger and richer datasets.Crossref | GoogleScholarGoogle Scholar |
Edriss V, Guldbrandtsen B, Lund MS, Su G (2013) Effect of marker-data editing on the accuracy of genomic prediction. Journal of Animal Breeding and Genetics 130, 128–135.
| Effect of marker-data editing on the accuracy of genomic prediction.Crossref | GoogleScholarGoogle Scholar | 23496013PubMed |
Goddard M (2009) Genomic selection: prediction of accuracy and maximisation of long term response. Genetica 136, 245–257.
| Genomic selection: prediction of accuracy and maximisation of long term response.Crossref | GoogleScholarGoogle Scholar | 18704696PubMed |
Hermisdorff IDC, Costa RB, de Albuquerque LG, Pausch H, Kadri NK (2020) Investigating the accuracy of imputing autosomal variants in Nellore cattle using the ARS-UCD1.2 assembly of the bovine genome. BMC Genomics 21, 772
| Investigating the accuracy of imputing autosomal variants in Nellore cattle using the ARS-UCD1.2 assembly of the bovine genome.Crossref | GoogleScholarGoogle Scholar | 33167856PubMed |
Hozé C, Fouilloux M-N, Venot E, Guillaume F, Dassonneville R, Fritz S, Ducrocq V, Phocas F, Boichard D, Croiseau P (2013) High-density marker imputation accuracy in sixteen French cattle breeds. Genetics, Selection, Evolution 45, 33
| High-density marker imputation accuracy in sixteen French cattle breeds.Crossref | GoogleScholarGoogle Scholar | 24004563PubMed |
Kong A, Masson G, Frigge ML, Gylfason A, Zusmanovich P, Thorleifsson G, Olason PI, Ingason A, Steinberg S, Rafnar T, Sulem P, Mouy M, Jonsson F, Thorsteinsdottir U, Gudbjartsson DF, Stefansson H, Stefansson K (2008) Detection of sharing by descent, long-range phasing and haplotype imputation. Nature Reviews Genetics 40, 1068–1075.
| Detection of sharing by descent, long-range phasing and haplotype imputation.Crossref | GoogleScholarGoogle Scholar |
Marchini J, Howie B (2010) Genotype imputation for genome-wide association studies. Nature Reviews Genetics 11, 499–511.
| Genotype imputation for genome-wide association studies.Crossref | GoogleScholarGoogle Scholar | 20517342PubMed |
Mulder HA, Calus MP, Druet T, Schrooten C (2012) Imputation of genotypes with low-density chips and its effect on reliability of direct genomic values in Dutch Holstein cattle. Journal of Dairy Science 95, 876–889.
| Imputation of genotypes with low-density chips and its effect on reliability of direct genomic values in Dutch Holstein cattle.Crossref | GoogleScholarGoogle Scholar | 22281352PubMed |
Null DJ, VanRaden PM, Rosen BD, O’Connell JR, Bickhart DM (2019) Using the ARS-UCD1.2 reference genome in US evaluations. Interbull Bulletin 55, 30–34.
Rosen BD, Bickhart DM, Schnabel RD, Koren S, Elsik CG, Tseng E, Rowan TN, Low WY, Zimin A, Couldrey C, Hall R, Li W, Rhie A, Ghurye J, McKay SD, Thibaud-Nissen F, Hoffman J, Murdoch BM, Snelling WM, McDaneld TG, Hammond JA, Schwartz JC, Nandolo W, Hagen DE, Dreischer C, Schultheiss SJ, Schroeder SG, Phillippy AM, Cole JB, Van Tassell CP, Liu G, Smith TPL, Medrano JF (2020) De novo assembly of the cattle reference genome with single-molecule sequencing. GigaScience 9, giaa021
| De novo assembly of the cattle reference genome with single-molecule sequencing.Crossref | GoogleScholarGoogle Scholar | 32191811PubMed |
Rowan TN, Hoff JL, Crum TE, Taylor JF, Schnabel RD, Decker JE (2019) A multi-breed reference panel and additional rare variants maximize imputation accuracy in cattle. Genetics, Selection, Evolution 51, 77
| A multi-breed reference panel and additional rare variants maximize imputation accuracy in cattle.Crossref | GoogleScholarGoogle Scholar | 31878893PubMed |
Sargolzaei M, Chesnais JP, Schenkel FS (2014) A new approach for efficient genotype imputation using information from relatives. BMC Genomics 15, 478
| A new approach for efficient genotype imputation using information from relatives.Crossref | GoogleScholarGoogle Scholar | 24935670PubMed |
Utsunomiya ATH, Santos DJA, Boison SA, Utsunomiya YT, Milanesi M, Bickhart DM, Ajmone-Marsan P, Sölkner J, Garcia JF, da Fonseca R, da Silva MVGB (2016) Revealing misassembled segments in the bovine reference genome by high resolution linkage disequilibrium scan. BMC Genomics 17, 705
| Revealing misassembled segments in the bovine reference genome by high resolution linkage disequilibrium scan.Crossref | GoogleScholarGoogle Scholar |
van Binsbergen R, Bink MCAM, Calus MPL, van Eeuwijk FA, Hayes BJ, Hulsegge I, Veerkamp RF (2014) Accuracy of imputation to whole-genome sequence data in Holstein Friesian cattle. Genetics, Selection, Evolution 46, 41
| Accuracy of imputation to whole-genome sequence data in Holstein Friesian cattle.Crossref | GoogleScholarGoogle Scholar | 25022768PubMed |
VanRaden PM (2008) Efficient methods to compute genomic predictions. Journal of Dairy Science 91, 4414–4423.
| Efficient methods to compute genomic predictions.Crossref | GoogleScholarGoogle Scholar | 18946147PubMed |
Ventura RV, Miller SP, Dodds KG, Auvray B, Lee M, Bixley M, Clarke SM, McEwan JC (2016) Assessing accuracy of imputation using different SNP panel densities in a multi-breed sheep population. Genetics, Selection, Evolution 48, 71
| Assessing accuracy of imputation using different SNP panel densities in a multi-breed sheep population.Crossref | GoogleScholarGoogle Scholar | 27663120PubMed |
Zimin AV, Delcher AL, Florea L, Kelley DR, Schatz MC, Puiu D, Hanrahan F, Pertea G, Van Tassell CP, Sonstegard TS, Marçais G, Roberts M, Subramanian P, Yorke JA, Salzberg SL (2009) A whole-genome assembly of the domestic cow, Bos taurus. Genome Biology 10, R42
| A whole-genome assembly of the domestic cow, Bos taurus.Crossref | GoogleScholarGoogle Scholar | 19393038PubMed |