Factors influencing the incidence of high rigor temperature in beef carcasses in Australia
R. D. Warner A E , F. R. Dunshea B , D. Gutzke C , J. Lau C and G. Kearney DA CSIRO Animal Food and Health Sciences, 671 Sneydes Road, Werribee, Vic. 3030, Australia.
B Melbourne School of Land and Environment, The University of Melbourne, Parkville, Vic. 3010, Australia.
C Meat and Livestock Australia, Level 2, 527 Gregory Terrace, Fortitude Valley, Qld 4006, Australia.
D 36 Paynes Road, Hamilton, Vic. 3300, Australia.
E Corresponding author. Email: robyn.warner@csiro.au
Animal Production Science 54(4) 363-374 https://doi.org/10.1071/AN13455
Submitted: 31 October 2013 Accepted: 22 January 2014 Published: 28 February 2014
Journal Compilation © CSIRO Publishing 2014 Open Access CC BY-NC-ND
Abstract
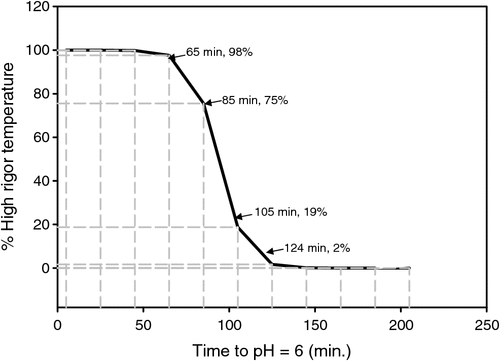
Beef carcasses undergoing rapid pH fall while the loin muscle temperature is still high are described as heat-shortened, heat-toughened or ‘high rigor temperature’ carcasses, with subsequent negative effects on quality traits. The aim of the study was to quantify the occurrence of high rigor temperature in beef carcasses across Australia and to identify the causative factors. Data was collected over 4–5 days at each of seven beef processing plants from 1512 beef carcasses. The beef carcasses were from both grass- and grain-fed cattle ranging in days on grain feeding from 0 (grass-fed) to 350 days and the category of cattle ranged from veal to ox and cow. Data collected on the day of slaughter included the duration of electrical inputs at the immobiliser, electrical stimulation and hide puller, longissimus muscle pH and temperature decline, hot carcass weight and P8 fat depth. At grading, ultimate pH, eye muscle area, wetness of the loin surface and colour score were also collected. The temperature at pH 6 was calculated and if it was >35°C, the carcass was defined as ‘high rigor temperature’. Modelling of the data was conducted using GLMM and REML. The occurrence of high rigor temperature across all seven beef processing plants was 74.6% ranging from 56 to 94% between beef processing plants. Increasing days in the feedlot and heavier carcass weights were highly correlated and both caused an increase in the predicted temperature at pH 6 and in the % high rigor temperature (P < 0.05 for both). Longer duration of electrical inputs at the hide puller, fatter grass-fed cattle and fatter male (castrate) carcasses had a higher temperature at pH 6 and higher % high rigor temperature. Modelling showed that if the time to reach pH 6 in the longissimus muscle was 65 v. 105 min, the % high rigor temperature carcasses reduced from 98 to 19% in grain-fed cattle and 93 to 7% in grass-fed cattle. Higher plasma insulin levels at slaughter were associated with a higher temperature at pH 6 (rigor temperature) (P < 0.001). In conclusion, in order to reduce the incidence of high rigor temperature in grain-fed beef carcasses, methods for identifying high rigor temperature carcasses will be required and while some management strategies can be implemented now, others require further research.
Introduction
In the living animal, skeletal muscles metabolise muscle glycogen in order to replenish energy stores, in a process known as glycolysis. Post slaughter, muscles continue to metabolise glycogen, due to a demand for energy. These metabolic processes post slaughter are anaerobic and result in a build up of lactate and associated hydrogen ions, which lowers muscle pH. Glycolysis ceases either because of a lack of the substrate glycogen, or because the pH of the muscle becomes acidic enough to deactivate the enzymes associated with post-mortem glycolysis (Greaser 1986). Rigor mortis in the muscle is defined as the stage when muscle ATP has been totally depleted and the acto-myosin bond has permanently formed, preventing any further contraction (Marsh 1954). The onset of rigor does not occur simultaneously across all muscle fibres but in individual fibres, as they become depleted of ATP (Thompson et al. 2006). As the number of fibres entering rigor increases, the stiffness of the muscle as a whole increases and is significant when the muscle reaches a pH of ~6 (Thompson et al. 2006). The temperature at which the muscle enters rigor will impact on the degree of muscle shortening, and minimal shortening occurs in the range of 15−20°C (Devine et al. 2002). Cold-shortening occurs at temperatures below 15°C and heat-shortening occurs above 20°C (Locker and Hagyard 1963; Devine et al. 1999) and each is known to influence the quality characteristics of meat, to varying degrees, particularly the tenderness. Hamm and Van Hoof [1970; cited in Fischer and Hamm (1980)] were the first to report the incidence of bovine longissimus muscles with unusually high rates of post-mortem breakdown of glycogen. Subsequently, pale, watery beef caused by fast glycolysing muscle was reported by Fischer and Hamm (1980) and also by Tarrant and Mothersill (1977).
Variation in the eating quality of Australian beef has been of concern to the industry for several years. The Meat Standards Australia system for assuring quality to the consumer was introduced in 1999 after rigorous consumer testing (Watson et al. 2008a, 2008b). Early Meat Standards Australia (MSA) efforts for improving eating quality specified electrical stimulation of all carcasses (Polkinghorne et al. 2008). However, trials showed that while stimulation of beef carcasses prevented cold-shortening, it also created eating quality problems due to heat-shortening (Hwang and Thompson 2001a). Thus the MSA grading scheme defined the optimal window for pH decline as a function of pH and temperature. The MSA pH-temperature window required temperatures in the loin muscle to be above 12°C, and below 35°C at the point at which the loin pH reached 6.0, to avoid cold-shortening (≤12°C) and ‘high rigor temperature’ (≥35°C), respectively. In the registration of beef processing plants for accreditation for MSA, an initial audit establishes the pH-temperature of a sample of carcasses typically slaughtered and if the carcasses are outside the window, the MSA graders assist the beef processing plant to achieve a pH-temperature decline to fit within the window. As part of maintaining accreditation for MSA, beef processing plants regularly check pH and temperature declines in groups of 15 carcasses, and make adjustments to electrical inputs to ensure that the carcasses being processed for MSA continue to meet the pH-temperature window. Historically, it was found that an increasing number of beef processing plants were unable to meet the window, especially at plants where high numbers of grain-fed cattle were slaughtered.
The red meat processing industry in Australia requested the development of a ‘pH decline program’ to assist in controlling yield, quality and efficiency-related issues associated with fast pH decline and high ultimate pH (pHu). It was proposed to undertake a series of case studies with beef supply chain companies experiencing associated quality and yield problems due to non-ideal pH and temperature declines. The incidence of carcasses outside the window needed to be quantified. Furthermore, as there is little information on those factors which impact on the pH and temperature decline post-slaughter rate in beef carcasses, it was proposed to simultaneously collect additional data, in order to ascertain the contributing factors. Thus the aim of the study was to quantify the incidence of high rigor temperature in beef carcasses in Australian beef processing plants and to identify predisposing ante-mortem and post-mortem factors associated with the problem.
Materials and methods
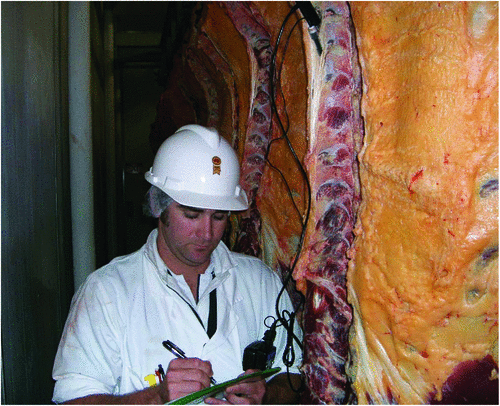
Data was collected from seven beef processing plants between January and June 2006. For each beef processing plant, data was collected over 4–5 consecutive days. The beef processing plants were in the states of Queensland, New South Wales, Victoria, South Australia and Western Australia. For each day of slaughter, MSA graders monitored 15–20 beef carcasses from most consignments for the day, provided there were >15 carcasses in a consignment. For each carcass monitored, the data recorded was date, mob (unique number for each mob of animals), time of slaughter, duration of immobilisation (in seconds), duration of electrical stimulation (seconds), duration of the application of the rigidity probe during removal of the hide (seconds), hot carcass weight, sex (castrate, hereafter called ‘male’, or female), fat depth over the P8 (rump) site (mm), chiller number, category of cattle specified by the processing plant and using AUS-MEAT ciphers (vealers, 0 permanent incisors and weighing <150-kg carcass weight; yearling, castrate or female with 0 permanent incisors; cow, female with eight permanent incisors; grain-fed; grass-fed; MSA, has passed MSA grading criteria; ox, castrated male with <8 permanent incisors), feed type (grain, grass, milk) and days on grain/concentrate feeding (0–360 days). After placement in the chiller, two pH, temperature and time measurements were recorded in the longissimus lumborum muscle in proximity to the 2nd to 5th lumbar vertebrae on individual carcasses (Fig. 1). Where possible, the second measurement was timed to ensure the muscle pH was below 6.0. For each measurement, care was taken to place the pH meter into a fresh incision rather than just using the site where the last measurement was recorded. A TPS WP-80M pH meter (TPS Pty Ltd, Springwood, Brisbane, Qld, Australia), with a polypropylene spear-type gel electrode (Ionode IJ44, TPS Pty Ltd) and temperature probe allowing temperature compensation, was used to measure pH and temperature. The pH meter and electrode were calibrated at ambient temperature using buffers of 4.00 and 7.00 and checked regularly for re-calibration. Data was collected from 103 mobs of cattle and 1512 beef carcasses. At three of the beef processing plants, blood samples were collected from 525 carcasses, as described below. All carcasses were hung by the Achilles tendon and chilled conventionally.
|
At ~12–30 h post mortem, after quartering of the carcass either between the 10th and 11th, 11th and 12th, 12th and 13th ribs, or 5th and 6th ribs (vealers only), MSA graders made the following measurements: eye muscle area, pH and temperature of the exposed longissimus thoracis muscle, AUS-MEAT meat colour score (AUS-MEAT 1996) (using AUS-MEAT standard meat colour chips in a range of 1A = very pale to 7 = very dark purple), AUS-MEAT firmness score (AUS-MEAT 1996) (1 = firm to 7 = soft) and weep score (weep present on the surface of the longissimus thoracis muscle at grading; 0 = no weep, 1 = weep present).
Blood samples
Blood samples were taken at exsanguination from 525 beef carcasses ranging in days on feed from 0 to 350 days. The blood samples were collected into heparinised tubes, immediately placed on ice until the plasma was separated by centrifugation at 2000g for 10 min at room temperature. The serum was decanted into Eppendorf tubes and frozen at −20°C until analysis for insulin and glucose. Plasma glucose (Sigma Aldrich, Pty Ltd, Castle Hill, NSW, Australia) was analysed using enzymatic kits modified for microtiter plates. Plasma insulin concentration was determined using a commercial radioimmunoassay kit (Ostrowska et al. 2002).
Statistical analyses
All statistical analyses were performed using Genstat software (12th Edition, VSN International Ltd, Hemel Hempstead, UK).
The vealers were excluded from the main analysis as they were different to all the other data in P8 fat, carcass weight, category, feed type and also their temperature at pH 6 (Temp@pH6) and % high rigor temperature. Data from a further 18 cattle were excluded as they were considered ‘outliers’ and exerted undue leverage on the results from the data analysis.
Temp@pH6 calculation
Temp@pH6 was calculated using a two-point interpolation method (Eqn 1) as described in Hwang and Thompson (2001b) and below.

TempA and pHA represent the first temperature and pH measurement above pH 6, and TempB and pHB represent the first measurement taken below pH 6. A carcass was defined as being ‘high rigor temperature if the Temp@pH6 was >35°C.
Temp@pH6 analyses
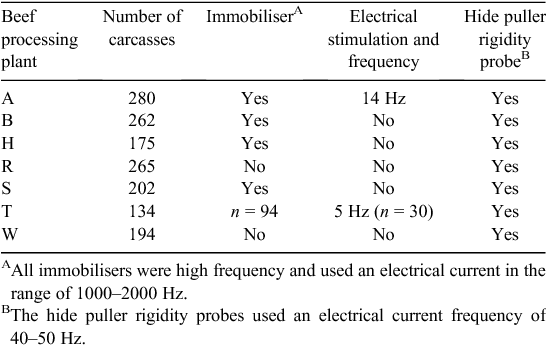
The initial analysis included the duration of application of each electrical input on the slaughter floor (rigidity probe duration, immobiliser duration and electrical stimulation duration) as separate variates. Table 1 shows the electrical inputs in place (and used) on the slaughter floor of each beef processing plant. All beef processing plants had a hide puller, only one beef processing plant used electrical stimulation and five beef processing plants used electrical immobilisation. It was not possible to analyse a continuous variable with large amounts of ‘0’ data. Thus a variate called ‘Total Inputs’ was created, which summed the duration of all electrical inputs in seconds. Preliminary analysis showed that the rigidity probe, at the hide puller, was having an effect and it was known from previous, unpubl. data, that the hide puller was most likely to have an effect on the pH-temperature fall (Janine Lau, unpubl. data). A variate called ‘RPonly’ (Rigidity Probe only) was created and was ‘Yes’ if the only electrical inputs on the slaughter floor were from the rigidity probe at the hide puller, and ‘No’ if there was other inputs (immobiliser plus/minus electrical stimulation). This allowed the separation of the effects of the rigidity probe from the immobiliser and electrical stimulation effects.
|
The method of restricted maximum likelihood (REML) was used to analyse the effects of various carcass and animal parameters on Temp@pH6.

Fixed effects = carcass weight, P8 fat, eye muscle area, days on feed, RPonly, Total Inputs (nested within RPonly), sex, feed type.category and two- and three-way interactions.
Random effects: plant/date/chiller/mob (i.e. mob was nested within chiller, which was nested within date, which was nested within plant).
Forward and backward selection, along with different submodelling of all parameters, was performed. Terms were only included in the final model if they were statistically significant (P < 0.05).
Analyses of incidence of high rigor temperature
In addition, an estimate of the factors influencing the proportion of carcasses with Temp@pH6 >35°C was analysed by fitting Generalised Linear Mixed Models (GLMM; GENSTAT). The approach used a logit-transform and binomial distribution with which, by using additive models, logits were predicted as a linear function of the same fixed and random effects as those fitted above.
Time to pH = 6 calculation and analyses
The time to pH = 6 was calculated using a two-point interpolation method using the Eqn (1) above except the ‘Temp’ parameters were replaced with ‘Time’ parameters. Using GLMM as described above, a model was developed to determine the effect of time to pH = 6 on the % high rigor temperature. The model included the main parameters in the previous model relevant to the analysis, being P8 fat depth, carcass weight and feed type, as well as time to pH = 6.
Insulin resistance calculations
The degree of insulin resistance was determined using the homeostatic model assessment (HOMA) and quantitative insulin sensitivity check index (QUICKI) (Katz et al. 2000). An increase in HOMA is associated with increased insulin resistance and an increase in QUICKI is associated with increased insulin sensitivity. All curve fitting of relationships between Temp@pH6 and indices of insulin resistance were done using the standard curves provided as drop down selections in Genstat. After evaluation of the fitted curves it was apparent that all of the responses were best described by an exponential response curve with the form:

where y = Temp@pH6, x = dependent variable, γ = asymptotic value of y, δ = rate constant and β = standardised slope parameter.
Weep and colour analyses
An estimate of the variation in the incidence of weep with Temp@pH6 was assessed by fitting a GLMM. The approach used a logit-transform and binomial distribution with which, by using additive models, logits were predicted as a linear function of Temp@pH6 as a fixed effect, and the same random effects were fitted as used above. Meat colour data was assessed by fitting a GLM with a multinomial distribution and logit link.
Results
Description of population
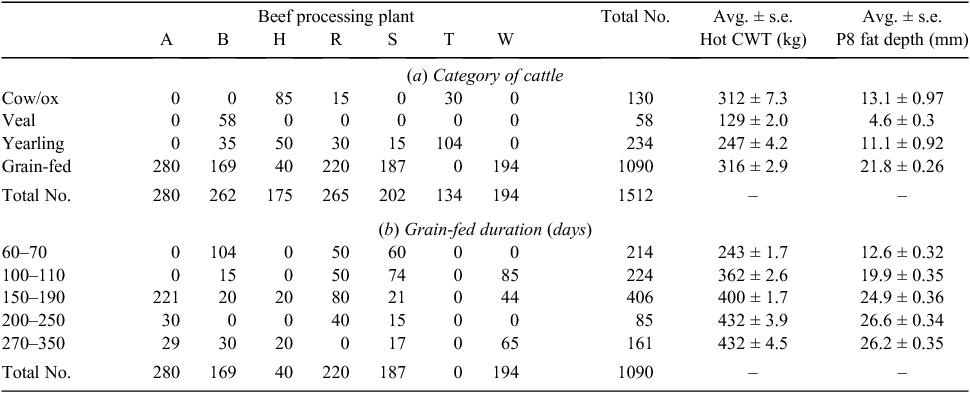
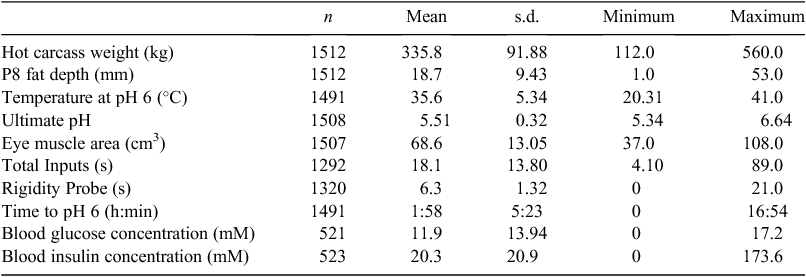
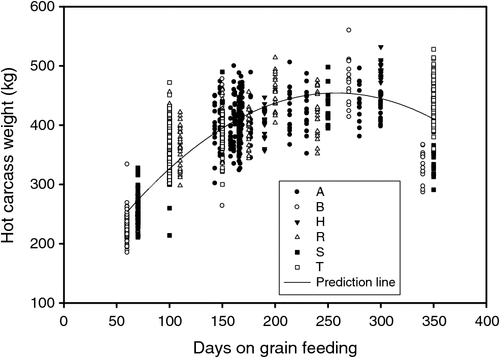
Table 2 shows the mean and range for the animal and carcass data as well as for the electrical inputs on the slaughter floor. The majority of the carcasses were from grain-fed cattle with two beef processing plants (A and W) having only grain-fed cattle (Table 3a). Beef processing plant T had no grain-fed cattle. The other categories represented in small numbers across the beef processing plants were cow, ox, veal and yearling (Table 3a). The hot carcass weights and P8 fat depths of yearling, veal, grain-fed and cow/ox categories are shown in Table 3. Fig. 2 show the variation in carcass weight with days on feed, for each beef processing plant and Table 3 shows the average carcass weight and fat depth for each ‘days on feed’ grouping. The carcasses of cattle which were fed for ~65 days on feed are typical of carcasses destined for the domestic market. Primals and muscles from the carcasses of cattle fed for 100 days or longer on grain would usually be exported to a variety of countries. Table 3b shows the number of cattle sampled at each beef processing plant for each grouping of ‘Days on Feed’. The hot carcass weights of the male and female (heifers and cows) cattle were 320 ± 3.0 and 261 ± 2.5 kg (average ± s.e.), respectively, and the corresponding P8 fat depths were 21.3 ± 0.28 and 13.5 ± 0.35 mm, respectively.
|
|
Variation in incidence between beef processing plants
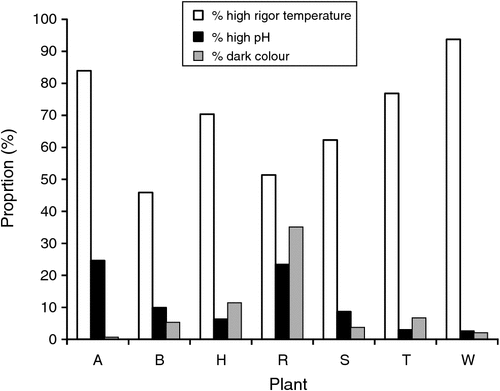
The overall incidence of high rigor temperature (Temp@pH6 >35°C), high pHu (>5.7) and of dark colour (AUS-MEAT colour score >3) in the beef carcasses, across the seven plants, was 71.8, 11.2 and 9.3%, respectively. Fig. 3 shows the proportion of high rigor temperature carcasses, high pHu and dark colour carcasses for each beef processing plant. Beef processing plant B had the lowest proportion of high rigor temperature carcasses (46%) and plant W had the highest proportion (94%). Plants W and T had the lowest proportion of high pHu carcasses (2.6, 3.0%, respectively), and plants R and A had the highest proportion of high pHu carcasses (23.3, 24.6%, respectively). For most plants, the occurrence of high pHu carcasses was similar to the occurrence of dark-coloured carcasses, except for plant A.
|
Models for Temp@pH6 and % high rigor temperature
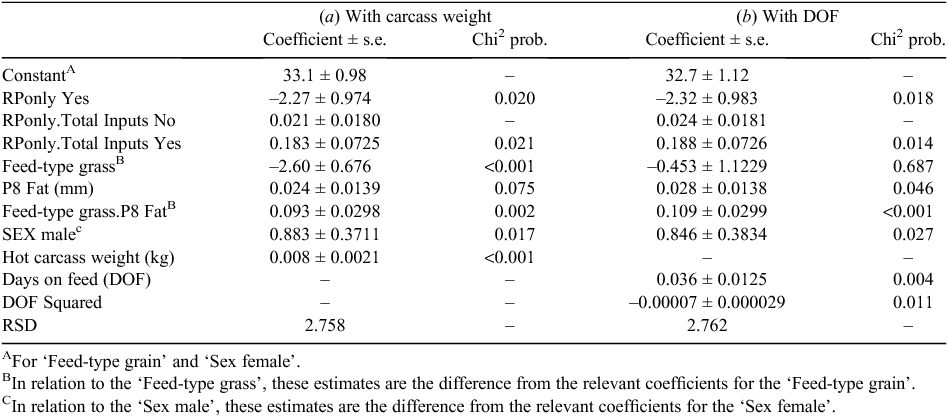
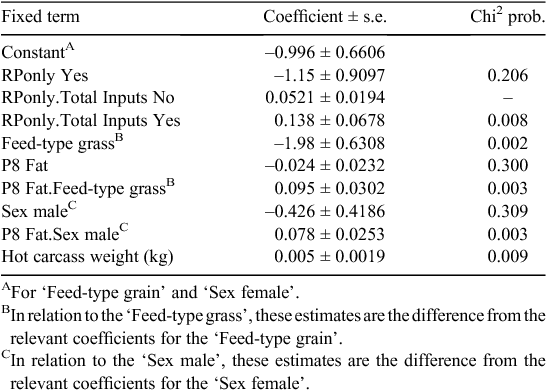
Table 4 shows the final models fitted for Temp@pH6. Two models were fitted and these are very similar except that model (a) contains carcass weight and model (b) contains the quadratic effect of days on feed, instead of carcass weight. The influencing factors for model (a) were the rigidity probe electrical inputs, total electrical inputs nested within the rigidity probe, feed type, P8 fat, an interaction between feed type and P8 fat, sex and hot carcass weight (P < 0.05 for all except feed type). For model (b), the influencing factors were similar to model (a), with similar coefficients, except that the quadratic terms for days on feed replaced hot carcass weight (P < 0.05 for all). The relationship between carcass weight and days on feed is shown in Fig. 2 and it can be seen that they are highly correlated (R2 = 0.70; Fig. 2) thus only one variable can be included in the model. Model (a) is subsequently reported as it was a more parsimonious model.
Table 5 shows the final models fitted for % high rigor temperature. The influencing factors on % high rigor temperature carcasses were, total electrical inputs nested within the rigidity probe, feed type, an interaction between feed type and P8 fat, an interaction between P8 fat and sex and hot carcass weight (P < 0.05).
|
The influencing factors on % high rigor temperature carcasses and Temp@pH6 are presented below.
Effect of hot carcass weight and days on grain
As carcass weight increased, there was a significant, but small, increase in the Temp@pH6 (P < 0.001; Table 4) and in the % high rigor temperature (P = 0.009; Table 5). The model predicts that for an increase from 200 to 400 kg in carcass weight, the Temp@pH6 would increase by 1.6°C and the proportion of high rigor temperature carcasses would increase from 56 to 81%.
The effects of days on grain and a squared term for days on grain (Table 4; P = 0.004 and 0.011, respectively), are shown in Table 6. As the days of grain feeding increased from 0 to 270–350 days, the Temp@pH6 increased from 33 to 38°C and the % high rigor temperature increased from 52 to 95% (Table 6).

|
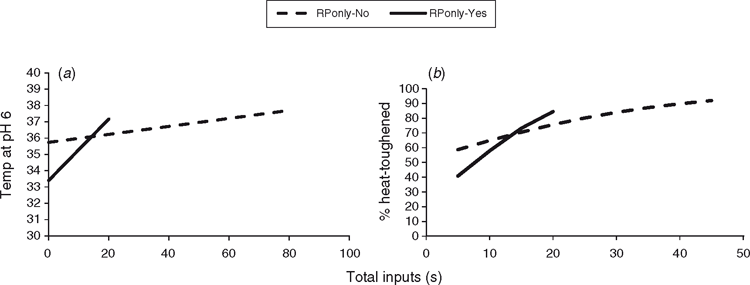
Effect of electrical inputs
There was an effect of total electrical inputs nested within rigidity probe for the Temp@pH6 and the proportion of high rigor temperature carcasses (P < 0.05, P < 0.001, respectively, Tables 4 and 5; Fig. 4). For carcasses with only electrical inputs at the hide puller, if total electrical inputs increases from 10 to 20 s, the predicted Temp@pH6 increases from 35 to 37°C and the % high rigor temperature increases from 58 to 84%. For carcasses with electrical inputs at the immobiliser, stimulation/bleeding unit and/or the hide puller, there is a much smaller, or negligible, effect of total electrical inputs; the Temp@pH6 increases from 36 to 36.2°C for an increase from 10 to 20 s and the % high rigor temperature over the same period increases from 65 to 76%.
|
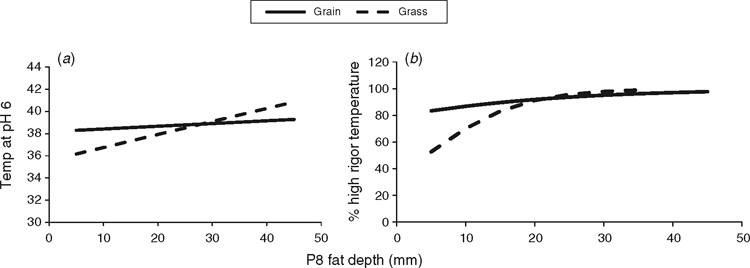
Effect of P8 fat and feed type
P8 fat depth and the pre-slaughter feed type influenced the occurrence of high rigor temperature and the Temp@pH6 (Tables 4 and 5; P < 0.01 for all except P = 0.075 for P8 fat and Temp@pH6). But the effect of P8 fat on Temp@pH6, and on % high rigor temperature, interacted with the feed type pre-slaughter (P < 0.01 for both; Tables 4 and 5, respectively). For grain-fed cattle, there was very little effect of P8 fat depth on the Temp@pH6 or % high rigor temperature. While for grass-fed cattle, there was a significant increase in Temp@pH6 and in % high rigor temperature as the P8 fat depth increased (Fig. 5). For grain-fed cattle over the P8 fat range of 5–45 mm, Temp@pH6 and % high rigor temperature increased from 38.3 to 39.3°C and 83 to 98%, respectively. In contrast for grass-fed cattle over a similar P8 fat depth range, Temp@pH6 and % high rigor temperature increased from 36.2 to 40.9°C and 52 to 98%, respectively.
|
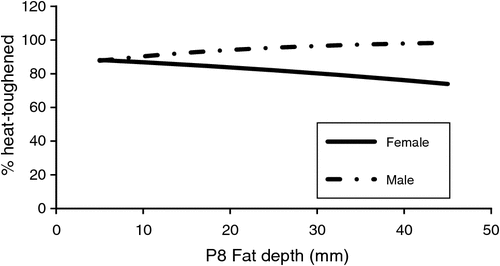
Effect of P8 fat and sex
On average, male cattle had a higher Temp@pH6 compared with female cattle (37.9 v. 36.2°C, respectively, s.e.d = 0.393; P < 0.05; Table 4) and a higher % high rigor temperature (83.0 v. 70.5%; P = 0.006; Table 5). In addition, the model for the proportion of high rigor temperature carcasses showed an interaction between P8 fat and sex (P < 0.001; Table 5). This relationship is illustrated in Fig. 6 and shows that there was a decline in the % high rigor temperature from 88 to 74% for female cattle over the P8 fat depth range 5–45 mm. For male cattle over the same P8 fat depth range, the predicted % heat toughening increased from 88 to 98%.
|
Time to pH 6
When the variate ‘time to pH 6’ was included in the model for the prediction of % high rigor temperature, P8 fat and carcass weight were not significant (P > 0.05), feed type was significant (P = 0.018) and time to pH 6 was highly significant (P < 0.001). The relationship between % high rigor temperature and time to pH 6 for grain-fed cattle is shown in Fig. 7 and can be used to predict the likelihood of a carcass being high rigor temperature. The model predicts that if the time to pH = 6 is 65 min or less, the incidence of high rigor temperature will be 98% or higher for grain-fed cattle (Fig. 7) and 93% or higher for grass-fed cattle. If the time to pH 6 is 105 min or longer, the model predicts the incidence of high rigor temperature will drop to 19% or lower for grain-fed cattle (Fig. 7) or 7% or lower for grass-fed cattle.
|
Effect of days on feed on blood insulin and glucose levels at slaughter
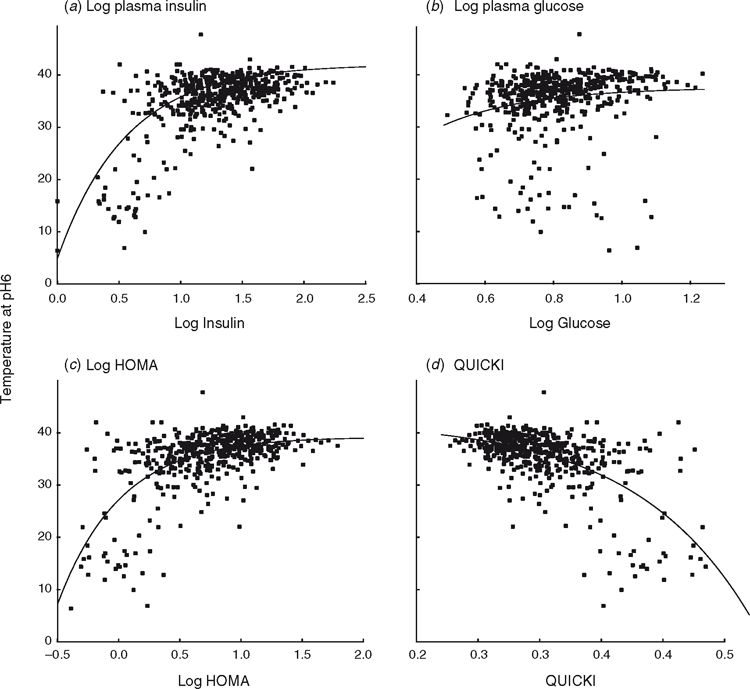
Temp@pH6 increased (R2 = 0.44, P < 0.001) in an exponential manner with increasing plasma insulin concentrations (Fig. 8a). There was also an exponential increase in Temp@pH6 with increasing plasma glucose although the relationship was not as strong as for insulin (R2 = 0.028, P < 0.001) (Fig. 8b). Temp@pH6 increased exponentially with increasing HOMA (R2 = 0.40, P < 0.001, Fig. 8c) and decreased with QUICKI (R2 = 0.40, P < 0.001, Fig. 8d) indicating increased insulin resistance and decreased insulin sensitivity, respectively.
Colour and weep
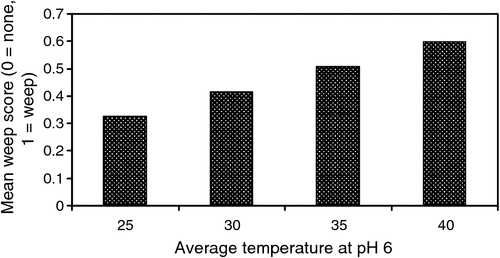
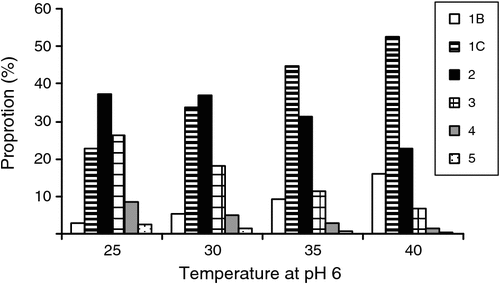
The mean weep score on the longissimus thoracis muscle at grading increased, as the Temp@pH6 increased from 25 to 40°C (P < 0.05; Fig. 9). The occurrence of pale meat colour scores increased, and of dark meat colour scores decreased, as the Temp@pH6 increased from 25 to 40°C (P < 0.05; Fig. 10).
|
|
Discussion
Across the seven plants included in the study, the incidence of high rigor temperature carcasses was 71.8%, which was higher than expected. It is not possible to compare this directly to historical data in Australia or overseas as this is the first study to quantify the occurrence of high rigor temperature across a beef industry. In the 1970s in Canada, a survey of 1200 beef carcasses reported that 15% of carcasses had a pH ≤6.25 in the semimembranosus muscle at 1 h post slaughter and defined these carcasses as ‘faster rigor’ onset (Khan and Ballantyne 1973). In their study, the semimembranosus muscle had a similar mean and range in 1-h post-mortem pH to the longissimus dorsi muscle, thus their results can be compared with our data on the longissimus thoracis (~dorsi) muscle. Using the first pH measurement at 30–60 min post mortem in our study, 75% of the carcasses had a pH ≤6.25, clearly indicating faster rates of pH fall in our survey than in the 1970s study in Canada.
There was considerable variation in the occurrence of % high temperature beef carcasses between plants, ranging from ~46 to 94% between plants. The variation in the occurrence of high rigor temperature between plants is consistent with the factors in the model shown to influence the occurrence. For example, plants with a high occurrence of high rigor temperature had a high proportion of grain-fed cattle. Considering the effects of high rigor temperature on consumer eating quality, particularly aging potential, colour and weep (Kim et al. 2014a, 2014b; Warner et al. 2014a, 2014b), it is important to examine factors which contribute to the occurrence and this is discussed below.
This study showed an increase in the incidence of % high rigor temperature and Temp@pH6 with longer duration of the rigidity probe being used. This is logical as the frequency at which rigidity probes operate [40–50 Hz; Food Science Australia (2006)] is also known to generally cause the post-mortem pH fall to increase (Devine et al. 2004; Food Science Australia 2006). But this is the first time, as far we know, that the effect of the rigidity probe has specifically been identified as the main contributor to the occurrence of high rigor temperature beef carcasses. Different electrical inputs speed up the process of glycolysis through their impact on the rate of pH fall and thus will impact on temperature at rigor (Simmons et al. 2006). Electrical inputs can occur at the immobiliser, stimulation or bleed rail and also at the hide puller, where the rigidity probe delivers the current. The large forces involved with beef downward hide pullers can be sufficient to cause ‘broken backs’ and damage to the muscle, which can be overcome by applying an electrical current to the back of the carcass (Food Science Australia 2006). In order to get sufficient energy into the back muscle for adequate contraction, large AC voltages are applied [typically 180V rms, 50 Hz; Food Science Australia (2006)], which is in the range for muscle stimulation and pH fall (Devine et al. 2004). Immobilisers are used to limit the risk of injury to workers, after the stunned animal falls out of the ‘knocking’ box, and enable shackling of the leg while holding the animal relatively immobile (Food Science Australia 2006). In Australia, the immobilisers used on cattle are generally high frequency (>500 Hz) and thus will have minimal effect on the rate of pH fall, in comparison to low frequency immobiliser systems (Lombard et al. 2008; Simmons et al. 2008). The bleed (electrical stimulator for enhanced bleeding) stimulator used at plant T was applied at a frequency of 5 Hz, again a frequency known to have minimal effect on pH fall (Devine et al. 2004) although it was only used on a small number of carcasses. The electrical stimulator used at plant A used 14-Hz frequency, a frequency known to induce maximum pH fall (Devine et al. 2004).
In our study, a longer duration of total electrical inputs (immobiliser plus bleed or electrical stimulator rigidity probe) being delivered into beef carcasses on the slaughter floor did not influence the rigor temperatures. Logically, the incidence of high rigor temperature should increase with a longer duration of total electrical inputs. The most probable reason for this is that for the majority of carcasses with more than one electrical input, the ‘Total Inputs’ comprised those with inputs at the hide puller and the rigidity probe. As described above, the electrical inputs at the immobiliser should have minimal effect on pH fall thus explaining the lack of effect of the ‘Total Inputs’ on the rigor temperature. Petch and Gilbert (1997) showed that the combination of electrical inputs during the different stages of the slaughter floor needs to be monitored in order to optimise meat quality and prevent over-stimulation and high drip losses in both beef and lamb carcasses. From this study, it is recommended that the electrical inputs at the rigidity probe, during hide pulling, should be minimised if possible. For example, reducing the duration of electrical input at the rigidity probe from 20 to 10 s, reduced the % high rigor temperature from 84 to 58%.
There was an increase in Temp@pH6 and % high rigor temperature carcasses with increasing carcass weight and also carcass fatness, which varied with the feed type in the case of carcass fatness. Factors that impede heat dissipation such as increased carcass weight and fat thickness have previously been shown to increase glycolytic rate (Koohmaraie et al. 1988) and thus increase the Temp@pH6. Thus the rate of temperature change is slowest for large, heavy carcasses and also for deep muscles (Jacob and Hopkins 2014). Hot fat trimming, which involves removal of subcutaneous and organ fat before chilling, has been investigated for the reduction of PSE (pale, soft exudative) in pork carcasses (Milligan et al. 1998). In our study, grass-fed cattle had a higher incidence of high rigor temperature in fatter carcasses, thus it is suggested that fat trimming could be used to accelerate the temperature decline in these carcasses. In contrast, there was no relationship between carcass fatness and temperature at rigor for carcasses from grain-fed animals, suggesting that other interventions are required (or combinations of interventions), such as on-farm betaine feeding (DiGiacomo et al. 2014a, 2014b), pre-slaughter interventions at the plant such as showering or shade provision or post-slaughter interventions such as vascular flushing, hot boning, opening of seams, very fast chilling or immersion cooling (Jacob and Hopkins 2014; Jacob et al. 2014a).
Female cattle had a lower Temp@pH6 and % high rigor temperature carcasses than male cattle. As the female cattle had lower carcass weights as well as lower P8 fat depth, this may be the reason for the lower rigor temperature. Little is known about the effect of anabolic steroid treatment on the body temperature of cattle (Clarke et al. 2012) and it is possible that the higher % rigor temperature in male castrated cattle may have been caused by the use of HGP (Hormonal Growth Promotants). Unfortunately the HGP implant history was not available for the beef carcasses in this study.
The higher incidence of high rigor temperature in cattle grain-fed for more than 70 days is consistent with anecdotal industry reports of faster pH fall in grain-fed cattle. This could be explained by several factors, alone or in combination. First, grain-fed cattle have recently been reported to have a higher core body temperature by 0.3–0.4°C than grass-fed cattle (Jacob et al. 2014b). In this context, dairy cattle fed concentrate rations containing rapidly fermentable wheat had a higher flank temperatures as well as greater differences between left and right flank temperatures than dairy cows fed maize-based diets (see Dunshea et al. 2013) indicating that the type of grain can also impact on body temperature. Second, as discussed above, the rate of temperature decline post mortem would be slower for the fatter, heavier carcasses resulting from grain feeding. Finally, obese humans are more susceptible to heat stress than non-obese individuals as they have a reduced ability to dissipate heat (Kanikowska et al. 2013), and the same might be true of fat long-fed cattle.
In this study, we demonstrated an association between blood insulin and other indices of insulin resistance at slaughter and the Temp@pH6. Intramuscular and other fat accumulation is associated with insulin resistance in humans (Goodpaster et al. 1997; Kim et al. 2006; Komiya et al. 2006) and obese individuals have difficulty dissipating heat (Kanikowska et al. 2013). As reviewed by DiGiacomo et al. (2014a), long grain feeding is known to increase fat deposition and is postulated to elevate circulating glucose and insulin, presumably through inducing a state of insulin resistance. A decreased ability to dissipate heat due to insulin resistance may contribute to the increased Temp@pH6 in long-fed cattle. An increase in body temperature is associated with pre-slaughter stress in both cattle (Jacob et al. 2014b) and sheep (Pighin et al. 2014) and we postulate that this would combine with the higher core body temperature in grain-fed cattle (Jacob et al. 2014b), and fatter grass-fed cattle, to create high muscle temperatures conducive to a high rigor temperature.
The post-slaughter time to reach a pH of 6 in the longissimus lumborum muscle was used to predict the % high rigor temperature carcasses in grain-fed and grass-fed carcasses. The model predicted that if the pH reached 6 at 65 or 105 min post slaughter, there would be 75–73% (grain-grass) or 19–7% (grain-grass), respectively, high rigor temperature carcasses. Thus measuring the pH in the longissimus lumborum muscle at ~1–2 h post slaughter should give a good indication of the likelihood of the carcass being a ‘high rigor temperature’ carcass. Provided measurements are conducted across a representative range of categories and mobs of cattle, it should also give a good indication of incidence of ‘high rigor temperature’ beef carcasses for the plant overall. In pigs, the prediction of whether a carcass is likely to become PSE is undertaken by measuring pH at 45 min post slaughter (pH45) where if the pH45 is <6.0, the carcass will be PSE (Warriss and Brown 1987). Beef carcasses are traditionally recognised to have a much slower rate of pH fall (Pearson and Young 1989). Optimum tenderness is achieved in beef longissimus muscle if the pH at 1.5 h is 5.9–6.2 (Hwang and Thompson 2001b) and a pH at 3 h post mortem <5.6 is reported to result in significantly tougher meat in beef longissimus muscle, due to high rigor temperature toughening (Pike et al. 1993). Thus we suggest that a pH measurement in the beef longissimus muscle at 1.5 h post slaughter would allow prediction of whether the carcass will be high rigor temperature and also improve the accuracy of prediction of sensory acceptability.
The occurrence of high pHu carcasses was 11.2%, which is similar to the 9.6% incidence reported using a similar cutoff for pHu (pHu >5.8), for 3850 beef carcasses in Victoria 25 years ago (Warner et al. 1988). The 11.2 and 9.3% of carcasses measured/graded as high pHu and dark-coloured, respectively, is higher than the non-compliance for these traits of 4.3 and 4.8% for MSA beef carcasses in 2012–13 (Meat Standards Australia 2013). Further discussion of the factors influencing the occurrence of dark-coloured carcasses and the relationship between dark colour at grading and pHu in this study is given in Hughes et al. (2014).
Summary
The survey of beef carcasses across beef processing plants in Australia clearly showed a high incidence of high rigor temperature with a particularly high incidence in grain-fed cattle. There were several factors that impacted on the Temp@pH6 and % high rigor temperature. Production factors that impacted on Temp@pH6, were feed type, days on grain feeding and sex of the animal. Increased electrical inputs for the hide puller rigidity probe, but not for the immobiliser or stimulator, also increased Temp@pH6 and the % high rigor temperature as did carcass weight and fatness. It appeared that both increasing carcass weight and fat thickness combine to reduced muscle cooling rate and accelerate pH decline.
Considering the effects of high rigor temperature on consumer eating quality, particularly aging potential, colour and weep, it is important to reduce the incidence in the Australian beef industry. Recommendations for reducing the incidence, arising from this study, include;
-
Monitoring of all electrical inputs on the slaughter floor. In particular reduce the time the rigidity probe is delivering electricity to a carcass.
-
For grass-fed cattle, consider trimming subcutaneous fat from portions of the carcass before chilling in order to increase temperature decline in susceptible muscles (hot fat trimming).
-
For cattle fed grain for longer than 70 days, undertake further research.
-
In order to reduce the incidence of high rigor temperature (temperature >35°C at pH 6) in grain-fed beef carcasses, methods for identifying high rigor temperature carcasses will be required and while some management strategies can be implemented now, others require further research.
Acknowledgements
The assistance of Linden Cowper and Rob Strachan (Meat Standards Australia) and Matthew Kerr and Ian McCauley (Department of Primary Industries, Victoria) in collecting the data and conducting assays is gratefully acknowledged. The funding provided by Meat and Livestock Australia and Department of Primary Industries, Victoria is also gratefully acknowledged. Finally we are grateful for the eager and willing participation of the seven beef processing plants included in the study.
References
AUS-MEAT (1996) ‘Chiller assessment standards.’ (AUS-MEAT Ltd: Brisbane)Clarke SD, Clarke IJ, Rao A, Cowley MA, Henry BA (2012) Sex differences in the metabolic effects of testosterone in sheep. Endocrinology 153, 123–131.
| Sex differences in the metabolic effects of testosterone in sheep.Crossref | GoogleScholarGoogle Scholar | 1:CAS:528:DC%2BC38XovFWmsg%3D%3D&md5=1178822f78a25ec6e08e98eb47efa7eaCAS | 22128020PubMed |
Devine CE, Wahlgren NM, Tornberg E (1999) Effect of rigor temperature on muscle shortening and tenderisation of restrained and unrestrained beef M. longissimus thoracicus et lumborum. Meat Science 51, 61–72.
| Effect of rigor temperature on muscle shortening and tenderisation of restrained and unrestrained beef M. longissimus thoracicus et lumborum.Crossref | GoogleScholarGoogle Scholar | 1:STN:280:DC%2BC3MbnsVWqtA%3D%3D&md5=0fa670a2c0be3f3e48dbef00926751beCAS | 22061537PubMed |
Devine CE, Payne SR, Wells RW (2002) Effect of muscle restraint on sheep meat tenderness with rigor mortis at 18-C. Meat Science 60, 155–159.
| Effect of muscle restraint on sheep meat tenderness with rigor mortis at 18-C.Crossref | GoogleScholarGoogle Scholar | 22063239PubMed |
Devine CE, Hopkins DL, Hwang IH, Ferguson DM, Richards I (2004) Electrical stimulation. In ‘Encyclopedia of meat sciences’. (Ed. Werner Klinth Jensen) pp. 413–423. (Elsevier: Oxford)
DiGiacomo K, Leury BJ, Dunshea FR (2014a) Potential nutritional strategies for the amelioration or prevention of high rigor temperature in cattle – a review. Animal Production Science 54, 430–443.
| Potential nutritional strategies for the amelioration or prevention of high rigor temperature in cattle – a review.Crossref | GoogleScholarGoogle Scholar |
DiGiacomo K, Warner RD, Leury BJ, Gaughan JB, Dunshea FR (2014b) Dietary betaine supplementation has energy-sparing effects in feedlot cattle during summer, particularly in those without access to shade. Animal Production Science 54, 450–458.
| Dietary betaine supplementation has energy-sparing effects in feedlot cattle during summer, particularly in those without access to shade.Crossref | GoogleScholarGoogle Scholar |
Dunshea FR, Leury BJ, Fahri F, DiGiacomo K, Hung A, Chauhan S, Clarke IJ, Collier R, Little S, Baumgard L, Gaughan JB (2013) Amelioration of thermal stress impacts in dairy cows. Animal Production Science 53, 965–975.
| Amelioration of thermal stress impacts in dairy cows.Crossref | GoogleScholarGoogle Scholar |
Fischer C, Hamm R (1980) Biochemical studies on fast glycolysing bovine muscle. Meat Science 4, 41–49.
| Biochemical studies on fast glycolysing bovine muscle.Crossref | GoogleScholarGoogle Scholar | 1:CAS:528:DyaL3cXhs1agsrw%3D&md5=e89cf9426846eef95a7e88012bf2e239CAS | 22055486PubMed |
Food Science Australia (2006) Electrical inputs during beef processing. Meat Technology Update 1/06 – February 2006. Available at http://www.meatupdate.csiro.au/data/MEAT_TECHNOLOGY_UPDATE_06-1.pdf [Verified 3 February 2014]
Goodpaster BH, Thaete FL, Simoneau JA, Kelley DE (1997) Subcutaneous abdominal fat and thigh muscle composition predict insulin sensitivity independently of visceral fat. Diabetes 46, 1579–1585.
| Subcutaneous abdominal fat and thigh muscle composition predict insulin sensitivity independently of visceral fat.Crossref | GoogleScholarGoogle Scholar | 1:CAS:528:DyaK2sXmsVWnuro%3D&md5=0d29151cb7b98ae2ee3a38ab73b9992dCAS | 9313753PubMed |
Greaser ML (1986) Conversion of muscle to meat. In ‘Muscle as food’. (Ed. PJ Bechtel) pp. 37–87. (Academic Press: London, UK)
Hughes JM, Kearney G, Warner RD (2014) Improving beef meat colour scores at carcass grading. Animal Production Science 54, 422–429.
| Improving beef meat colour scores at carcass grading.Crossref | GoogleScholarGoogle Scholar |
Hwang IH, Thompson JM (2001a) The effect of time and type of electrical stimulation on the calpain system and meat tenderness in beef longissimus dorsi muscle. Meat Science 58, 135–144.
| The effect of time and type of electrical stimulation on the calpain system and meat tenderness in beef longissimus dorsi muscle.Crossref | GoogleScholarGoogle Scholar | 1:CAS:528:DC%2BD3MXit1Wgurg%3D&md5=270f7e9f2075e49cd0428af203c46a10CAS | 22062108PubMed |
Hwang IH, Thompson JM (2001b) The interaction between pH and temperature decline early postmortem on the calpain system and objective tenderness in electrically stimulated beef longissimus dorsi muscle. Meat Science 58, 167–174.
| The interaction between pH and temperature decline early postmortem on the calpain system and objective tenderness in electrically stimulated beef longissimus dorsi muscle.Crossref | GoogleScholarGoogle Scholar | 1:CAS:528:DC%2BD3MXit1Wgurc%3D&md5=40939faba202cd6c32db4d2d60e5d1ecCAS | 22062112PubMed |
Jacob RH, Hopkins DL (2014) Techniques to reduce the temperature of beef muscle early in the post mortem period – a review. Animal Production Science 54, 482–493.
| Techniques to reduce the temperature of beef muscle early in the post mortem period – a review.Crossref | GoogleScholarGoogle Scholar |
Jacob RH, Beatty DT, Warner RD (2014a) A preliminary study into the use of ‘heat pipes’ to prevent high rigor temperature in beef carcasses by increasing cooling rate. Animal Production Science 54, 504–509.
| A preliminary study into the use of ‘heat pipes’ to prevent high rigor temperature in beef carcasses by increasing cooling rate.Crossref | GoogleScholarGoogle Scholar |
Jacob RH, Surridge VSM, Beatty DT, Gardner GE, Warner RD (2014b) Grain feeding increases core body temperature of beef cattle. Animal Production Science 54, 444–449.
| Grain feeding increases core body temperature of beef cattle.Crossref | GoogleScholarGoogle Scholar |
Kanikowska D, Sato M, Sugenoya J, Shimizu Y, Nishimura N, Inukai Y, Iwase S (2013) Attenuated thermoregulatory responses with increased plasma osmolality in obese subjects during two seasons. International Journal of Biometeorology 57, 663–667.
| Attenuated thermoregulatory responses with increased plasma osmolality in obese subjects during two seasons.Crossref | GoogleScholarGoogle Scholar | 23053063PubMed |
Katz A, Nambi SS, Mather K, Baron AD, Follmann DA, Sullivan G, Quon MJ (2000) Quantitative insulin sensitivity check index: a simple, accurate method for assessing insulin sensitivity in humans. The Journal of Clinical Endocrinology and Metabolism 85, 2402–2410.
| Quantitative insulin sensitivity check index: a simple, accurate method for assessing insulin sensitivity in humans.Crossref | GoogleScholarGoogle Scholar | 1:CAS:528:DC%2BD3cXlt1Wntrg%3D&md5=0a1983c2baacfbe9b2829f845965b182CAS | 10902785PubMed |
Khan AW, Ballantyne WW (1973) Post-slaughter pH variation in beef. Journal of Food Science 38, 710–711.
| Post-slaughter pH variation in beef.Crossref | GoogleScholarGoogle Scholar |
Kim C, Park J, Kang E, Ahn C, Cha B, Lim S, Kim K, Lee H (2006) Comparison of body fat composition and serum adiponectin levels in diabetic obesity and non-diabetic obesity. Obesity (Silver Spring, Md.) 14, 1164–1171.
| Comparison of body fat composition and serum adiponectin levels in diabetic obesity and non-diabetic obesity.Crossref | GoogleScholarGoogle Scholar | 1:CAS:528:DC%2BD28XpslSqsLk%3D&md5=a68ac70aa8758d1856d9d396a43aee7eCAS |
Kim YHB, Kerr M, Geesink G, Warner RD (2014a) Impacts of hanging method and high pre-rigor temperature and duration on quality attributes of ovine muscles. Animal Production Science 54, 414–421.
| Impacts of hanging method and high pre-rigor temperature and duration on quality attributes of ovine muscles.Crossref | GoogleScholarGoogle Scholar |
Kim YHB, Warner RD, Rosenvold K (2014b) Influence of high pre-rigor temperature and fast pH fall on muscle proteins and meat quality: a review. Animal Production Science 54, 375–395.
| Influence of high pre-rigor temperature and fast pH fall on muscle proteins and meat quality: a review.Crossref | GoogleScholarGoogle Scholar |
Komiya H, Mori Y, Yokose T, Kurokawa N, Horie N, Tajima N (2006) Effect of intramuscular fat difference on glucose and insulin reaction in oral glucose tolerance test. Journal of Atherosclerosis and Thrombosis 13, 136–142.
| Effect of intramuscular fat difference on glucose and insulin reaction in oral glucose tolerance test.Crossref | GoogleScholarGoogle Scholar | 1:CAS:528:DC%2BD28XnvVyrsr8%3D&md5=bc274bb0a17761af8a53b23392419a38CAS | 16835468PubMed |
Koohmaraie M, Seideman SC, Crouse JD (1988) Effect of subcutaneous fat and high temperature conditioning on bovine meat tenderness. Meat Science 23, 99
| Effect of subcutaneous fat and high temperature conditioning on bovine meat tenderness.Crossref | GoogleScholarGoogle Scholar | 1:STN:280:DC%2BC3MbmvFWqug%3D%3D&md5=e01a12d98f199d48e7cc87e9737989aeCAS | 22055606PubMed |
Locker RH, Hagyard CJ (1963) A cold shortening effect in beef muscles. Journal of the Science of Food and Agriculture 14, 787–793.
| A cold shortening effect in beef muscles.Crossref | GoogleScholarGoogle Scholar | 1:CAS:528:DyaF2cXlsFOiug%3D%3D&md5=ebcef65dee72d68932c06451127cd7e1CAS |
Lombard A, Johnson NV, McGurk JM, Cummings TL, Daly CC, Simmons NJ (2008) The effect of different electrical immobilisation and stimulation procedures on meat quality of beef. International Congress of Meat Science and Technology, Cape Town, South Africa 54, Paper 7B.21.
Marsh BB (1954) Rigor mortis in beef. Journal of the Science of Food and Agriculture 5, 70–75.
| Rigor mortis in beef.Crossref | GoogleScholarGoogle Scholar | 1:CAS:528:DyaG2cXjtlKqsQ%3D%3D&md5=20c13aeeb6fdd9ec8cb0cb2d4e1acd6dCAS |
Meat Standards Australia (2013) ‘Meat Standards Australia Annual Outcomes Report 2012–2013.’ (Meat and Livestock Australia: North Sydney)
Milligan SD, Ramsey CB, Miller MF, Kaster CS, Thompson LD (1998) Resting of pigs and hot-fat trimming and accelerated chilling of carcasses to improve pork quality. Journal of Animal Science 76, 74–86.
Ostrowska E, Cross RF, Muralitharan M, Bauman DE, Dunshea FR (2002) Effects of dietary fat and conjugated linoleic acid on plasma metabolite concentrations and metabolic responses to homeostatic signals in pigs. The British Journal of Nutrition 88, 625–634.
| Effects of dietary fat and conjugated linoleic acid on plasma metabolite concentrations and metabolic responses to homeostatic signals in pigs.Crossref | GoogleScholarGoogle Scholar | 1:CAS:528:DC%2BD3sXktFKitw%3D%3D&md5=46c325decc0071ddf51afe5eba330fd0CAS | 12493084PubMed |
Pearson AM, Young RB (1989) Postmortem changes during conversion of muscle to meat. In ‘Muscle and meat biochemistry’. (Eds AM Pearson, RB Young) pp. 391–444. (Academic Press, Inc.: San Diego)
Petch PE, Gilbert KV (1997) Interaction of electrical processes applied during slaughter and dressing with stimulation requirements. International Congress of Meat Science and Technology, Auckland, NZ 43, 684–685.
Pighin DG, Brown W, Ferguson DM, Fisher AD, Warner RD (2014) Relationship between changes in core body temperature in lambs and post-slaughter muscle glycogen content and dark-cutting. Animal Production Science 54, 459–463.
| Relationship between changes in core body temperature in lambs and post-slaughter muscle glycogen content and dark-cutting.Crossref | GoogleScholarGoogle Scholar |
Pike MM, Ringkob TP, Beekman DD, Koh YO, Gerthoffer WT (1993) Quadratic relationship between early-post-mortem glycolytic rate and beef tenderness. Meat Science 34, 13–26.
| Quadratic relationship between early-post-mortem glycolytic rate and beef tenderness.Crossref | GoogleScholarGoogle Scholar | 1:CAS:528:DyaK3sXisFeltrk%3D&md5=4e8f2f89c9df9b4b2b21d0dec19eddf1CAS | 22060264PubMed |
Polkinghorne R, Thompson JM, Watson R, Gee A, Porter M (2008) Evolution of the Meat Standards Australia (MSA) beef grading system. Australian Journal of Experimental Agriculture 48, 1351–1359.
| Evolution of the Meat Standards Australia (MSA) beef grading system.Crossref | GoogleScholarGoogle Scholar |
Simmons NJ, Daly CC, Mudford CR, Richards I, Jarvis G, Pleiter H (2006) Integrated technologies to enhance meat quality – an Australasian perspective. Meat Science 74, 172–179.
| Integrated technologies to enhance meat quality – an Australasian perspective.Crossref | GoogleScholarGoogle Scholar | 1:STN:280:DC%2BC3MbnsFWksA%3D%3D&md5=fd5596cab7a420ca11aef1f550046612CAS | 22062726PubMed |
Simmons NJ, Daly CC, Cummings TL, Morgan SK, Johnson NV, Lombard A (2008) Reassessing the principles of electrical stimulation. Meat Science 80, 110–122.
| Reassessing the principles of electrical stimulation.Crossref | GoogleScholarGoogle Scholar | 1:STN:280:DC%2BC3MbnsFGgtA%3D%3D&md5=ba691c3afef5f5123464e742f680a88fCAS | 22063176PubMed |
Tarrant PV, Mothersill C (1977) Glycolysis and associated changes in beef carcasses. Journal of the Science of Food and Agriculture 28, 739–749.
| Glycolysis and associated changes in beef carcasses.Crossref | GoogleScholarGoogle Scholar | 1:CAS:528:DyaE2sXls1Kitbg%3D&md5=03dc1ca58578fb9c995d87844c8b3af0CAS |
Thompson JM, Perry D, Daly B, Gardner GE, Johnston DJ, Pethick DW (2006) Genetic and environmental effects on the muscle structure response post-mortem. Meat Science 74, 59–65.
| Genetic and environmental effects on the muscle structure response post-mortem.Crossref | GoogleScholarGoogle Scholar | 1:CAS:528:DC%2BD28Xms1GrsbY%3D&md5=3d30dde2c61a1d825d8a38f9663b2007CAS | 22062716PubMed |
Warner RD, Truscott TG, Eldridge GA, Franz PR (1988) A Survey of the incidence of high pH beef meat in Victorian abattoirs. International Congress of Meat Science and Technology, Brisbane, Australia 34, 150–151.
Warner RD, Kerr M, Kim YHB, Geesink G (2014a) Pre-rigor carcass stretching counteracts the negative effects of high rigor temperature on tenderness and water-holding capacity – using lamb muscles as a model. Animal Production Science 54, 494–503.
| Pre-rigor carcass stretching counteracts the negative effects of high rigor temperature on tenderness and water-holding capacity – using lamb muscles as a model.Crossref | GoogleScholarGoogle Scholar |
Warner RD, Thompson JM, Polkinghorne R, Gutzke D, Kearney GA (2014b) A consumer sensory study of the influence of rigor temperature on eating quality and ageing potential of beef striploin and rump. Animal Production Science 54, 396–406.
| A consumer sensory study of the influence of rigor temperature on eating quality and ageing potential of beef striploin and rump.Crossref | GoogleScholarGoogle Scholar |
Warriss PD, Brown SN (1987) The relationships between initial pH reflectance and exudation in pig muscle. Meat Science 20, 65–74.
| The relationships between initial pH reflectance and exudation in pig muscle.Crossref | GoogleScholarGoogle Scholar | 1:STN:280:DC%2BC3MbmvFCrsg%3D%3D&md5=4c4966c00b5c312b127ae94387f2f2bcCAS | 22056120PubMed |
Watson R, Gee A, Polkinghorne R, Porter M (2008a) Consumer assessment of eating quality – development of protocols for Meat Standards Australia (MSA) testing. Australian Journal of Experimental Agriculture 48, 1360–1367.
| Consumer assessment of eating quality – development of protocols for Meat Standards Australia (MSA) testing.Crossref | GoogleScholarGoogle Scholar |
Watson R, Polkinghorne R, Thompson JM (2008b) Development of the Meat Standards Australia (MSA) prediction model for beef palatability. Australian Journal of Experimental Agriculture 48, 1368–1379.
| Development of the Meat Standards Australia (MSA) prediction model for beef palatability.Crossref | GoogleScholarGoogle Scholar |


